Public Tertiary Education Expenditure in Portugal: a
Non-Parametric Efficiency Analysis
1António Afonso
2and Mariana Santos
3May 2004
Abstract
We employ a non-parametric methodology, Data Envelopment Analysis, to estimate efficiency scores for Portuguese public universities for 2001. Due to the tertiary education organisational features we consider universities as well as faculties and institutes as decision entities. Using frontier analysis we are able to separate universities/faculties/institutes that might qualify, as “performing well” from those were some improvement might increase its efficiency. This is a first effort of checking efficiency and productivity in Portuguese public tertiary education using non-parametric analysis.
JEL: C14, H52, I21, I28
Keywords: expenditure in tertiary education, efficiency, production possibility frontier, DEA
1
We are grateful to Miguel St. Aubyn for helpful comments. Any remaining errors are the responsibility of the authors. The opinions expressed herein are those of the authors and do not necessarily reflect those of the author’s employers.
2
ISEG/UTL - Technical University of Lisbon, CISEP – Research Centre on the Portuguese Economy, R. Miguel Lúpi 20, 1249-078 Lisbon, Portugal, email: [email protected].
3
Contents
1. Introduction...3
2. Stylised facts on public tertiary education in Portugal ...4
3. Analytical methodology...9
4. Non-parametric efficiency analysis of tertiary spending in Portugal ...15
4.1. Data and measurement issues ...15
4.2. DEA results of efficiency analysis ...16
4.3. Further sub-group analysis ...20
5. Conclusion ...24
Annex – Data and sources...26
1. Introduction
As Blanchard (2004) points out, good performance in higher education is expected to produce positive growth effects, and tertiary education in many European countries still lags behind the level achieved in other developed economies. On the other end, there is the overall idea, alleged by some academic work and held in reports from international organisations, that the public sector remains inefficient in most European countries. These two factors seem sufficient motivation to address the issue of the efficiency of public tertiary expenditure in Portugal.
The proper measurement of public sector performance, particularly when it concerns services provision, is a delicate empirical issue and the related literature, principally when it comes to aggregate data, is still limited. This measurement issue is here considered in terms of efficiency measures comparing public resources – total expenditures, dimension of staff – used by Portuguese public universities, and straightforward measure and/or indicator of the universities’ output, typically the number of students enrolled, both taking into consideration undergraduate and postgraduate students. To our knowledge no similar previous study exists for this specific universe. Furthermore, we are only aware of related papers by Coelli (1996) for Australian universities and by Førsund and Kalhagen (1999) for regional colleges in Norway.
This paper contributes to the literature by analysing the efficiency of resources used by Portuguese public universities to provide their services. With the use of frontier analysis we focus on how close public universities are to operating on the efficiency frontier. We study public expenditure efficiency of Portuguese universities in 2001 by applying a non-parametric methodology, Data Envelopment Analysis (DEA), to a set of 45 public universities/faculties/institutes and also to a sub-set of 36 faculties/institutes.
2. Stylised facts on public tertiary education in Portugal
The tertiary education sector in Portugal has traditionally been a public one. Only in the last decade privately run universities started to provide a more consistent alternative thereby increasing the offer of available places for students in the tertiary education level. Nevertheless, and since data regarding private tertiary education institutions, namely concerning total expenditures, are not easy to come across from a unified source, we will only address the public segment (by far the larger) of the tertiary education sector.
Portuguese tertiary public sector includes both Universities and the so-called “Institutos Politécnicos.” While the Politécnicos have been more oriented to 3-year courses, Universities offer 4 or 5-year graduate courses, and they are also entitled to give Masters and PhD courses.4 Again, in our analysis, only Universities will be used, and we allow for some sensitivity analysis of the results taking account of both graduation and postgraduation students in the calculations.
Additionally, there are also tertiary education courses provided by military institutions and by the Portuguese Catholic University. Given the particularities of such institutions, data availability, and also in order to keep the sample as homogeneous as possible, those institutions are not included in the sample.
The number of places available in tertiary education is determined every year by the institutions and approved by the government. All courses have a numerus clausus
fixed by each institution according to its capacity. Additionally, Faculties and Institutes have to specify a minimum entrance requirement for their various courses.5
4
The academic degrees confered by Portuguese Universities are the following: graduation or first degree (usually 4-5 years); Masters degree (includes writing a thesis); PhD degree (includes writing a thesis); and aggregation.
5
According to the 2001 figures, our sample of public universities covers 75 per cent of the global number of students in public, military, or private universities (see Figure 1). Moreover, and in what concerns postgraduate students, our sample covers around 86 per cent of total masters students in 2001.
Between 1997 and 2001, the overall number of graduation students in the tertiary education level increased 13.9 per cent (see Figure 1), roughly 3.3 per cent per year. This implies overall increases in the 1997-01 period of 10.4 per cent in the public universities and of 60.5 per cent in the public “Politécnicos”. There were opposite changes in the number of students over that period in private and co-operative universities, -9,9 per cent, in the Portuguese Catholic University, -4.8 per cent, and in the other private and co-operative institutions, -6.3 per cent.
Figure 1 - Undergraduate students in Portuguese tertiary education sector (1997-2001)
0 20000 40000 60000 80000 100000 120000 140000 160000
1997 1998 1999 2000 2001
Students
Public Universities Private and co-operative Universities
Portuguese Catholic University Public "Politécnico"
Private and co-operative - other institutions
Source: Direcção-Geral do Ensino Superior.
Notes: Public Universities includes military universities. Public "Politécnico" includes military institutions.
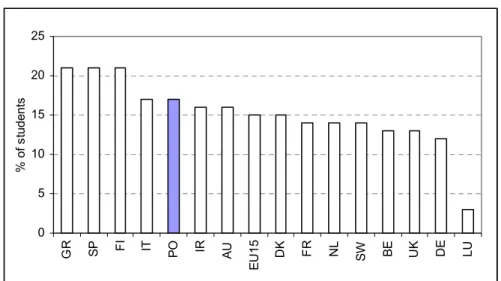
doubled over the last 25 years.6 More precisely in Portugal, over four times as many students were enrolled in 1999/2000 as in 1975/76, making it the country with the greatest growth in the EU.
Figure 2 - Students in tertiary education, as % of all students, 1999/2000
0 5 10 15 20 25
GR SP FI IT PO IR AU
EU
1
5
DK FR NL SW BE UK DE LU
% o f s tud en ts
Source: Eurostat (2002).
However, if one considers, for instance, the percentage of population between 30 and 34 years, that hold a tertiary education qualification in 2000, this percentage was only 11.3 per cent in Portugal, well below the 24.6 per cent in the EU15 (see Figure 3).
Figure 3 - Proportion of population aged between 30 and 34 with tertiary education qualifications, 2000 0 5 10 15 20 25 30 35 40 45 FI BE
DK SW SP UK IR FR NL GR DE
EU
1
5
LU AU IT PO
% o f s tud en ts
Source: Eurostat (2002).
6
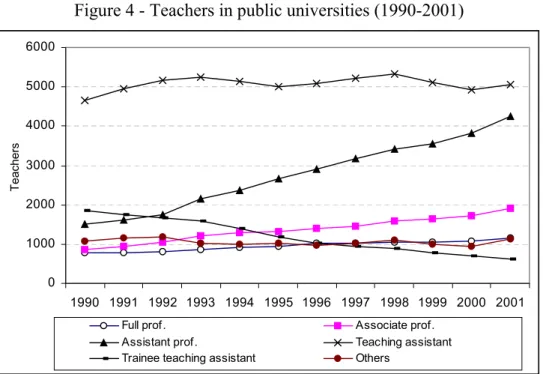
During the period 1997-2001, the overall number of teachers in public universities in Portugal increased around 9.8 per cent. On a broader perspective, one may notice that the number of teachers increased by 31.7 per cent between 1990 and 2001 (see Figure 4), some 2.5 per cent every year.
Figure 4 - Teachers in public universities (1990-2001)
0 1000 2000 3000 4000 5000 6000
1990 1991 1992 1993 1994 1995 1996 1997 1998 1999 2000 2001
T
eac
her
s
Full prof. Associate prof.
Assistant prof. Teaching assistant
Trainee teaching assistant Others
Source: Direcção-Geral do Ensino Superior.
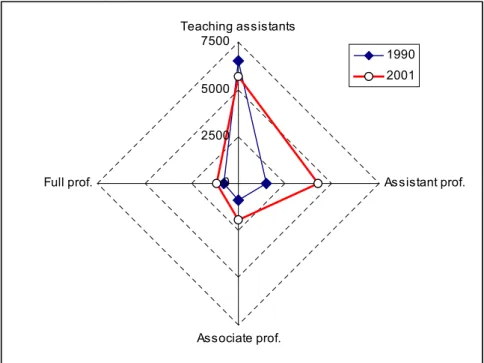
Figure 5 - Structure of teachers’ levels in public universities: 1990, 2001
0 2500 5000 7500
Teaching assistants
Assistant prof.
Associate prof. Full prof.
1990
2001
Source: Direcção-Geral do Ensino Superior.
Note: Teaching assistants include trainee-teaching assistants.
Figure 6 - Professors pyramid in the Portuguese public university system: 2001
`
3. Analytical methodology
We use a non-parametric method that allows the estimation of efficiency frontiers and efficiency losses – Data Envelopment Analysis (DEA). This method was originally developed and applied to firms that convert inputs into outputs. Coelli, Rao and Battese (1998) and Sengupta (2000) introduce the reader to this literature and describe several applications.7
The term “firm”, sometimes replaced by the more encompassing Decision Making Unit (henceforth DMUs), the term coined by Charnes et al. (1978), may include non-profit or public organisations, such as hospitals, universities or local authorities. For instance, De Borger and Kerstens (1996) analyse the efficiency of Belgian local governments.
On related work, Gupta and Verhoeven (2001) use FDH analysis to measure the efficiency of government expenditure on education and health in a set of countries in Africa. Clements (2002) assessed the efficiency of education spending in the European Union. St. Aubyn (2002) reports results of FDH analysis applied to
7
education and health spending in OECD countries. Afonso, Schuknecht and Tanzi (2003) studied public spending efficiency for the OECD countries using composite indicators, and Afonso and St. Aubyn (2004) use both FDH and DEA for a cross-country analysis of efficiency in education and health.
The general relationship that we expect to test, regarding efficiency in tertiary education, can be given by the following function for university i:
) , ( i i
i f X Z
Y = , i=1,…,n (1)
where we have Yi – set of indicators reflecting education output; Xi – spending on university i, either per student or in some other measure; Zi – control variables, both quantitative and socio-economic education related variables.
Data Envelopment Analysis, originating from Farrell’s (1957) seminal work and popularised by Charnes, Cooper and Rhodes (1978), assumes the existence of a convex production frontier, a hypothesis that is not required for instance in the FDH approach. The production frontier in the DEA approach is constructed using linear programming methods. The terminology “envelopment” stems out from the fact that the production frontier envelops the set of observations.8
In this sub-section we illustrate the DEA framework with the calculation of technical efficiency measures by using an oriented example. The purpose of an input-oriented example is to study by how much input quantities can be proportionally reduced without changing the output quantities produced.
Alternatively, and by computing output-oriented measures, one could also try to assess how much output quantities can be proportionally increased without changing the input quantities used. The two measures provide the same results under constant returns to scale but give different values under variable returns to scale. Nevertheless,
8
and since the computation uses linear programming, not subject to statistical problems such as simultaneous equation bias and specification errors, both output and input-oriented models will identify the same set of efficient/inefficient producers or DMUs.9
The analytical description of the linear programming problem to be solved, in the constant-returns to scale hypothesis, is sketched below. Suppose there are k inputs and
m outputs for n DMUs. For the i-th DMU, yi is the column vector of the inputs and xi is the column vector of the outputs. We can also define X as the (k´n) input matrix and Y as the (m´n) output matrix. The DEA model is then specified with the following mathematical programming problem, for a given i-th DMU: 10
0 1 ' 1 0 0 to s. min , ³ = ³ -³ + -l l l q l q l q n X x Y y i i . (2)
In problem (2), q is a scalar (that satisfies q£1), more specifically it is the efficiency score that measures technical efficiency. It measures the distance between a university and the efficiency frontier, defined as a linear combination of best practice observations. With q<1, the university is inside the frontier (i.e. it is inefficient), while q=1 implies that the university is on the frontier (i.e. it is efficient).
The vector l is a (n´1) vector of constants that measures the weights used to compute the location of an inefficient DMU if it were to become efficient. The inefficient DMU would be projected on the production frontier as a linear combination of those weights, related to the peers of the inefficient DMU. The peers are other DMUs that are more efficient and therefore are used as references for the inefficient DMU. n1 is a n-dimensional vector of ones. The restriction n1'l=1 imposes convexity of the
9
In fact, and as mentioned namely by Coelli et al. (1998), the choice between input and output orientations is not crucial since only the two measures associated with the inefficient units may be different between the two methodologies.
10
frontier, accounting for variable returns to scale. Dropping this restriction would amount to admit that returns to scale were constant. Notice that problem (2) has to be solved for each of the n DMUs in order to obtain the n efficiency scores.
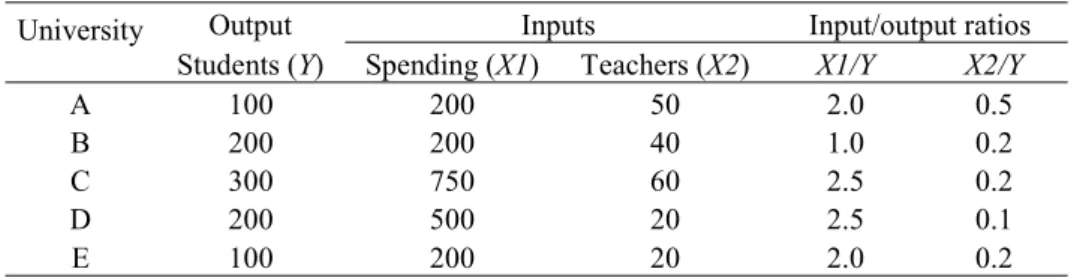
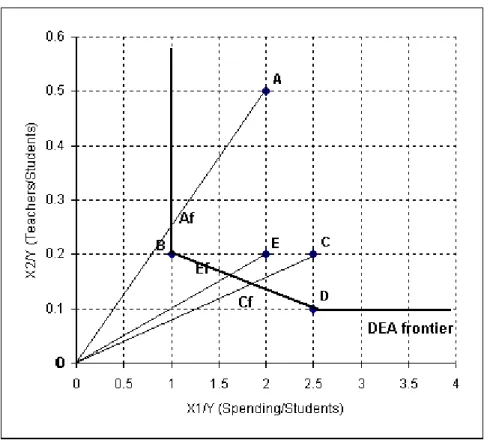
We use an example with five universities that teach courses to students by using two inputs: the number of teachers and the value of spending used. The universities produce a single output, the number of students enrolled. We adopt in our example an input-oriented method because we assume that management and economic decision-makers have more control over inputs than over outputs. Table 1 reports the data used for the example.
Table 1 - One output, two input example for 5 universities
Output Inputs Input/output ratios
University
Students (Y) Spending (X1) Teachers (X2) X1/Y X2/Y
A 100 200 50 2.0 0.5
B 200 200 40 1.0 0.2
C 300 750 60 2.5 0.2
D 200 500 20 2.5 0.1
E 100 200 20 2.0 0.2
Figure 7 - DEA example: one output, two inputs (input-oriented) for 5 universities (CRS)
The technical efficiency of a university is measured along a ray from the origin, O, to the point that represents that university in the diagram.11 For instance, the efficiency of say university C is the ratio of the distance from the origin, point O, to point Cf (on the frontier), over the distance from the origin to point C. In other words the efficiency of university C is given by OCf/OC=0.727. Therefore, university C should be able to proportionally reduce the consumption of all inputs by 27.3% without reducing output. This would imply production at point Cf in Figure 7.
Observe that the projected point Cf on the DEA frontier is located in the segment of the frontier that connects universities B and D. In the literature these two universities would be referred as the peers of university C since they give the efficient production for university C. Indeed, point Cf is a linear combination of points B and D and, as we
11
already mentioned, the weights are obtained from solving the linear programming problem (2) for university C.
Table 2 summarises the results of solving the 5 linear programming problems for our five-university example.12 Notice that both universities B and D are efficient since they have technical efficiency scores of 1.0, and they are themselves peers and are located on the DEA frontier. On the other hand, universities A, C and E are not efficient and are enveloped by the DEA frontier.
Table 2 - One output, two input example for 5 universities, input-oriented constant returns to scale
University q lA lB lC lD lE
A 0.500 - 0.500 - -
-B 1.000 - 1.000 - -
-C 0.727 - 0.682 - 0.818
-D 1.000 - - - 1.000
-E 0.800 - 0.300 - 0.200
-Returning to the case of inefficient university C, we can now more precisely determine the changes in the use of inputs that would be necessary for this university to become efficient and to be located on the DEA frontier. Table 3 summarises the results for our university C, and also reports the radial movements in terms of reduction in the inputs.
Table 3 - One output, two input example, input-oriented constant returns to scale, summary results for university C
University C Original values
Radial movement
Projected (target) values
Students (Y) 300.000 0.000 300.000
Spending (X1) 750.000 -204.750 545.250
Teachers (X2) 60.000 -16.380 43.620
Using the efficiency score of 0.727, the target input ratios of university C would be then computed as 0.727´[2.5; 0.2]=[1.818; 0.145]. This implies a radial shift of university C towards point Cf on the DEA frontier. To “produce” the same amount of output, 300 students, and to be efficient, university C would then need to use the
12
following units of both inputs: 300´[1.818; 0.145] = [545.250; 43.620]. In other words, it would be enough to use only 545 units of spending (instead of 750) and 44 teachers (instead of 60).
4. Non-parametric efficiency analysis of tertiary spending in Portugal
4.1. Data and measurement issues
In our study we assess the efficiency of 45 Portuguese public universities in 2001. More precisely, we use data for faculties, institutes or simply for the whole university, depending on the data segregation. Therefore, we collected data for 36 faculties (or institutes), while for 9 DMUs (universities) only aggregated data was available and not by faculty.13 All these DMUs are listed in the Annex alongside with a short code name, useful to identify each faculty in terms of the results.
The way we choose our DMUs stems from the fact that most public universities in Portugal aggregate several faculties or institutes, depending on the organisational framework adopted. For instance, in the Technical University of Lisbon there are 7 Institutes that teach, broadly speaking, courses on economics, engineering, architecture, veterinary, agronomy, political and social sciences, and sports. Other universities aggregate faculties instead of institutes as for instance the University of Porto or the University of Lisbon. Still other universities do not have a fully-fledged segmentation either in terms of institutes or in terms of faculties.
This said, our DMUs are both primarily faculties and institutes. This segregation of DMUs can also be found in the Annual State General Account (Conta Geral do Estado) taking into account the relative autonomy of the several the autonomous bodies of the Central Government. At the time of writing, 2001 is the last year when the Annual State General Account is available, and therefore the only publicly available homogeneous source of total spending in public university.
13
Concerning the selection of outputs and inputs, as a general rule of thumb there should be at least three DMUs for each input and output variable used in the model. This allows having sufficient degrees of freedom when implementing the DEA methodology.14 Therefore, and since we have 45 DMUs (or 36, considering only Faculties and Institutes) we could easily have used a total number of say 5 or 6 inputs and outputs. Additionally we need relatively homogeneous DMUs, with the same inputs and outputs in positive amounts. A missing value for either inputs or outputs consequently implies dropping the respective DMU from the set.
Data limitations prevented us from using such performance (output) measures as graduation rate. Additionally, course specifically related data also proved rather difficult to collect. As it stands, we used as a measure of output the number of students enrolled in 2001, taking into account both graduate and postgraduate students. For our inputs we selected, and again due to data constraints, total spending (as reported in the 2001 Annual State General Account) and the total number of teachers, again for 2001. This basically means that we performed our DEA analysis in a two-input one-output framework. Additionally, one may mention that our selected input and output measures are rather similar to the ones used by Coelli (1996) for the Australian Universities case. An immediate caveat relates to the fact that some degree of correlation cannot be avoided among the inputs used.
4.2. DEA results of efficiency analysis
In Table 4 we present the DEA variable-returns-to-scale technical efficiency results using a two-input one-output framework. We use a financial input, total expenditures in 2001, and a quantitatively measured input, the number of teachers in 2001. Additionally, and as a measure of comparison, we also present the constant returns to scale results.
14
Table 4 - DEA results for tertiary education efficiency in Portugal, 2 inputs (total expenditures in 2001, and number of teachers in 2001) and 1 output (enrolment rate, 2001)
Enrolment: graduates Enrolment: graduates and postgraduates * Input oriented Output oriented Input oriented Output oriented University/
Faculty/ Institute
VRS TE Rank VRS TE Rank
CRS TE
VRS TE Rank VRS TE Rank
CRS TE
UA 0.090 31 0.023 45 0.003 0.103 31 0.023 45 0.003 UAL 0.058 37 0.045 44 0.004 0.067 34 0.045 44 0.004 UAV 0.032 44 0.067 43 0.003 0.036 44 0.067 43 0.003 UBI 0.061 35 0.089 42 0.007 0.066 35 0.090 42 0.007 UC-FCT 0.039 41 0.111 41 0.006 0.043 41 0.111 41 0.006 UE 0.037 43 0.133 40 0.006 0.039 42 0.133 40 0.007 UL-FL 0.061 36 0.158 39 0.012 0.061 37 0.158 39 0.012 UL-FD 0.150 28 0.186 38 0.033 0.150 28 0.186 38 0.033 UL-FM 0.237 25 0.212 37 0.067 0.264 22 0.214 37 0.066 UL-FC 0.050 40 0.222 36 0.015 0.054 40 0.222 36 0.015 UL-FF 0.239 24 0.257 35 0.077 0.260 23 0.262 35 0.080 UL-FPCE 0.263 21 0.287 34 0.092 0.260 24 0.290 34 0.087 UL-FMD 0.631 11 0.336 33 0.259 0.757 9 0.337 33 0.273 UL-FBA 0.254 23 0.350 31 0.099 0.254 25 0.350 31 0.099 UM 0.120 30 0.345 32 0.054 0.132 30 0.346 32 0.055 UMI 0.019 45 0.356 30 0.009 0.020 45 0.356 30 0.009 UNL-FCT 0.051 39 0.378 29 0.026 0.057 39 0.378 29 0.027 UNL-FCSH 0.069 34 0.409 28 0.035 0.065 36 0.409 28 0.033 UNL-FD 0.787 8 0.522 25 0.416 0.787 8 0.522 25 0.416 UNL-FE 0.183 27 0.464 27 0.105 0.189 27 0.465 27 0.105 UNL-FCM 0.277 20 0.501 26 0.183 0.332 15 0.507 26 0.193 UNL-ISEGI 1.000 1 1.000 1 0.694 0.890 6 0.598 21 0.544 UP-FL 0.075 33 0.525 24 0.048 0.075 33 0.525 24 0.048 UP-FD 0.746 9 0.658 20 0.497 0.746 10 0.658 19 0.497 UP-FM 0.260 22 0.592 22 0.199 0.269 21 0.595 22 0.187 UP-FC 0.079 32 0.588 23 0.060 0.082 32 0.590 23 0.059 UP-FE 0.055 38 0.601 21 0.044 0.060 38 0.603 20 0.045 UP-FF 0.347 14 0.696 18 0.289 0.381 13 0.704 17 0.296 UP-FEC 0.143 29 0.673 19 0.115 0.143 29 0.673 18 0.115 UP-FPCE 0.281 18 0.726 17 0.246 0.283 20 0.733 16 0.236 UP-FA 0.309 16 0.794 15 0.266 0.309 17 0.794 14 0.266 UP-FCDEF 0.343 15 0.797 14 0.316 0.325 16 0.800 13 0.288 UP-ICBAS 0.279 19 0.781 16 0.263 0.287 19 0.790 15 0.263 UP-FMD 0.889 6 0.917 9 0.854 0.911 5 0.914 8 0.861 UP-FBA 0.350 13 0.903 10 0.343 0.364 14 0.903 10 0.354 UP-FCNA 1.000 1 1.000 1 1.000 1.000 1 1.000 1 1.000 UTL-IST 0.038 42 0.822 13 0.036 0.037 43 0.822 12 0.035 UTL-ISEG 0.193 26 0.868 12 0.108 0.202 26 0.868 11 0.106 UTL-ISA 0.298 17 0.903 11 0.195 0.304 18 0.905 9 0.200 UTL-FMV 1.000 1 1.000 1 0.797 1.000 1 1.000 1 0.841 UTL-ISCSP 0.809 7 0.965 8 0.198 0.809 7 0.965 7 0.198 UTL-FA 0.688 10 0.972 7 0.190 0.720 11 0.974 6 0.200 UTL-FMH 1.000 1 1.000 1 0.286 1.000 1 1.000 1 0.242 UTAD 0.431 12 0.978 6 0.049 0.468 12 0.978 5 0.050 ISCTE 1.000 1 1.000 1 0.072 1.000 1 1.000 1 0.069 Average 0.340 0.560 0.193 0.348 0.552 0.190
Notes: CRS TE – constant returns to scale technical efficiency. VRS TE – variable returns to scale technical efficiency.
Since graduation courses and the related number of students play a different role among the several universities, we also tried to take that information into account in our computations. Therefore, alternative results are also presented in Table 4, where we include both graduate and postgraduate students (only Masters’ courses).
The results show that using graduate students as the quantitative output measure, the efficient frontier is defined by five Institutes/Faculties: UNL-ISEGI, UP-FCNA, UTL-FMV, UTL-FMH, and ISCTE. Considering both graduate and postgraduate students, one of the institutes is dropped from the efficient frontier.
Taking into account only the graduate students, Table 4 also shows that input efficiency scores start at 0.019 (UMI) and output efficiency scores at 0.023 (UA). Overall, average input efficiency is around 0.34 implying that on average the faculties/institutes/universities in our sample might be able to achieve the same level of performance (i.e. have the same number of students) using only 34 per cent of the resources that they were using. In other words, there seems to be a “waste” of input resources of around 66 per cent on average. These values are similar if one considers both graduate and postgraduate students.
The scope for input efficiency improvement is quite large since for some universities the input efficiency score is quite below the average score (for instance, UA, UAV, UC-FCT, UL-FC, UMI, UNL-FCT, UP-FE, and UTL-IST). Nevertheless, one has to be careful when assessing these results since we are only measuring efficiency by using the number of students as the final output. Additional measures of efficiency, besides quantitative output measures, would imply using qualitative variables such as graduation rates and/or average grades per faculty. Unfortunately these data are not available from unified sources or from the universities themselves for that matter.
Table 5 - DEA results for tertiary education efficiency in Portugal, 2 inputs (total expenditures in 2001, and number of teachers in 2001) and 1 output (enrolment rate, 2001),
only Faculties and Institutes
Enrolment: graduates Enrolment: graduates and postgraduates * Input oriented Output oriented Input oriented Output oriented University/
Faculty/ Institute
VRS TE Rank VRS TE Rank
CRS TE
VRS TE Rank VRS TE Rank
CRS TE
UC-FCT 0.039 35 0.028 36 0.001 0.043 35 0.028 36 0.001 UL-FL 0.061 31 0.056 35 0.004 0.061 31 0.056 35 0.004 UL-FD 0.150 26 0.083 34 0.016 0.150 26 0.083 34 0.016 UL-FM 0.237 23 0.113 33 0.037 0.264 20 0.114 33 0.036 UL-FC 0.050 34 0.139 32 0.009 0.054 34 0.139 32 0.009 UL-FF 0.239 22 0.168 31 0.052 0.260 21 0.171 31 0.054 UL-FPCE 0.263 19 0.201 30 0.067 0.260 22 0.203 30 0.063 UL-FMD 0.631 10 0.253 29 0.198 0.757 8 0.253 29 0.209 UL-FBA 0.254 21 0.272 28 0.079 0.254 23 0.272 28 0.079 UNL-FCT 0.051 33 0.278 27 0.019 0.057 33 0.278 27 0.020 UNL-FCSH 0.069 30 0.306 26 0.026 0.065 30 0.306 26 0.025 UNL-FD 0.787 7 0.409 23 0.326 0.787 7 0.409 23 0.326 UNL-FE 0.183 25 0.361 25 0.085 0.189 25 0.361 25 0.085 UNL-FCM 0.277 18 0.401 24 0.152 0.332 13 0.407 24 0.160 UNL-ISEGI 1.000 1 1.000 1 0.588 0.890 5 0.504 21 0.460 UP-FL 0.075 29 0.444 22 0.041 0.075 29 0.444 22 0.041 UP-FD 0.746 8 0.577 18 0.437 0.746 9 0.577 17 0.437 UP-FM 0.260 20 0.510 21 0.178 0.269 19 0.514 20 0.167 UP-FC 0.079 28 0.528 20 0.054 0.082 28 0.528 19 0.054 UP-FE 0.055 32 0.556 19 0.041 0.060 32 0.556 18 0.041 UP-FF 0.347 12 0.632 16 0.269 0.381 11 0.640 15 0.276 UP-FEC 0.143 27 0.611 17 0.109 0.143 27 0.611 16 0.109 UP-FPCE 0.281 16 0.670 15 0.234 0.283 18 0.678 14 0.225 UP-FA 0.309 14 0.748 13 0.255 0.309 15 0.748 12 0.255 UP-FCDEF 0.343 13 0.754 12 0.307 0.325 14 0.757 11 0.280 UP-ICBAS 0.279 17 0.737 14 0.257 0.287 17 0.747 13 0.258 UP-FMD 0.889 5 0.898 7 0.842 0.911 4 0.894 6 0.848 UP-FBA 0.350 11 0.881 9 0.341 0.364 12 0.881 8 0.352 UP-FCNA 1.000 1 1.000 1 1.000 1.000 1 1.000 1 1.000 UTL-IST 0.038 36 0.833 11 0.036 0.037 36 0.833 10 0.036 UTL-ISEG 0.193 24 0.861 10 0.109 0.202 24 0.861 9 0.108 UTL-ISA 0.298 15 0.889 8 0.199 0.304 16 0.889 7 0.204 UTL-FMV 1.000 1 1.000 1 0.816 1.000 1 1.000 1 0.861 UTL-ISCSP 0.809 6 0.958 6 0.204 0.809 6 0.958 5 0.204 UTL-FA 0.688 9 0.972 5 0.197 0.720 10 0.972 4 0.207 UTL-FMH 1.000 1 1.000 1 0.298 1.000 1 1.000 1 0.252 Average 0.374 0.559 0.219 0.381 0.546 0.216
Notes: CRS TE – constant returns to scale technical efficiency. VRS TE – variable returns to scale technical efficiency.
* Postgraduate enrolment only includes Masters’ courses.
excluded 9 DMUs from our data sample, the ones were only aggregated data is available, leaving us now with 36 units. We report the results for this smaller and more homogeneous data set in Table 5 taking into account only the graduate students and both the graduate and postgraduate students (again, only Masters courses).
With this smaller sample the efficient frontier is now defined by four Institutes/Faculties when only graduate students are used: UNL-ISEGI, UP-FCNA, UTL-FMV, and UTL-FMH, with ISCTE being absent from the sample altogether. When both graduate and postgraduate students are taken into account, three Institutes/Faculties only define the efficient frontier: UP-FCNA, UTL-FMV, and UTL-FMH. Now input efficiency scores start at 0.038 (UTL-IST) and output efficiency scores at 0.028 (UC-FCT). This picture does not change when postgraduate students are taken into account.
The ranking of the Faculties/Institutes also remains rather stable either using only graduate or both graduate and postgraduate students. Nevertheless, perhaps one could mention that UNL-FCM increases its input efficiency ranking by five places and that UNL-ISEGI also drops five places in terms of the input efficiency ranking (the decline is much higher in the output efficiency ranking).
The overage input and output efficiency scores are now a little higher than when the aggregated universities data were used. Still, average input efficiency is around 0.374 implying that on average the faculties/institutes in the sample might be able to achieve a similar level of performance using only 37.4 per cent of the resources that they were using. Again, there seems to be a significant amount of “wasted” input resources of around 62.6 per cent on average.
4.3. Further sub-group analysis
numbers. Therefore, we excluded those faculties where this ratio was at least 50 per cent higher than the average value. This procedure led us to identify, and detach from the sample, seven faculties where the teachers per 100 students ratio ranged from 14.5 (UP-FMD) to 33.2 (UNL-FCM). In other words, those seven faculties had a students-to-teachers ratio between 3 (UNL-FCM) and 7 (UP-FMD) while the average in the entire sample was around 11 students per teacher.
The analysis of the smaller group of seven faculties, excluded from the main sample, it is possible to see that it is composed of the entire sub-sample of medical faculties (UL-FM, UL-FMD, UNL-FCM, UP-FM, UP-ICBAS, UP-FMD, UTL-FMD). In addition, this exclusion seems reasonable. First, those faculties do have rather more demanding courses both in terms of teachers per student ratios and regarding financial requirements. Even if there must be some positive correlation between the number of teachers and total spending, one has to notice that in 2001 the spending ratio of those faculties ranged from 8921 euros per student (UL-FM) to 18847 euros per student (UTL-FMD), when the average for the entire sample was 5698 euros. Secondly, this allows us to assess separately the performance of a more similar a smaller sub-group of faculties: medical faculties.
Table 6 - DEA results for tertiary education efficiency in Portugal, 2 inputs (total expenditures in 2001, and number of teachers in 2001) and 1 output (enrolment rate, 2001),
only Faculties and Institutes, medical Faculties not included
Enrolment: graduates and postgraduates * Input oriented Output oriented University/
Faculty/ Institute
VRS TE Rank VRS TE Rank
CRS TE
UC-FCT 0.043 29 0.028 29 0.001 UL-FL 0.061 24 0.056 28 0.004 UL-FD 0.150 19 0.083 27 0.016 UL-FC 0.054 27 0.139 26 0.009 UL-FF 0.260 14 0.176 25 0.054 UL-FPCE 0.260 15 0.205 24 0.063 UL-FBA 0.254 16 0.272 23 0.079 UNL-FCT 0.057 26 0.278 22 0.020 UNL-FCSH 0.065 23 0.306 21 0.025 UNL-FD 0.787 5 0.409 19 0.326 UNL-FE 0.189 18 0.361 20 0.085 UNL-ISEGI 0.890 3 0.513 17 0.460 UP-FL 0.075 22 0.444 18 0.041 UP-FD 0.746 7 0.577 14 0.437 UP-FC 0.082 21 0.528 16 0.054 UP-FE 0.060 25 0.556 15 0.041 UP-FF 0.381 9 0.658 12 0.276 UP-FEC 0.143 20 0.611 13 0.109 UP-FPCE 0.283 13 0.686 11 0.225 UP-FA 0.309 12 0.748 10 0.255 UP-FCDEF 0.325 11 0.764 9 0.280 UP-FBA 0.364 10 0.881 6 0.352 UP-FCNA 1.000 1 1.000 1 1.000 UTL-IST 0.054 28 0.833 8 0.036 UTL-ISEG 0.214 17 0.861 7 0.108 UTL-ISA 0.496 8 0.889 5 0.204 UTL-ISCSP 0.809 4 0.958 4 0.204 UTL-FA 0.750 6 0.972 3 0.207 UTL-FMH 1.000 1 1.000 1 0.252
Average 0.350 0.545 0.219
Notes: CRS TE – constant returns to scale technical efficiency. VRS TE – variable returns to scale technical efficiency. * Postgraduate enrolment only includes Masters’ courses.
Taking advantage of the smaller sub-sample of seven medical faculties/institutes, we performed a similar DEA analysis for those DMUs, and the results are presented in Table 7.
Table 7 - DEA results for tertiary education efficiency in Portugal, 2 inputs (total expenditures in 2001, and number of teachers in 2001) and 1 output (enrolment rate, 2001),
only medical Faculties
Enrolment: graduates and postgraduates * Input oriented Output oriented University/
Faculty/ Institute
VRS TE Rank VRS TE Rank
CRS TE
UL-FM 0.304 6 0.143 7 0.051 UL-FMD 0.830 3 0.310 6 0.277 UNL-FCM 0.364 4 0.429 5 0.182 UP-FM 0.295 7 0.571 4 0.197 UP-ICBAS 0.315 5 0.714 3 0.263 UP-FMD 1.000 1 1.000 1 1.000 UTL-FMD 1.000 1 1.000 1 0.969
Average 0.587 0.595 0.420
Notes: CRS TE – constant returns to scale technical efficiency. VRS TE – variable returns to scale technical efficiency. * Postgraduate enrolment only includes Masters’ courses.
From Table 7 it is possible to conclude that the efficient medical DMUs are UP-FMD and UTL-FMD. Those two DMUs had in 2001 the two lowest teachers per 100 students ratios (conversely the two highest students-to-teachers ratios). Moreover, while UP-FMD is the peer for all the other five faculties outside the production possibility frontier. Interestingly, one may also notice that now input efficiency is higher, and around 58.7 per cent, for this sub-sample of faculties/institutes, giving a measure of a smaller degree of overall “wasted” inputs than before. This implies that, as mentioned previously, more detailed data would be welcomed in order to better characterise the distinctiveness of each faculty due to the fact that their courses might be quite diverse.
Finally, we summarise in Table 8 the main findings of our non-parametric analysis, performed for the various sub-samples of Universities/Faculties/ Institutes.
Table 8 - Efficient public Universities/Faculties/Institutes: summary of DEA results
Sample includes Inputs, Outputs Students enrolment covers: Universities/ Faculties/Institutes Undergraduate UNL-ISEGI, UP-FCNA, UTL-FMV, UTL-FMH, ISCTE Universities, Faculties, and Institutes (45 DMUs)
- Annual spending (in) - Teachers (in)
- Students (out) Undergraduate and Postgraduate UP-FCNA, UTL-FMV, UTL-FMH, ISCTE Undergraduate UNL-ISEGI, UP-FCNA, UTL-FMV, UTL-FMH Only Faculties, and Institutes (36 DMUs)
- Annual spending (in) - Teachers (in)
- Students (out) Undergraduate and Postgraduate UP-FCNA, UTL-FMV, UTL-FMH Faculties, and Institutes, no medical Faculties (29 DMUs)
- Annual spending (in) - Teachers (in)
- Students (out)
Undergraduate and Postgraduate UP-FCNA, UTL-FMH Faculties, and Institutes, only medical Faculties (7 DMUs)
- Annual spending (in) - Teachers (in)
- Students (out)
Undergraduate and Postgraduate
UP-FMD, UTL-FMD
5. Conclusion
The results from our empirical work in evaluating efficiency in Portuguese public universities allowed us to compute efficiency scores for each Faculty/Institute in producing tertiary education, including estimates of efficiency losses, and to construct rankings of the Faculties/Institutes, including therefore the identification of the most efficient cases.
that they were using. In other words, there seems to be a “waste” of input resources of around 66 per cent on average. Efficiency scores increase (input efficiency is around 37.4 per cent) when both graduate and postgraduate students are used as the output measure. Similarly, dropping from our sample the Universities were we only have aggregate data (and no information by Faculty/Institute) also increases the efficiency scores.
The results with a more homogeneous sub-group of faculties, excluding DMUs with spending and/or teachers’ ratios very different from the average (i. e. medical faculties), produced similar results, even if some changes occurred in the ordering. Additionally, results were also reported for the seven medical faculties sub-sample, with UP-FMD, UTL-FMD coming out as the efficient DMUs, and with an overall input efficiency of 58.7 per cent.
Annex – Data and sources
Table 1 - List of Universities, Faculties and Institutes
CODE FACULTY / INSTITUTE /UNIVERSITY No
UA UNIVERSIDADE DOS AÇORES 1
UAL UNIVERSIDADE DO ALGARVE 2
UAV UNIVERSIDADE DE AVEIRO 3
UBI UNIVERSIDADE DA BEIRA INTERIOR 4
UC-FCT UNIVERSIDADE DE COIMBRA - FACULDADE DE CIÊNCIAS E TECNOLOGIA 5
EU UNIVERSIDADE DE ÉVORA 6
UL-FL UNIVERSIDADE DE LISBOA - FACULDADE DE LETRAS 7
UL-FD UNIVERSIDADE DE LISBOA - FACULDADE DE DIREITO 8
UL-FM UNIVERSIDADE DE LISBOA - FACULDADE DE MEDICINA 9
UL-FC UNIVERSIDADE DE LISBOA - FACULDADE DE CIÊNCIAS 10
UL-FF UNIVERSIDADE DE LISBOA - FACULDADE DE FARMÁCIA 11
UL-FPCE UNIV. DE LISBOA - FACULDADE DE PSICOLOGIA E CIÊNCIAS DA EDUCAÇÃO 12
UL-FMD UNIVERSIDADE DE LISBOA - FACULDADE DE MEDICINA DENTÁRIA 13
UL-FBA UNIVERSIDADE DE LISBOA - FACULDADE DE BELAS ARTES 14
UM UNIVERSIDADE DA MADEIRA 15
UMI UNIVERSIDADE DO MINHO 16
UNL-FCT UNIVERSIDADE NOVA DE LISBOA - FACULDADE DE CIÊNCIAS E TECNOLOGIA 17 UNL-FCSH UNIV. NOVA DE LISBOA - FACULDADE DE CIÊNCIAS SOCIAIS E HUMANAS 18
UNL-FD UNIVERSIDADE NOVA DE LISBOA - FACULDADE DE DIREITO 19
UNL-FE UNIVERSIDADE NOVA DE LISBOA - FACULDADE DE ECONOMIA 20
UNL-FCM UNIVERSIDADE NOVA DE LISBOA - FACULDADE DE CIENCIAS MÉDICAS 21 UNL-ISEGI UNIV. NOVA LISBOA - INST. SUPERIOR ESTATÍSTICA E GESTÃO DA INFORMAÇÃO 22
UP-FL UNIVERSIDADE DO PORTO - FACULDADE DE LETRAS 23
UP-FD UNIVERSIDADE DO PORTO - FACULDADE DE DIREITO 24
UP-FM UNIVERSIDADE DO PORTO - FACULDADE DE MEDICINA 25
UP-FC UNIVERSIDADE DO PORTO - FACULDADE DE CIÊNCIAS 26
UP-FE UNIVERSIDADE DO PORTO - FACULDADE DE ENGENHARIA 27
UP-FF UNIVERSIDADE DO PORTO - FACULDADE DE FARMÁCIA 28
UP-FEC UNIVERSIDADE DO PORTO - FACULDADE DE ECONOMIA 29
UP-FPCE UNIV. DO PORTO - FACULDADE DE PSICOLOGIA E CIÊNCIAS DA EDUCAÇÃO 30
UP-FA UNIVERSIDADE DO PORTO - FACULDADE DE ARQUITECTURA 31
UP-FCDEF UNIV. DO PORTO - FACULDADE CIÊNCIAS DO DESPORTO E EDUCAÇÃO FÍSICA 32 UP-ICBAS UNIV. DO PORTO - INSTITUTO DE CIÊNCIAS BIOMÉDICAS DE ABEL SALAZAR 33
UP-FMD UNIVERSIDADE DO PORTO - FACULDADE DE MEDICINA DENTÁRIA 34
UP-FBA UNIVERSIDADE DO PORTO - FACULDADE DE BELAS ARTES 35
UP-FCNA UNIV. DO PORTO - FACULDADE DE CIÊNCIAS DA NUTRIÇÃO E ALIMENTAÇÃO 36
UTL-IST UNIV. TÉCNICA DE LISBOA - INSTITUTO SUPERIOR TÉCNICO 37
UTL-ISEG UNIV. TÉCNICA DE LISBOA - INSTITUTO SUPERIOR DE ECONOMIA E GESTÃO 38 UTL-ISA UNIV. TÉCNICA DE LISBOA - INSTITUTO SUPERIOR DE AGRONOMIA 39 UTL-FMV UNIV. TÉCNICA DE LISBOA - FACULDADE DE MEDICINA VETERINÁRIA 40 UTL-ISCSP UNIV. TÉCNICA LISBOA - INST.SUPERIOR CIÊNCIAS SOCIAIS POLÍTICA 41
UTL-FA UNIV. TÉCNICA DE LISBOA - FACULDADE DE ARQUITECTURA 42
UTL-FMH UNIV. TÉCNICA DE LISBOA - FACULDADE DE MOTRICIDADE HUMANA 43
UTAD UNIVERSIDADE DE TRÁS-OS-MONTES E ALTO DOURO 44
ISCTE INSTITUTO SUPERIOR DE CIÊNCIAS DO TRABALHO E DA EMPRESA 45
Table 2 - Original data set
Students enrolment (2001) 1/ Univ./ Fac./Inst.
Code Graduates Graduates and postgraduates
Total expenditures 2001 (euro) 2/
Teachers, 2001 *
3/
UA 2928 3001 23037550 269
UAL 4404 4563 48468391 383
UAV 8307 8534 60892803 703
UBI 4521 4687 27418237 389
UC-FCT 7022 7237 41931630 656
UE 7606 7856 41971908 621
UL-FL 5013 5392 19035355 367
UL-FD 3523 3620 7729307 231
UL-FM 1086 1166 10401847 325
UL-FC 5359 5670 37970711 509
UL-FF 1153 1183 7175048 126
UL-FPCE 1059 1186 6032432 117
UL-FMD 407 407 5164668 107
UL-FBA 1179 1226 4568066 91
UM 2261 2329 14955308 191
UMI 15236 15580 76336534 1207
UNL-FCT 5312 5440 36447068 501
UNL-FCSH 4182 4703 17701120 349
UNL-FD 528 528 1470755 17
UNL-FE 1547 1628 7818103 107
UNL-FCM 929 929 8791707 308
UNL-ISEGI 257 346 2301149 25
UP-FL 4313 4471 15464251 290
UP-FD 553 553 1552314 29
UP-FM 1019 1145 13132276 247
UP-FC 3516 3739 20758687 311
UP-FE 4966 5176 33649864 445
UP-FF 786 809 5188730 66
UP-FEC 2599 2754 8097400 164
UP-FPCE 989 1087 5717266 91
UP-FA 1032 1032 3753933 69
UP-FCDEF 821 949 4845921 79
UP-ICBAS 1019 1072 10294221 275
UP-FMD 323 338 3159336 49
UP-FBA 827 846 3503826 71
UP-FCNA 292 308 1158139 30
UTL-IST 8336 8954 78561776 945
UTL-ISEG 2858 3056 15016969 256
UTL-ISA 1619 1668 17667591 171
UTL-FMV 407 407 7670783 75
UTL-ISCSP 2870 3046 6664065 182
UTL-FA 1793 1793 9059836 193
UTL-FMH 1218 1518 7083544 122
UTAD 7310 7567 39847627 599
ISCTE 5085 5561 27149136 436
Average 3039 3186 18813715 284
1/ Direcção-Geral do Ensino Superior.
2/ Conta Geral do Estado - 2001. Direcção-Geral do Orçamento. [http://www.dgo.pt/cge/cge2001/index.htm] 3/ Direcção-Geral do Ensino Superior.
References
Blanchard, O. (2004). “The Economic Future of Europe.” NBER Working Paper 10310, February.
Afonso, A.; Schuknecht, L. and Tanzi, V. (2003). “Public Sector Efficiency: An International Comparison,” ECB Working Paper 242, July (Public Choice, forthcoming).
Afonso, A. and St. Aubyn, M. (2004). “Non-parametric Approaches to Public Education and Health Expenditure Efficiency in OECD countries.” ISEG/UTL-Technical University of Lisbon, Economics Department, Working Paper 1/2004/DE/CISEP/UECE.
Athans, M. (2002). “Portuguese Research Universities: why not the Best?” Economia Global e Gestão, 7 (1), 121-139.
Bowlin, W. (1998). “Measuring Performance: An Introduction to Data Envelopment analysis (DEA).” Journal of Cost Analysis, Fall, 3-27.
Charnes, A.; Cooper, W. and Rhodes, E. (1978). “Measuring the efficiency of decision making units,” European Journal of Operational Research, 2 (6), 429–444. Clements, B. (2002). “How Efficient is Education Spending in Europe?” European Review of Economics and Finance, 1 (1), 3-26.
Coelli, T. (1996). “Assessing the Performance of Australian Universities using Data Envelopment Analysis,” mimeo, University of New England.
Coelli, T.; Rao, P. and Battese, G. (1998). An Introduction to Efficiency and Productivity Analysis, Kluwer, Boston.
De Borger, B. and Kerstens, K. (1996). “Cost Efficiency of Belgian Local Governments: A Comparative Analysis of FDH, DEA, and Econometric Approaches,” Regional Science and Urban Economics, 26 (2), 145-170.
Deprins, D.; Simar, L., and Tulkens, H. (1984). “Measuring labor-efficiency in post offices,” in: Marchand, M.; Pestieau, P. and Tulkens, H. (Eds.), The performance of public enterprises: concepts and measurement. Amsterdam: North-Holland.
Førsund, F. and Kalhagen, K. (1999). “Efficiency and roductivity of Norwegian Colleges,” University of Oslo, Department of Economics WP 11/99.
Gupta, S. and Verhoeven, M. (2001). “The Efficiency of Government Expenditure – Experiences from Africa,” Journal of Policy Modeling, 23, 433-467.
Murillo-Zamorano, L. (2004). “Economic Efficiency and Frontier Techniques,”
Journal of Economic Surveys, 18 (1), 33-77.
Simar, L. and Wilson, P. (2003). Efficiency analysis: the statistical approach, lecture notes, July.
St. Aubyn, M. (2002). “Evaluating Efficiency in the Portuguese Health and Education Sectors,” paper presented to the conference "Desenvolvimento Económico Português no Espaço Europeu: Determinantes e Políticas", Banco de Portugal, May, Fundação Calouste Gulbenkian, Lisbon.
Thanassoulis, E. (2001). Introduction to the Theory and Application of Data Envelopment Analysis, Kluwer Academic Publishers.
Tulkens, H. (1993). “On FDH analysis: some methodological issues and applications to retail banking, courts and urban transit,” Journal of Productivity Analysis 4, 183– 210.