Recebido para publicação: Junho de 2010 • Aceite para publicação: Setembro de 2010 Received for publication: June 2010 • Accepted for publication: September 2010
25
Analysis of variability and reproducibility
of echocardiography measurements in
valvular aortic valve stenosis
[3]
LUÍSM. MOURA, SANDRAF. RAMOS, FAUSTOJ. PINTO, ISABELM. BARROS, F. ROCHA-GONÇALVES
1Oporto University School of Medicine, Oporto, Portugal, 2Pedro Hispano Hospital, Matosinhos, Portugal, 3Lisbon University School of Medicine, Lisbon, Portugal
Rev Port Cardiol 2011; 30 (01): 25-33
ABSTRACT
Background: Doppler echocardiography is
the most frequent method for detecting and evaluating the severity of valvular aortic stenosis. The aim of this study was to assess the variability and reproducibility of echocardiographic parameters including aortic valve area (AVA), peak aortic jet velocity (Vmax), velocity ratio (VLVOT/Vmax),
peak gradient (Gmax)
and mean gradient (Gmean) in aortic
stenosis (AS) patients.
Methods: Doppler echocardiograms were
obtained from 150 randomly selected patients (56.7% male; mean age 73±9 years) with asymptomatic moderate aortic valve stenosis. The echocardiographic measurements were performed by two inde-pendent level III (expert) blinded observers. To assess intra-observer variability, we eval-uated parameters of AS progression at two different times (mean of two weeks after the first examination).
Results: For intra-observer variability
(observer 1), the variation and reproducibili-ty coefficients were, respectively, 1.88% and 0.16 m/s for Vmax, 2.08% and 0.14 for
VLVOT/Vmax, 2.05% and 0.18 cm2for AVA,
Variabilidade e reprodutibilidade da análise das medições ecocardiográficas na estenose valvular aórtica
RESUMO
Introdução: A ecocardiografia Doppler é o
método mais frequente de detecção e avaliação da gravidade da estenose valvular aórtica. O objectivo deste estudo foi avaliar a variabilidade e reprodutibilidade dos parâmetros ecocardiográficos como a área valvular aórtica (AVA), velocidade pico (Vmax), relação de velovidades (VLVOT/Vmax),
gradiente pico (Gmax) e gradiente médio
(Gmédio) nos doentes com estenose aórtica.
Métodos: Um ecocardiograma Doppler foi
realizado em 60 doentes consecutivos seleccionados aleatoriamente (da população do estudo RAAVE) com estenose aórtica moderada a grave assintomática (56.7% sexo masculino; idade média 73 ± 9 anos). As medidas ecocardiográficas foram efectuadas por dois ecocardiografistas de nível III numa estratégia de dupla ocultação. Para o estudo da variabilidade intra-observador, avaliamos os prâmetros de progressão da estenose aórtica em dois
26
3.89% and 5.18 mmHg for Gmaxand 7.87%
and 6.30 mmHg for Gmean. For inter-observer
variability, the variation and reproducibility coefficients were, respectively, 2.00% and 0.14 m/s for Vmax, 2.91% and 0.14 for
VLVOT/Vmax, 7.67% and 0.16 cm2for AVA,
8.53% and 7.06 mmHg for Gmeanand 3.90%
and 5.58 mmHg for Gmax. Both intra- and
inter-observer studies showed excellent intr-aclass correlation coefficients (ICC) for all echocardiographic parameters (ICC ranged from 0.943 to 0.990 for intra-observer vari-ability and from 0.955 to 0.992 for inter-observer variability).
Conclusion: Doppler echocardiographic
measurements of AVA, Vmax, Gmaxand Gmean
are highly reproducible when performed by expert observers. Of all echocardiographic parameters, Vmaxand VLVOT/Vmaxshowed the
best variability and reproducibility, and thus constitute reliable tools for clinical and research purposes in aortic stenosis
diagnosis and follow-up.
Key words
Aortic stenosis; Echocardiography; Variability and reproducibility; Bland-Altman; RAAVE; Follow-up
momentos diferentes (média de duas semanas após o 1.º exame).
Resultados: No que respeita à variabilidade
intra-observador (observador 1), os
coeficientes de variação e reprodutibilidade foram, respectivamente, 1.88% e 0.16 m.s-1 para a Vmax, 2.08% e 0.14 cm2para a
VLVOT/Vmax, 2.05% e 0.18 ms-1 para a AVA, 3.89% e 5.18 mmHg para Gmax and 7.87% e 6.30 mmHg para o Gmédio. No que respeita à variabilidade inter--observador, os coeficientes de variação e reprodutibilidade foram, respectivamente, 2.00% e 0.14 m.s-1 para a Vmax, 2.91% e 0.14 m.s-1 para a relação VLVOT/Vmax, 7.67% e 0.16 cm2para a AVA, 8.53% e
7.06 mmHg para o Gmédio e 3.90% e 5.58 mmHg para o Gmax. Os estudos intra-observador e inter-observador mostraram ter excelentes coeficientes de correlação intra-classe (CCI), para todos os parâmetros ecocardiográficos (CCI varia de 0.943 até 0.990 para a variabilidade intra--observador e de 0.955 até 0.992 para a variabilidade inter-observador).
Conclusões: As medições ecocardiográficas
da AVA, Vmax, Gmax and Gmédio são altamente reprodutíveis quando realizadas por ecocardiografistas experientes. De todos os parâmetros ecocardiográficos a Vmaxe a relação VLVOT/Vmaxapresentam os
melhores valores de variabilidade e reprodutibilidade e assim constituem provavelmente a melhor ferramenta no diagnóstico e seguimento criterioso dos doentes com estenose valvular aórtica.
Palavras Chave:
Estenose aórtica; Ecocardiografia; Variabilidade e reproducibilidade; Bland-Altman; Estudo RAAVE; Seguimento e prognóstico
INTRODUCTION
C
alcific aortic stenosis (AS) is common and hemodynamically significant valvular stenosis affects approximately 5% of people aged 75 to 86 years(1). Severe symptomatic aortic stenosis has a poor prognosis and the only definitive treatment is aortic valve replacement(2). The rate of disease progression is not well known and patients with mild to moderate aortic stenosis require regular clini-cal and echocardiographic surveillance(3, 4).Doppler echocardiography has become the accepted mode of surveillance for patients with aortic stenosis, avoiding the need for repeated cardiac catheterization. Results have been shown to correlate well with inva-sive hemodynamic data(5-7).
Calculation of aortic valve area (AVA) by the continuity equation requires precise measurements of the left ventricular (LV) out-flow tract (LVOT) diameter, and peak veloci-ties of blood flow in the LVOT and across the aortic valve(8, 9).
Failure to acquire satisfactory images of the LVOT can be a major limitation in a sig-nificant proportion of patients because of body habitus, sigmoid interventricular septum, or aortic valve calcification(10, 11).
The continuity equation further amplifies error by using the square of the LVOT diame-ter to calculate cross-sectional area, con-tributing to significant intra- and inter-observ-er variability.
Reproducibility studies are designed to measure the level of concordance between observations made under the same circum-stances by the same observer (intra-observer concordance) or by different observers (inter-observer concordance). Intra-(inter-observer vari-ability is predominantly random, while inter-observer variability can be random or system-atic.
A measurement is said to be reproducible if it comes from a reproducible procedure, that is, the same measurements will be obtained if it is repeated under the same conditions. Lack of reproducibility in measurements can lead to major scientific, clinical and medical-legal
consequences. Sometimes, the lack of repro-ducibility obtained from several measure-ments can only be improved by basing deci-sions on multiple, independent, arbitrated or consensual opinions.
In a biomedical study the only source of variability in parameters should be the intrin-sic biological variability of the subjects under study. However, there is also very often vari-ability which depends on measurements made by the observer or by the tool used for the measurements.
Accurate measurements are sometimes needed in situations in which they are difficult to obtain in clinical practice, with wide vari-ability in observations that can limit their validity.
Previous studies on reproducibility analyz-ing this problem have mainly evaluated the correlation more than the concordance of measurements, which is the main reason we have used Bland-Altman analysis.
The aim of this study was to assess the parameters of reproducibility of echocardio-graphic measurements in aortic stenosis patients.
METHODS
Patients and echocardiographic meas-urements
One hundred and fifty patients with asymptomatic moderate calcific aortic steno-sis and AVA ≥1.0 cm2(56.7% male; mean age 73±9 years) were included in this Rosuvas-tatin Affecting Aortic Valve Endothelium to Slow the Progression of Aortic Stenosis (RAAVE) sub-study. We decided to include moderate AS because within this level of severity there is a wide range of variability. The local research ethics committee approved the study and written informed consent was obtained from all participants. The patients were randomly selected from the total study population of the RAAVE study.
Comprehensive transthoracic echocardio-grams were performed in a single echocar-diographic laboratory. Immediate physician 27
review (level III) enabled re-imaging for qual-ity control. Standard Doppler measurements of the LVOT and aortic valve were recorded from multiple windows to obtain the maximum velocity, and the mean gradient, peak velocity, and aortic valve area were measured and cal-culated as defined by the American Heart Association/American College of Cardiology guidelines for the clinical application of echocardiography(12, 13).
To assess intra-observer variability, we evaluated parameters of aortic stenosis pro-gression (peak velocity, aortic valve area, peak gradient, mean gradient and VLVOT/Vmax ratio) at two different times (two weeks after the first examination).
For inter-observer variability, off-line mea-surements were made from the records by a second observer who was unaware of the results of the first studies.
The echocardiograms were performed by two echocardiographers with over five years of experience (IB and LM).
The images were recorded digitally and analyzed off-line. A total of five measurements of each parameter were made for patients in sinus rhythm and seven for patients with atri-al fibrillation, and the mean of these measure-ments was used.
Statistical analysis
Data are presented as mean ± standard deviation. The variability of the measurements was evaluated based on the variability coeffi-cient. Reproducibility was assessed by the interclass correlation coefficient (ICC).
In addition, the Bland-Altman method(14) (the mean of the differences ± twice the standard deviation of the differences) was used to calcu-late the reproducibility coefficient. This method is an excellent tool for examination of models
with discordance between measurements, as its graphical nature makes it easier to interpret.
The Student’s t test for paired samples was used to verify whether the mean of the differ-ences between the measurements (different observers or different times) was statistically equal to zero. Analyses were performed using SPSS software, version 14.0 (SPSS Inc., Chicago, Illinois). A two-tailed p value less than 0.05 was considered to indicate statisti-cal significance.
RESULTS
Intra-observer variability and repro-ducibility
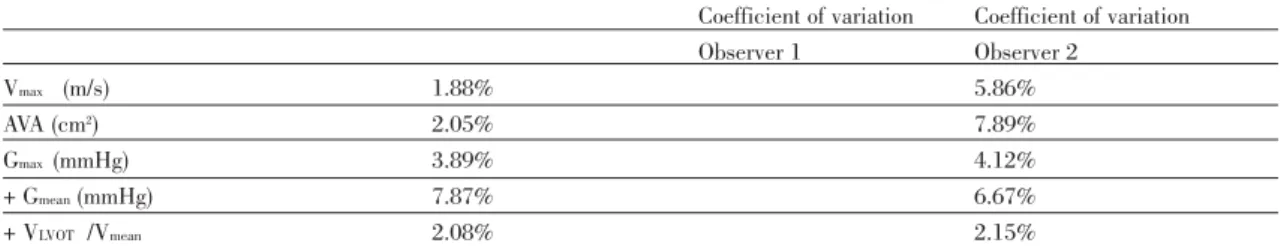
Comparisons of variables for both observer 1 and observer 2 are shown as coefficients of variation (Table I), as reproducibility coeffi-cients and as ICCs (Table II), and as a Bland-Altman plot in Figure 1.
The variation coefficients (Table I) were proportionately better, corresponding to a small variation, for Vmax (observer 1 = 1.88%; observer 2 = 5.86%), VLVOT/Vmax (observer 1 = 2.08%; observer 2 = 2.15%) and for Gmax (observer 1 = 3.89%; observer 2 = 4.12%) than for AVA (observer 1 = 2.05%; observer 2 = 7.89%) and Gmean (observer 1 = 7.87%; observer 2 = 6.67%).
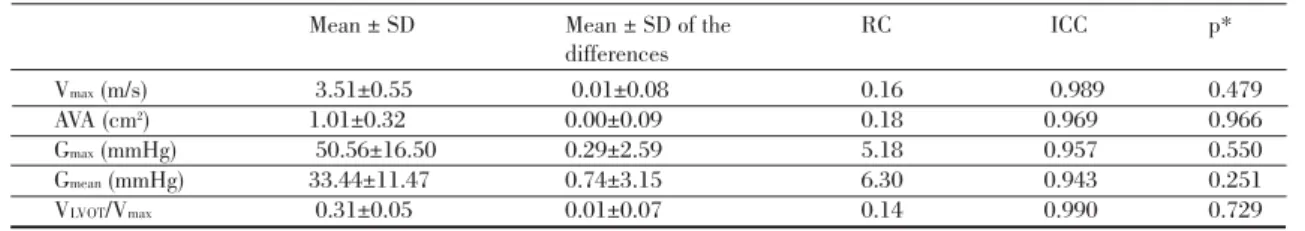
The intra-observer reproducibility coeffi-cients (Table II) were 0.16 m/s for Vmax, 0.14 for VLVOT/Vmaxand 0.18 cm2for AVA. For Gmax and Gmean, reproducibility coefficients were 5.18 mmHg and 6.30 mmHg, respectively. When the null hypothesis was verified the mean difference of measurements (obtained at two different times) was equal to zero, and this cannot be rejected for the variables analyzed (p≥0.251).
28
Coefficient of variation Coefficient of variation Observer 1 Observer 2 Vmax (m/s) 1.88% 5.86% AVA (cm2) 2.05% 7.89% Gmax(mmHg) 3.89% 4.12% + Gmean(mmHg) 7.87% 6.67% + VLVOT /Vmean 2.08% 2.15%
29
Rev Port Cardiol 2011; 01: 25-33
Mean ± SD Mean ± SD of the RC ICC p*
differences Vmax(m/s) 3.51±0.55 0.01±0.08 0.16 0.989 0.479 AVA (cm2) 1.01±0.32 0.00±0.09 0.18 0.969 0.966 Gmax(mmHg) 50.56±16.50 0.29±2.59 5.18 0.957 0.550 Gmean(mmHg) 33.44±11.47 0.74±3.15 6.30 0.943 0.251 VLVOT/Vmax 0.31±0.05 0.01±0.07 0.14 0.990 0.729
Table II. Intra-observer reproducibility of echocardiographic measurements of AS
* The hypotheses of the test are H0: dmean(mean difference) = 0 vs. H1: dmean≠ 0. RC: reproducibility coefficient: twice the standard
deviation of the differences, ICC: intraclass correlation coefficient.
Figure 1. Intra-observer reproducibility (A-E) of echocardiographic measurements of aortic valve stenosis. The central horizontal line corresponds to the mean of the differences of the two measurements and the two exterior lines correspond to 2 x SD of the differences.
Coefficient of variation Vmean(m/s) 2.00% AVA (cm2) 7.67% Gmax(mmHg) 3.90% Gmean(mmHg) 8.53% VLVOT/Vmax 2.91%
Table III. Inter-observer variability of echocardiographic measurements of AS
* The hypotheses of the test are H0: dmean(mean difference) = 0 vs. H1: dmean≠ 0. RC: reproducibility coefficient: twice the standard
Whichever variables were analyzed, excel-lent intraclass correlation coefficients were obtained (Table II), reflecting excellent accu-racy in measurements of all echocardiograph-ic variables.
The distribution of the points in Figure 1 (A-E) shows that there were no systematic errors in the readings made by the observer.
Among the echocardiographic variables studied, Vmaxand VLVOT/Vmaxprovide better per-formance for the evaluation of aortic stenosis (lower variation coefficient and higher ICC).
Inter-observer variability and reproducibility
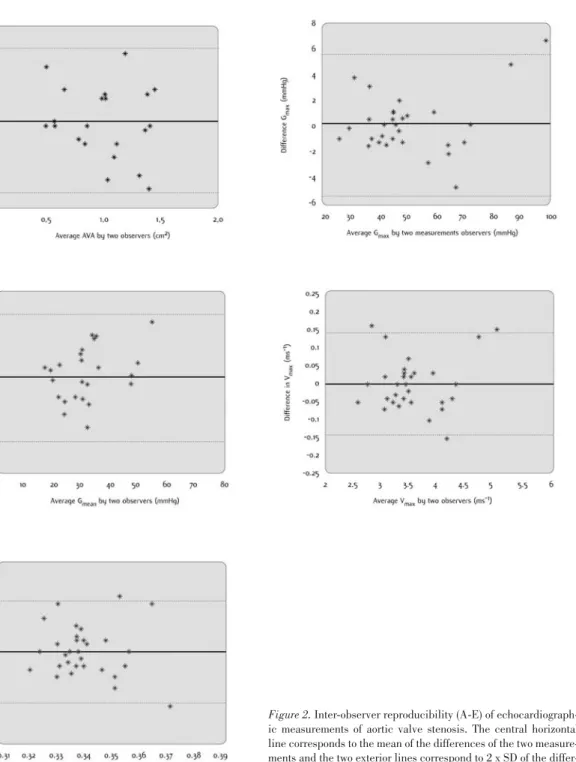
Comparisons between observers 1 and 2 are presented as coefficients of variation (Table III), as reproducibility coefficients and as ICCs (Table IV), and as a Bland-Altman plot in Figure 2 (A-E).
In analysis of inter-observer variability, Table III shows that coefficients of variation were better for Vmax (2.00%) and VLVOT/Vmax (2.91%) than for Gmax (3.90%), AVA (7.67%) and Gmean(8.53%).
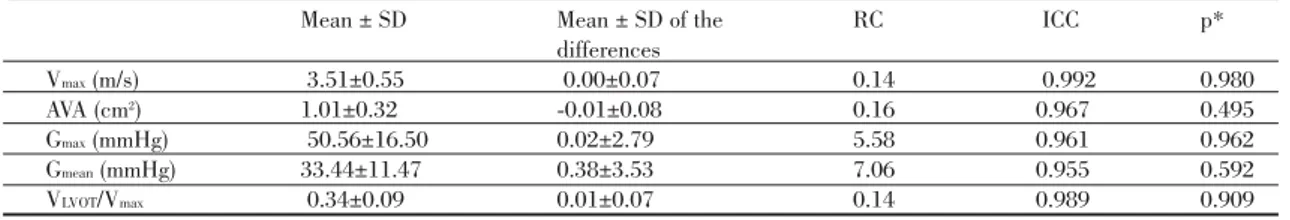
As can be seen in Table IV, the coefficients of inter-observer reproducibility were 0.14 m/s for Vmax, 0.14 for VLOVT/Vmaxand 0.16 cm2 for AVA. For Gmaxand Gmean, the reproducibility coefficients were 5.58 mmHg and 7.06 mmHg, respectively. When the hypothesis was proven, the mean differences in the measure-ments between the two observers were equal to zero, so this hypothesis cannot be rejected for the variables analyzed (p≥0.495).
The distribution of the points in Figure 2 (A-E) suggests that there is no divergence in the observations produced by the two
observers. In addition, excellent intraclass correlation coefficients were recorded (Table
IV) (r=0.992 for Vmax, r=0.989 for VLVOT/Vmax, r=0.967 for AVA, r=0.961 for Gmaxand r=0.995 for Gmean).
We obtained a correlation coefficient (r) for AVA for 2D echocardiography vs. catheteriza-tion of 0.71 in 12 patients who were referred for aortic valve replacement surgery.
DISCUSSION
What is in fact the clinical utility of these data in an era when multimodality imaging is becoming more and more relevant and echo has been shown to be a reproducible imaging technique? What does it add to the body of current knowledge that will make clinicians rely even further on it? Will these results in any way alter clinical practice?
Additionally, we believe there is some con-fusion among scientists and statisticians about the right test to assess inter- and intra-observ-er variability. What does this really add ovintra-observ-er and above analysis of variance, standard devi-ation and simple averages?
To start to answer to these questions we already know that assessment of aortic stenosis requires evaluation of patient symptoms and quantification of the severity of valve obstruc-tion. Methods to assess severity include cardiac catheterization, echocardiography, intravascu-lar ultrasound, computed tomography, and magnetic resonance imaging. The ideal method should be simple, noninvasive, and widely available while remaining both accurate and reproducible; echocardiography would seem to best fulfill these requirements.
30
Mean ± SD Mean ± SD of the RC ICC p*
differences Vmax(m/s) 3.51±0.55 0.00±0.07 0.14 0.992 0.980 AVA (cm2) 1.01±0.32 -0.01±0.08 0.16 0.967 0.495 Gmax(mmHg) 50.56±16.50 0.02±2.79 5.58 0.961 0.962 Gmean(mmHg) 33.44±11.47 0.38±3.53 7.06 0.955 0.592 VLVOT/Vmax 0.34±0.09 0.01±0.07 0.14 0.989 0.909
Table IV. Inter-observer reproducibility of echocardiographic measurements of AS
* The hypotheses of the test are H0: dmean(mean difference) = 0 vs. H1: dmean≠ 0. RC: reproducibility coefficient: twice the standard
High standard deviations were observed in the hemodynamic progression of AS, high-lighting the considerable individual variabili-ty in disease progression.
Calculation of aortic valve area according to the continuity equation is a reliable and reproducible method for evaluating the sever-ity of aortic stenosis. However, it requires accurate measurements, because a calculation error could be amplified proportionally to its
square (for example, in determination of the diameter of the LVOT), which contributes to greater intra- and inter-observer variability, thus limiting its validity in some cases.
Other works studying these problems mainly evaluated correlation rather than con-cordance of data(14). We calculated the vari-ability of observations based on the variation coefficient and difference between two meas-urements as the percentage of the mean(10, 15-18).
31
Rev Port Cardiol 2011; 01: 25-33
Figure 2. Inter-observer reproducibility (A-E) of echocardiograph-ic measurements of aortechocardiograph-ic valve stenosis. The central horizontal line corresponds to the mean of the differences of the two measure-ments and the two exterior lines correspond to 2 x SD of the differ-ences.
However, as these coefficients do not show potential systematic errors, we calculated the reproducibility coefficient, which does not vary with the value of the mean. Prior findings on inter-observer variability for AVA indicate that this can reach up to 24%, although stud-ies assessing reproducibility that use regres-sion analysis should be interpreted with cau-tion(18).
In this study, peak aortic jet velocity and the VLVOT/Vmax ratio (interrelated by the Bernoulli equation) demonstrated lower val-ues of intra-and inter-observer variation. Similarly, these two parameters already had the best correlation coefficients. This shows that an increase in peak transvalvular veloci-ty on AS follow-up constitutes the earliest sign of disease progression and is the best parame-ter revealing AS severity because it evaluates the vena contracta (anatomical area).
The coefficients of variation of AVA are similar to those in the literature, which con-firms the clinical limitations of this parameter in monitoring AS progression over time(19). Recall we obtained a correlation coefficient (r) for AVA for 2D echocardiography vs. catheter-ization of 0.71. New methods such as real-time 3D echocardiography (RT3D) will proba-bly be more accurate than 2D echocardiogra-phy and two-dimensional volumetric methods to calculate the area and to grade the severity of AS(20). In the near future evaluating AVA by RT3D will probably demonstrate the best agreement among all techniques. Planimetry of the aortic valve by transesophageal echocardiography shows good correlation with the Gorlin equation and with the continuity equation by RT3D, but this parameter is by itself rarely sufficient for making clinical decisions.
As in other published papers, our study shows through serial measurements that peak transvalvular velocity and aortic valve area are the parameters with least variability and best reproducibility for the evaluation and fol-low-up of patients with AS.
Using the same rationale we additionally propose that the VLVOT/Vmaxratio, i.e. peak trans-valvular velocity (CW) divided by LLVOTpeak
velocity (PW), is a better parameter to evalu-ate AS progression. This ratio is another approach to reducing error related to LVOT diameter measurements by removing cross-sectional area (CSA) from the simplified con-tinuity equation. This dimensionless velocity ratio expresses the size of the effective valve area as a proportion of the CSA of the LVOT. A normal velocity ratio is slightly less than 1, with smaller ratios indicating more severe aor-tic stenosis. For example, a velocity of 0.25 (21) means that the valve opening is reduced to one-fourth (25%) its normal size. The velocity ratio has the advantage of being already “indexed” to body size. Normal intra-cardiac velocities are similar in people of all ages and sizes. By looking at the velocities alone, the velocity ratio assumes that the proximal cross-sectional area is “normal” for the patient and thus the resulting descriptor of stenosis sever-ity is indexed for body size(22).
Therefore, we suggest their routine use in quantification of AS, especially when techni-cal doubts arise (deficient acoustic windows) or when other measurements are close to the limits of different degrees of severity.
The major clinical implications and utility of this study are that it has demonstrated, using appropriate methodology (Bland-Altman plots), that velocity ratio is the most useful parameter to follow aortic stenosis patients in the long term. We came to this con-clusion on the basis of findings in previous studies on this topic and after correlation with angiographic data.
Pedido de Separatas Address for Reprints Luís M. Moura Serviço de Medicina A
Faculdade de Medicina da Universidade do Porto
Alameda Prof. Hernâni Monteiro 4200-319, Porto, Portugal
Tel:+351 225513659 or +351229391000 Fax:+351226092318
E-mail: [email protected]
33
Rev Port Cardiol 2011; 01: 25-33
1. Carabello BA. Clinical practice. Aortic stenosis. N Engl J Med. 2002 Feb 28;346(9):677-82.
2. Ross J, Jr., Braunwald E. Aortic stenosis. Circulation. 1968 Jul;38(1 Suppl):61-7.
3. Nassimiha D, Aronow WS, Ahn C, Goldman ME. Rate of pro-gression of valvular aortic stenosis in patients > or = 60 years of age. Am J Cardiol. 2001 Mar 15;87(6):807-9, A9.
4. Freeman RV, Otto CM. Spectrum of calcific aortic valve disease: pathogenesis, disease progression, and treatment strategies. Circulation. 2005 Jun 21;111(24):3316-26.
5. Otto CM. Valvular aortic stenosis: which measure of severity is best? Am Heart J. 1998 Dec;136(6):940-2.
6. Chen L, Otto CM. Longitudinal assessment of valvular heart dis-ease by echocardiography. Curr Opin Cardiol. 1998 Nov;13(6):397-403.
7. Otto CM. Doppler Echocardiographic Evaluation of Aortic and Mitral Stenoses. Echocardiography. 1999 Oct;16(7, Pt 1):675-6.
8. Bonow RO, Carabello BA, Chatterjee K, de Leon AC, Jr., Faxon DP, Freed MD, et al. ACC/AHA 2006 Practice Guidelines for the Management of Patients With Valvular Heart Disease: Executive Summary: A Report of the American College of Cardiology/American Heart Association Task Force on Practice Guidelines (Writing Committee to Revise the 1998 Guidelines for the Management of Patients With Valvular Heart Disease) Developed in Collaboration With the Society of Cardiovascular Anesthesiologists Endorsed by the Society for Cardiovascular Angiography and Interventions and the Society of Thoracic Surgeons. J Am Coll Cardiol. 2006 Aug 1;48(3):598-675.
9. Connolly HM, Ballman KV, Roger VL, Tajik AJ. Aortic stenosis: no more hemodynamic cardiac catheterization! Mayo Clin Proc. 2001 Sep;76(9):961.
10. Geibel A, Gornandt L, Kasper W, Bubenheimer P. Reproducibility of Doppler echocardiographic quantification of aortic and mitral valve stenoses: comparison between two echocar-diography centers. Am J Cardiol. 1991 May 1;67(11):1013-21.
11. Smith LA, Cowell SJ, White AC, Boon NA, Newby DE, Northridge DB. Contrast agent increases Doppler velocities and improves reproducibility of aortic valve area measurements in patients with aortic stenosis. J Am Soc Echocardiogr. 2004 Mar;17(3):247-52.
12. Lang RM, Bierig M, Devereux RB, Flachskampf FA, Foster E, Pellikka PA, et al. Recommendations for chamber quantification. Eur J Echocardiogr. 2006 Mar;7(2):79-108.
BIBLIOGRAFIA / REFERENCES
13. Lang RM, Bierig M, Devereux RB, Flachskampf FA, Foster E, Pellikka PA, et al. Recommendations for chamber quantification: a report from the American Society of Echocardiography's Guidelines and Standards Committee and the Chamber Quantification Writing Group, developed in conjunction with the European Association of Echocardiography, a branch of the European Society of Cardiology. J Am Soc Echocardiogr. 2005 Dec;18(12):1440-63.
14. Bland JM, Altman DG. Statistical methods for assessing agree-ment between two methods of clinical measureagree-ment. Lancet. 1986 Feb 8;1(8476):307-10.
15. Otto CM, Pearlman AS, Gardner CL. Hemodynamic progres-sion of aortic stenosis in adults assessed by Doppler echocardiog-raphy. J Am Coll Cardiol. 1989 Mar 1;13(3):545-50.
16. Warth DC, Stewart WJ, Block PC, Weyman AE. A new method to calculate aortic valve area without left heart catheterization. Circulation. 1984 Dec;70(6):978-83.
17. Zoghbi WA, Farmer KL, Soto JG, Nelson JG, Quinones MA. Accurate noninvasive quantification of stenotic aortic valve area by Doppler echocardiography. Circulation. 1986 Mar;73(3):452-9.
18. Otto CM, Pearlman AS, Comess KA, Reamer RP, Janko CL, Huntsman LL. Determination of the stenotic aortic valve area in adults using Doppler echocardiography. J Am Coll Cardiol. 1986 Mar;7(3):509-17.
19. Cowell SJ, Newby DE, Prescott RJ, Bloomfield P, Reid J, Northridge DB, et al. A randomized trial of intensive lipid-lowering therapy in calcific aortic stenosis. N Engl J Med. 2005 Jun 9;352(23):2389-97.
20. Gutierrez-Chico JL, Zamorano JL, Prieto-Moriche E, Hernandez-Antolin RA, Bravo-Amaro M, Perez de Isla L, et al. Real-time three-dimensional echocardiography in aortic stenosis: a novel, simple, and reliable method to improve accuracy in area calculation. Eur Heart J. 2008 May;29(10):1296-306.
21. Oh JK, Taliercio CP, Holmes DR, Jr., Reeder GS, Bailey KR, Seward JB, et al. Prediction of the severity of aortic stenosis by Doppler aortic valve area determination: prospective Doppler-catheterization correlation in 100 patients. J Am Coll Cardiol. 1988 Jun;11(6):1227-34.
22. Baumgartner H, Hung J, Bermejo J, Chambers JB, Evangelista A, Griffin BP, et al. Echocardiographic assessment of valve steno-sis: EAE/ASE recommendations for clinical practice. J Am Soc Echocardiogr. 2009 Jan;22(1):1-23; quiz 101-2.