Methylated free-circulating
HPP1
DNA is an early response
marker in patients with metastatic colorectal cancer
Andreas Herbst1,3, Nikolay Vdovin1, Sanja Gacesa2, Alexander Philipp 1, Dorothea Nagel3, Lesca M. Holdt3, Mark op den Winkel1, Volker Heinemann4,5,6, Petra Stieber3, Ullrich Graeven7, Anke Reinacher-Schick8, Dirk Arnold9, Ingrid Ricard2, Ulrich Mansmann2,5,6, Susanna Hegewisch-Becker10and Frank T Kolligs1,5,6,11
1
Department of Medicine II, University of Munich, Munich, Germany
2Institute for Medical Informatics, Biometry and Epidemiology, University of Munich, Munich, Germany 3
Institute of Laboratory Medicine, University of Munich, Munich, Germany
4Department of Medicine III and The Comprehensive Cancer Center, University of Munich, Munich, Germany 5
German Cancer Consortium (DKTK), Heidelberg, Germany 6German Cancer Research Center (DKFZ), Heidelberg, Germany 7
Medizinische Klinik I, Kliniken Maria-Hilf GmbH, M€onchengladbach, Germany
8Department of Hematology and Oncology, Ruhr-University of Bochum, St. Josef Hospital, Bochum, Germany 9
Instituto CUF de Oncologia (I.C.O.), Lisbon, Portugal 10HOPE - Practice for Oncology, Hamburg, Germany 11
HELIOS Klinikum Berlin-Buch, Berlin, Germany
Detection of methylated free-circulating DNA (mfcDNA) for hyperplastic polyposis 1 (HPP1)in blood is correlated with a poor prognosis for patients with metastatic colorectal cancers (mCRC). Here, we analyzed the plasma levels ofHPP1mfcDNA in mCRC patients treated with a combination therapy containing a fluoropyrimidine, oxaliplatin and bevacizumab to test whetherHPP1
mfcDNA is a suitable prognostic and response biomarker. From 467 patients of the prospective clinical study AIO-KRK-0207, mfcDNA was isolated from plasma samples at different time points and bisulfite-treated mfcDNA was quantified using methylation specific PCR. About 337 of 467 patients had detectable levels forHPP1mfcDNA before start of treatment. The detection was significantly correlated with poorer overall survival (OS) (HR51.86; 95%CI 1.37–2.53). About 2–3 weeks after the first administration of combination chemotherapy,HPP1mfcDNA was reduced to non-detectable levels in 167 of 337 patients. These patients showed a better OS compared with patients with continued detection ofHPP1mfcDNA (HRHPP1(sample 1: pos/ sample 2: neg)vs. HPP1(neg/neg)51.41; 95%CI 1.00–2.01,HPP1(neg,pos/pos)vs. HPP1(neg/neg)52.60; 95%CI 1.86–3.64). Receiver operating characteristic analysis demonstrated thatHPP1mfcDNA discriminates well between patients who do (not) respond to therapy according to the radiological staging after 12 or 24 weeks (AUC50.77 or 0.71, respectively). Detection of HPP1mfcDNA can be used as a prognostic markerandan early marker for response (as early as 3–4 weeks after start of treatment compared with radiological staging after 12 or 24 weeks) to identify patients who will likely benefit from a combination chemo-therapy with bevacizumab.
Introduction
The introduction of chemotherapeutic combination regimen including fluoropyrimidines, oxaliplatin and irinotecan, as well as monoclonal antibodies (like cetuximab, panitumumab
and bevacizumab) to first- and further line treatment regimen have improved the overall survival of patients with mCRC. However, long-term survival rates of patients with mCRC
are still low, with only few patients being eventually cured.1–4
Key words:colorectal cancer, prognosis, response, free-circulating DNA, HPP1
Conflict of Interest
VH: Honoraria: Merck, Roche, Amgen, Sanofi. Research funding: Merck, Roche, Amgen, Pfizer.
ARS: Honoraria: Amgen, Roche, Sanofi-Aventis, Merck-Serono, Celgene, Baxalta. Consulting or Advisory Board: Amgen, Roche, Pfizer, Sanofi-Aventis, Merck-Serono, Celgene, Baxalta. Studies sponsored by: Roche, Sanofi-Aventis, Celgene.
DA: Honoraria for presentations: Roche, Sanofi, Bayer, Merck. Consulting or Advisory Board: Merck, Roche, Sanofi, Bayer, Servier, SIRTEX. Travel & accommodation expenses: Sanofi, Roche, Servier.
All other authors declared no potential conflicts of interest.
DOI:10.1002/ijc.30625
History:Received 9 Aug 2016; Accepted 22 Dec 2016; Online 25 Jan 2017
Correspondence to:Andreas Herbst, Inst. of Laboratory Medicine, Marchioninistr. 15, University of Munich, 81377 Munich, Germany, Tel.:
149 89 4400-73207, Fax:149 89 4400-78888, E-mail: [email protected]
Tumor
Markers
and
Signatures
Currently, only the pathohistological tumor staging (TNM) is used as prognostic parameter in the clinic. Analysis of the RAS mutational status is the only predictive marker for the treatment of CRC patients with the anti-EGFR antibodies
cetuximab and panitumumab.1–4 For this reason, additional
tissue or blood biomarkers are urgently needed to improve prediction and to guide therapies.
So far, several tissue-based biomarkers with the potential to be used in the clinic have been described to classify sub-types of colorectal tumors, for example, microsatellite insta-bility, CpG island methylator phenotype (CIMP), mutations
of DNA repair genes5 and RAS.1 However, the detection of
these markers depends on the analysis of a biopsy or tumor tissue after resection. In addition, because of intratumoral heterogeneity as well as heterogeneity between metastases, the analysis of one biopsy might not necessarily represent the
whole tumor burden of a given patient.6However, analysis of
multiple biopsies is not feasible in the clinical routine. Potent
blood-derived biomarkers might overcome this problem.7
CEA and CA19-9 were the first blood-based biomarkers for colorectal cancer. CEA has been described as an independent prognostic tumor marker for the overall survival of patients
with curatively resectable or metastasized CRC.8–13New studies
revealed that high CEA serum levels at the beginning of a combination therapy including bevacizumab are correlated
with a poor prognosis.14 Furthermore, increasing CEA levels
during a treatment with oxaliplatin-based chemotherapy with
bevacizumab indicate tumor progression.15Nevertheless, CEA
is not an established response marker. Instead, response evalua-tion criteria in solid tumors (RECIST-1) are commonly used to
define the degree of tumor response to chemotherapies.16
Treatment of patients with tumors should result in tumor
shrinkage that can be monitored using radiological screening.17
Tumor cells of primary tumors and metastases are constantly turned over with their DNA being released into circulation. Free-circulating tumor DNA can be isolated and analyzed for
muta-tions and methylation patterns derived from tumor cells.7In
con-trast to repeated biopsies, repeated sampling and analysis of blood-derived markers is feasible. Next to the detection of muta-tions in proto-oncogenes and tumor suppressor genes in
free-circulating DNA,18–20 detection of methylated, free-circulating
tumor DNA has been intensively studied in recent years.21–24
Increased methylation of regulatory gene sequences, so called CpG islands in the promoter region of genes, is a hallmark of
tumor cells25–27 and can be used to differentiate normal and
tumor cells.28,29 It has been shown that the detection of gene
methylation for individual genes in blood samples, like
CDKN2A,MYOD1,ID4andHPP1,30–33as well as the methyla-tion of a panel of genes was correlated with a poor prognosis of
patients with colorectal carcinomas at late stages.34,35
The gene HPP1 (hyperplastic polyposis 1/transmembrane
protein containing epidermal growth factor and follistatin domains) encodes a transmembrane protein and is frequently
methylated in colorectal tumors.36,37 Previously, HPP1 has
been shown to activate STAT1 signaling for its function as a
tumor suppressor, however,Hpp1mutant mice did not show
an increased tumor burden.38,39We have demonstrated that
detection of methylated free-circulating HPP1DNA in blood
samples is a prognostic factor for patients with mCRC.33,40–42
In the prospective study AIO-KRK-0207, different strate-gies for maintenance treatments were examined, following a 24 week combination chemotherapy with a fluoropyrimidine
(5-FU or capecitabine), oxaliplatin plus bevacizumab.43Blood
samples were collected during the combination chemotherapy
for translational projects. Here, the levels of HPP1mfcDNA
and CEA in blood samples before and 2–3 weeks after the start of the chemotherapy were determined and correlated with OS and response (radiological staging after 12 and
24 weeks, respectively), to evaluate whether HPP1 mfcDNA
and CEA are suitable markers for prognosis and early response to therapy.
Material and Methods Study design and patients
The clinical study AIO-KRK-0207 (NCT00973609; https:// clinicaltrials.gov/ct2/show/record/NCT00973609) is a randomized three arm phase III trial with different maintenance strategies after a 24-weeks combination chemotherapy, consisting of a treatment with a fluoropyrimidine, oxaliplatin and bevacizumab. Investi-gators assessed tumor response by CT or MRI scans at weeks 12 and 24 according to RECIST version 1.0 (see Ref. 43 for details regarding the protocols). Blood samples were drawn prior to the treatment start (Day 1; “BS1”) and after 15 to 22 days (corre-sponding to the first administration of FOLFOX or CAPOX
regime, respectively; “BS2”). Plasma was used to quantifyHPP1
mfcDNA; CEA was measured as a reference using serum. Charac-teristics of the patient cohort are shown in Table 1. Out of the 825 patients that were included in the clinical study AIO-KRK-0207,
What’s new?
Tumor cells of primary tumors and metastases are constantly turned over with their DNA being released into blood circulation. Here the authors quantified circulating DNA of the hyperplastic polyposis 1 (HPP1) gene, which is frequently methylated in colorectal tumors, in a prospective clinical study of combination chemotherapy in patients with metastatic colorectal cancer. They confirmed their previous finding that HPP1 methylated free-circulating DNA (mfcDNA) is a prognostic marker for progression-free and overall survival in these patients. In addition, HPP1 mfcDNA served as a marker differentiating between chemotherapy responders and non-responders, underscoring the usefulness of DNA-based biomarkers in cancer treatment.
Tumor
Markers
and
blood samples were available for 467 patients. The 467 patients did not differ from the 358 patients that have been excluded from this study due to missing blood samples with respect to several variables (Supporting Information Table 1).
Blood samples
Blood samples underwent standardized pre analytical proce-dures. Serum: Blood was drawn using serum monovettes
(Sarstedt, N€urnbrecht, Germany), incubated at room
temper-ature for 60 min and centrifuged for 10 min at 2,000g. The
supernatant was decanted and used for CEA measurements. Plasma: Blood was drawn using EDTA monovettes (Sarstedt)
and centrifuged for 10 min at 2,000g. The supernatant was
transferred to a new tube and used for DNA isolation and bisulfite conversion.
DNA isolation and bisulfite conversion
The frozen plasma samples were thawed at room temperature and homogenized by smoothly flicking the tube. Genomic
DNA from 200mL of each plasma sample was isolated using
the High Pure Viral Nucleic Acid Kit (Roche Applied Sci-ence, Mannheim, Germany) according to the manufacturer’s
instructions and eluted in 50 mL of Elution Buffer. Sodium
bisulfite conversion of DNA was performed using the EZ DNA Methylation-Gold Kit (Zymo Research, Freiburg, Germany) according to the manufacturer’s protocol.
Analysis of DNA methylation
Bisulfite-treated DNA was analyzed by a fluorescence-based,
real-time PCR assay, described previously as Methy-Light.44
Dispersed Alu repeats were used to control for DNA amplification and to normalize for input DNA. Primer and
probe sequences for HPP1 and Alu have been described
previously.33 PCRs were performed in a reaction volume of
20lL containing 13PCR buffer (Qiagen, Hilden, Germany),
4 mmol/L MgCl2, 250 lmol/L desoxynucleotide triphosphate
mixture, 2lL bisulfite-treated DNA, 0.05 units/lL Taq DNA
polymerase (HotStar Taq, Qiagen) along with HPP1 specific
primers and probe as described previously33 (see also
Supporting Information Fig. 1). PCRs were conducted in a
Mastercycler ep realplex4 (Eppendorf, Hamburg, Germany)
using the following conditions: 958C for 900 sec followed by
50 cycles of 958C for 30 sec, 608C for 120 sec and 848C for
20 sec. The specificity of all reactions for methylated DNA was confirmed by separately amplifying completely methylated and unmethylated human control DNA (Chemicon, Temecula, CA) with each set of primers and probes. Samples were
analyzed in triplicates and the average amount ofHPP1or Alu,
respectively, was used for the calculations. The percentage of fully methylated reference (PMR) at a specific locus was
calcu-lated as described previously44by dividing the gene/Alu ratio of
a sample by the gene/Alu ratio of fully methylated, bisulfite-treated DNA (CpGenomeTM Universal Methylated DNA, Millipore, Billerica, MA). A gene was considered methylated if
Table 1.Patient characteristics
N (%)
All patients 467 (100)
Age
<70 years 310 (66.4)
70 years 157 (33.6)
Gender
Female 168 (36.0)
Male 299 (64.0)
ECOG
0 258 (55.2)
112 193 (41.3)
Unknown 16 (3.4)
Primary tumor site
Colon 298 (63.8)
Rectum 169 (36.2)
Number of metastatic sites
1 198 (42.4)
>1 267 (57.2)
Unknown 2 (0.4)
Synchronous/metachronous metastasis
Synchronous 391 (83.7)
Metachronous 76 (16.3)
Induction therapy1
CAPOX 19 (4.1)
FOLFOX4 145 (31.0)
FOLFOX4MOD 107 (22.9)
FOLFOX4SIMPLE 46 (9.9)
FOLFOX6 84 (18.0)
FOLFOX7MOD 5 (1.1)
XELOX 59 (12.6)
Unknown 2 (0.4)
Radiological staging (12 weeks)
CR 3 (0.6)
PR 210 (45.0)
SD 175 (37.5)
PD 32 (6.9)
ND 47 (10.1)
Radiological staging (24 weeks)
CR 10 (2.1)
PR 222 (47.5)
SD 140 (30.0)
PD 79 (16.9)
ND 16 (3.4)
Blood samples were available for 467 patients.
1All patients received bevacizumab; ND not determined.
Tumor
Markers
and
the percentage of the fully methylated reference value was greater than 0.
Quantification of CEA
CEA was quantified using a micro particle immuno enzymometric assay (AxSYM, Abbott Laboratories, Chicago, IL).
Statistical analysis
The event time data on OS and PFS were analyzed by Kaplan–Meier estimates, log rank test, and the Cox propor-tional hazards model. We defined the time to event starting at the date of the first biomarker measurement. These analy-ses also were performed in the subgroup of randomized patients stratified for treatment arms. Stratification allows taking into account non-proportional treatment specific baseline hazards by studying effects of factors across the treatment arms (Supporting Information Tables 3 and 4). In addition, multivariate Cox regression models including estab-lished prognostic factors together with CEA and HPP1 were analyzed and compared by means of the Akaike information criterion (AIC). In the sense of the AIC a model is better with respect to the comparator if the AIC of the comparator is larger (Supporting Information Table 5). Small AICs indi-cate better models. Robustness of the preferred final model was investigated in 200 bootstrap samples. How biomarker values or changes are able to discriminate response to thera-py was analyzed using receiver-operator curves (ROC) curves
and area under the curves (AUC) as described previously.45
The analyses were performed with SAS V9.4 and R Version
2.13.2 using the packages survival [Version 2.36-9, Terry
Therneau, 2011] and ROCR [Version 1.0-4, Tobias Sing,
Oliver Sander, Niko Beerenwinkel, Thomas Lengauer, 2009].
Results
Correlation of theHPP1methylation status with overall survival
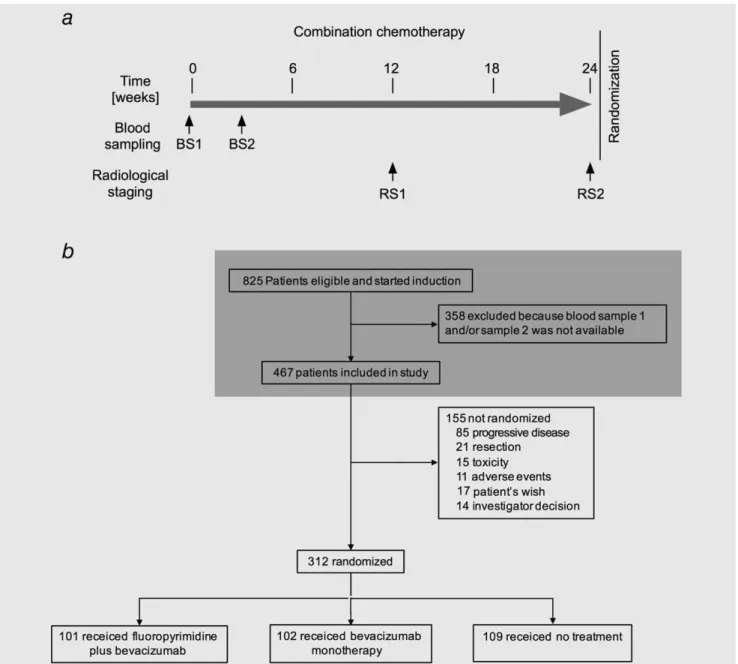
Blood samples were drawn at defined time points before treat-ment (“BS1”) and after one administration of the combination chemotherapy treatment (Day 15 or 22; “BS2”). Radiological staging of the tumor was performed 12 (“RS1”) and 24 weeks (“RS2”) after the start of the combination chemotherapy as
indicated by arrows (Fig. 1a). Out of the 825 patients that were
eligible to participate in the study AIO-KRK-0207 and received
combination chemotherapy, blood samples BS1andBS2 were
available for 467 patients (Fig. 1band Table 1).
Of the 467 mCRC patients, 337 (72%) had detectableHPP1
mfcDNA levels before therapy. Patients with detectable levels of
HPP1mfcDNA in the first blood sample had a lower overall
sur-vival compared with patients with non-detectable levels ofHPP1
mfcDNA (HR51.86; 95% CI 1.37–2.53) (Fig. 2a, Table 2).
Like-wise, patients with CEA levels above the median of 56.4 ng/mL (“CEA high”) in the first blood sample had a lower overall survival compared with patients with CEA levels below the
median (“CEA low”) (HR51.82; 95% CI 1.41–2.35) (Fig. 2b,
Table 2). In thesecondblood sample, the respective hazard ratio
was higher for HPP1 mfcDNA compared with CEA (“HPP1
BS2”: HR52.13; 95% CI 1.65–2.74vs. “CEA BS2”: HR51.75;
95% CI 1.36–2.25) (Figs. 2cand 2d, Table 2).
Treatment of the patients resulted in a statistically
signifi-cant change ofHPP1mfcDNA and CEA levels in the second
blood sample compared with the first one (p<0.0001 for both
variables, Supporting Information Fig. 2). After the first
admin-istration of combination chemotherapy,HPP1mfcDNA levels
were reduced to non-detectable levels in 167 out of 337
patients. The 167 patients with non-detectableHPP1mfcDNA
levels in the second blood sample (“pos/neg”) showed a better
OS compared with the 176 patients showing detectableHPP1
mfcDNA levels in the second blood sample (“neg,pos/pos,” including 6 patients with nondetectable levels in the first and detectable levels in the second sample) and a lower OS com-pared with patients with nondetectable HPP1 mfcDNA in both
samples (HR “pos/neg”vs. “neg/neg”51.41; 95% CI 1.00–2.01,
HR “pos/pos” vs. “neg/neg”52.60; 95% CI 1.86–3.64) (Table
2). In contrast, only 34 (of 234) patients switched from CEA levels above the cut-off value (“CEA BS1,” “high”) to CEA lev-els below the cut-off value (“CEA BS1/BS2,” “high/low”). The median overall survival of these patients (“CEA high/low”) was 26.5 months compared with 19.5 months of the 207 patients that had CEA levels above the cut-off value after treatment (“CEA low,high/high,” including 7 patients switching from
CEA low to CEA high) (Fig. 1f, Table 2). These data indicate
thatHPP1mfcDNA and CEA levels in the first and the second
blood sample are prognostic markers for OS in the univariate
analysis. In addition, non-detectableHPP1 mfcDNA levels in
the second blood sample of patients with initially detectable
HPP1 mfcDNA levels might indicate a response to therapy.
For progression-free survival respective results are shown in Supporting Information Table 2. The different treatment arms had neither an effect on OS nor PFS, since the hazard ratios after stratification are comparable to the hazard ratios without stratification (compare Table 2 and Supporting Information Table 3 for OS; Supporting Information Table 2 and Supporting Information Table 4 for PFS; see also Supporting Information Fig. 3).
Different Cox models were calculated and compared by the Akaike information criterion (AIC) to find a suitable Cox model that includes established clinical parameters, like the mutational status, grading, ECOG, and tumor load (Support-ing Information Table 5). These clinical parameters were
ana-lyzed either alone or in combination with theHPP1mfcDNA
and/or CEA levels in blood sample 1 (BS1) or 2 (BS2) as
well as the change ofHPP1 mfcDNA or CEA levels between
BS1 and BS2 (“change”). Interactions between HPP1 and
CEA were investigated but did not improve any of the
models. Since the mutational status of RAS and BRAF was
only available for 85% of the patients, we also calculated the AIC without the mutational status to show that results in principle do not differ for a greater number of cases. It is important to note, however, that AIC values can directly be compared only for analyses within the same group of cases
Tumor
Markers
and
and events. Comparison of the models for OS including mutational status, grading, ECOG, and tumor load yielded an AIC of 1,913 for the model including only these clinical vari-ables and AICs ranging from 1,891 to 1,905 for models
including additionally CEA and HPP1. Thus, all models
including also CEA and/orHPP1 were better with respect to
AIC, the best models being clinical variables together with
HPP1 BS2 and CEA BS2 orHPP1 change and CEA change,
respectively (AIC51,891, Supporting Information Table 5).
However, models including only HPP1 BS2 orHPP1 change
were nearly as good (AIC51,892). Of these “best” models
based on the AIC calculation, the least complex one
includ-ing clinical parameters and HPP1 mfcDNA levels at BS2 is
shown (Table 3). According to this model, HPP1 mfcDNA
levels in the second blood sample represent an independent prognostic factor for OS next to the BRAF or RAS mutation-al status, grading, ECOG and the number of metastatic sites,
respectively (“HPP1 BS2”: HR52.08; 95% CI 1.31–1.53,
Table 3). This result for HPP1was confirmed in a bootstrap
analysis: The average hazard ratio for HPP1 mfcDNA in
BS2 in 200 bootstrap samples was 2.16 (range 1.36–3.58,
p<0.05 for 199/200 samples). Comparison of the models for
Figure 1.Schematic diagram of the combination chemotherapy and CONSORT diagram. (a) The combination chemotherapy of the prospective study AIO-KRK-0207 lasted 24 weeks. Blood was drawn before the start (“BS1”) and after one administration (“BS2”) of the combination chemotherapy. Radiological staging was performed after 12 (“RS1”) and 24 weeks (“RS2”). (b) 825 mCRC patients were eligible to participate in the study AIO-KRK-0207 and were treated with the combination chemotherapy. Blood samples 1 (BS1)and2 (BS2) were available for 467 patients and were analyzed in this study. This part is highlighted by a gray box.
Tumor
Markers
and
Figure 2.Kaplan-Meier plots showing overall survival. mCRC patients with undetectable/detectableHPP1mfcDNA levels were classified as “neg” or “pos,” respectively. Patients with CEA levels below/above the cut-off value were classified as “low” or “high,” respectively. (a) Overall survival is shown for all 467 mCRC patients according to the levels ofHPP1mfcDNA in the first blood sample (BS1) (b) Kaplan–Meier plot based on the CEA level in BS1. (c) and (d) The corresponding Kaplan–Meier plots based on the levels ofHPP1mfcDNA or CEA levels in the second blood sample (BS2). (e) Kaplan–Meier plot showing the combined information regarding theHPP1mfcDNA levels before and after the first administration of treatment (HPP1 BS1/BS2). (f) Kaplan–Meier plot based on the combined information of CEA serum levels before and after the first administration of treatment (CEA BS1/BS2).
Tumor
Markers
and
PFS yielded similar results withHPP1mfcDNA levels as an inde-pendent prognostic factor (Supporting Information Table 6).
These data indicate thatHPP1mfcDNA levels in the first and
the second blood sample are independent prognostic markers of
clinical variables and CEA. In comparison, CEA levels in the first and second blood sample are independent prognostic markers of clinical variables, but only CEA in the first blood sample is also
independent ofHPP1levels.
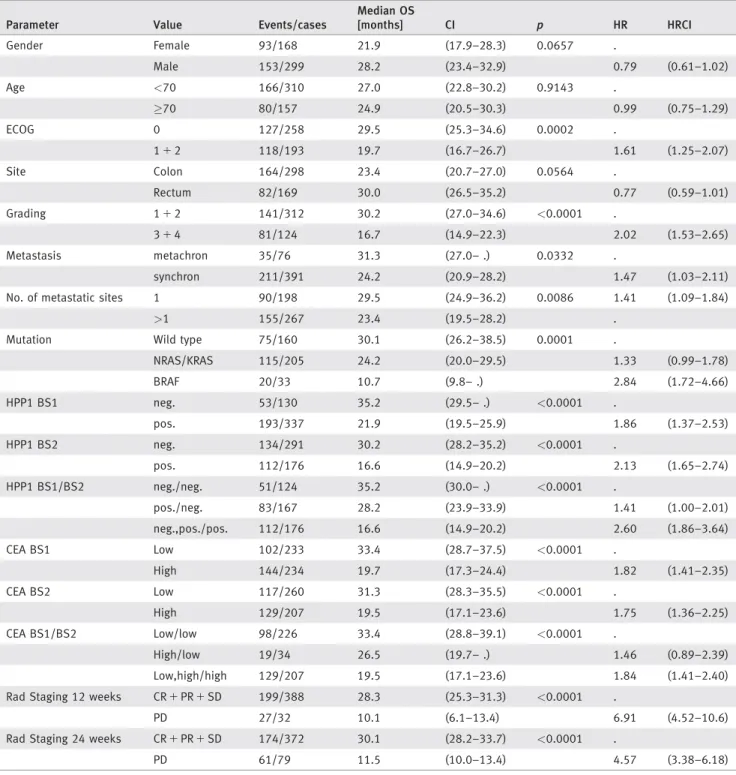
Table 2.Median overall survival (OS) and hazard ratios were calculated for various clinical parameters,HPP1mfcDNA or CEA levels
Parameter Value Events/cases
Median OS
[months] CI p HR HRCI
Gender Female 93/168 21.9 (17.9–28.3) 0.0657 .
Male 153/299 28.2 (23.4–32.9) 0.79 (0.61–1.02)
Age <70 166/310 27.0 (22.8–30.2) 0.9143 .
70 80/157 24.9 (20.5–30.3) 0.99 (0.75–1.29)
ECOG 0 127/258 29.5 (25.3–34.6) 0.0002 .
112 118/193 19.7 (16.7–26.7) 1.61 (1.25–2.07)
Site Colon 164/298 23.4 (20.7–27.0) 0.0564 .
Rectum 82/169 30.0 (26.5–35.2) 0.77 (0.59–1.01)
Grading 112 141/312 30.2 (27.0–34.6) <0.0001 .
314 81/124 16.7 (14.9–22.3) 2.02 (1.53–2.65)
Metastasis metachron 35/76 31.3 (27.0– .) 0.0332 .
synchron 211/391 24.2 (20.9–28.2) 1.47 (1.03–2.11)
No. of metastatic sites 1 90/198 29.5 (24.9–36.2) 0.0086 1.41 (1.09–1.84)
>1 155/267 23.4 (19.5–28.2) .
Mutation Wild type 75/160 30.1 (26.2–38.5) 0.0001 .
NRAS/KRAS 115/205 24.2 (20.0–29.5) 1.33 (0.99–1.78)
BRAF 20/33 10.7 (9.8– .) 2.84 (1.72–4.66)
HPP1 BS1 neg. 53/130 35.2 (29.5– .) <0.0001 .
pos. 193/337 21.9 (19.5–25.9) 1.86 (1.37–2.53)
HPP1 BS2 neg. 134/291 30.2 (28.2–35.2) <0.0001 .
pos. 112/176 16.6 (14.9–20.2) 2.13 (1.65–2.74)
HPP1 BS1/BS2 neg./neg. 51/124 35.2 (30.0– .) <0.0001 .
pos./neg. 83/167 28.2 (23.9–33.9) 1.41 (1.00–2.01)
neg.,pos./pos. 112/176 16.6 (14.9–20.2) 2.60 (1.86–3.64)
CEA BS1 Low 102/233 33.4 (28.7–37.5) <0.0001 .
High 144/234 19.7 (17.3–24.4) 1.82 (1.41–2.35)
CEA BS2 Low 117/260 31.3 (28.3–35.5) <0.0001 .
High 129/207 19.5 (17.1–23.6) 1.75 (1.36–2.25)
CEA BS1/BS2 Low/low 98/226 33.4 (28.8–39.1) <0.0001 .
High/low 19/34 26.5 (19.7– .) 1.46 (0.89–2.39)
Low,high/high 129/207 19.5 (17.1–23.6) 1.84 (1.41–2.40)
Rad Staging 12 weeks CR1PR1SD 199/388 28.3 (25.3–31.3) <0.0001 .
PD 27/32 10.1 (6.1–13.4) 6.91 (4.52–10.6)
Rad Staging 24 weeks CR1PR1SD 174/372 30.1 (28.2–33.7) <0.0001 .
PD 61/79 11.5 (10.0–13.4) 4.57 (3.38–6.18)
Patients were grouped according to the levels ofHPP1mfcDNA in the first (BS1) or the second blood sample (BS2) into the categories “HPP1 detectable” (pos.) or “HPP1 non-detectable” (neg.). Similarly, patients with CEA levels below/above the cut-off CEA level were defined as “CEA low” or “CEA high,” respectively. For the combined analysis ofHPP1(andCEA)levels in BS1 and BS2, the groups “neg./pos.” (“low/high”) and “pos./pos.” (“high/high”) were combined to generate the group “neg.,pos./pos”(“low,high/high”), since the group “neg./pos.” was small and clinically not relevant. The number of events (deaths) and cases are listed. For each parameter the median OS was calculated.pvalues indicate if the median OS is statistically significant different between matching values. Hazard ratios (HR) and the 95% confidence interval (HRCI) indicate the risk associated with a given parameter. The mean OS was 27.2 months for the patient cohort, the median OS was 25.9 months (95% CI: 22.6–29.9).
Tumor
Markers
and
HPP1 mfcDNA is a response marker
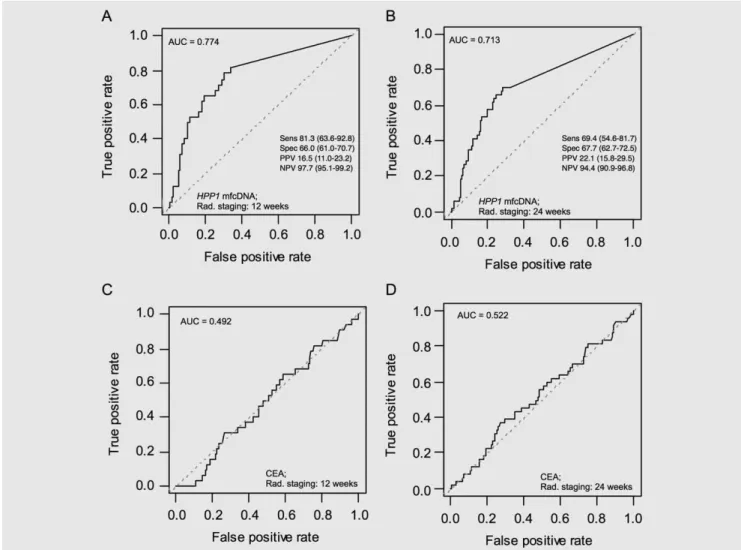
About 12 and 24 weeks after the start of treatment, radiograph-ic evaluation based on RECIST criteria was done. Patients showing a complete remission (CR), partial remission (PR) or stable disease (SD) were classified as “responders,” whereas patients who showed a progressive disease (PD) were defined as “non-responders.” According to the staging, 388 (12 weeks, RS1) and 372 patients (24 weeks, RS2), respectively, responded to the combination chemotherapy (Table 1). To test the
suit-ability of HPP1 mfcDNA as a marker for response, we
per-formed an ROC analysis using HPP1 mfcDNA levels in the
second blood sample to discriminate between responders (CR, PR, SD) and non-responders (PD) according to the results of the radiological staging after 12 and 24 weeks (Table 1). The area under the curve (AUC) was 0.77 (radiological staging after
12 weeks) and 0.71 (24 weeks), respectively (Figs. 3aand 3b).
The negative predictive value (NPV) ofHPP1mfcDNA in BS2
was 97.7 (95.1–99.2) at RS1 and 94.4 (90.9–96.8) at RS2. In contrast, CEA serum levels in the second blood sample did not discriminate between these two groups of mCRC patients (12
weeks: AUC50.49; 24 weeks: AUC50.52) (Figs. 3cand 3d).
According to these data, HPP1mfcDNA levels after the first
administration of the combination chemotherapy can be used as a marker for response to identify CRC patients that go into remission or show a stable tumor size. Moreover, information
regarding the HPP1 mfcDNA levels was available 2–3 weeks
after the start of the treatment, whereas the radiological staging took place after 12 and 24 weeks, respectively.
Discussion
Detection of free-circulating tumor DNA in blood samples represents a minimally invasive approach to biologically represent the tumor of a patient and offers the chance to monitor the response to treatment by measuring the levels of
fcDNA throughout the administration of a therapy.7,46,47
We have demonstrated in retrospective studies that
detec-tion of methylated free-circulatingHPP1DNA is a prognostic
factor for CRC patients UICC stage IV.33,40–42 The results of
this prospective study utilizing a homogenously treated cohort of mCRC patients confirmed our previous results: Detection of
HPP1mfcDNA is an independent prognostic factor for lower
overall survival. Furthermore, a reduction ofHPP1mfcDNA to
non-detectable levels after the first administration of treatment was correlated with reduced risk of progression compared with
patients who still had detectableHPP1mfcDNA levels. In
addi-tion, the level ofHPP1mfcDNA after the first administration
of treatment was able to discriminate between patients with a “response or stable” (CR, PR, SD) or a “progressive” (PD) course of disease.
The results of this study show that CEA serum levels have
a prognostic value. In contrast to CEA, detection of HPP1
mfcDNA in the second plasma sample has the additional advantage of being a marker for response. Whereas CEA is not able to distinguish between mCRC patients with a response or stable versus a progressive course of disease,
HPP1mfcDNA offers the possibility to identify patients who
benefit from the therapy. Apart from patients that respond to
the treatment with a reduction of HPP1 mfcDNA to
non-detectable levels, it is also important to identify patients who do not respond to a given therapy. This information offers the opportunity to identify progressors earlier and to potential-ly switch these patients to a different treatment regimen. We have not intended in our study to give any advice in terms of which alternative therapy should be used for patients progress-ing durprogress-ing induction therapy. This question remains open and
needs to be answered by future studies. Taken together,HPP1
mfcDNA has the potential to monitor response to therapy at an earlier time point than the radiological imaging.
To our knowledge, this is the first report demonstrating the suitability of detection of methylated, free-circulating DNA as a response marker for patients with metastatic colorectal cancer.
In a different study, circulating KRAS G13D tumor DNA
(ctDNA) was used as an early marker for the response of patients with metastatic colorectal cancers to treatment with oxaliplatin or irinotecan (with or without bevacizumab). There, ctDNA lev-els decreased in 41 of 48 patients and correlated with response to therapy measured by radiologic staging, whereas no significant
changes in CEA levels were observed.48In another study
circu-lating miR-126 was identified as a potential biomarker for response to a therapy consisting of chemotherapy and
bevacizu-mab in 68 patients with mCRCs.49 Another group identified
a marker panel for circulating tumor cells in 50 RAS-BRAF
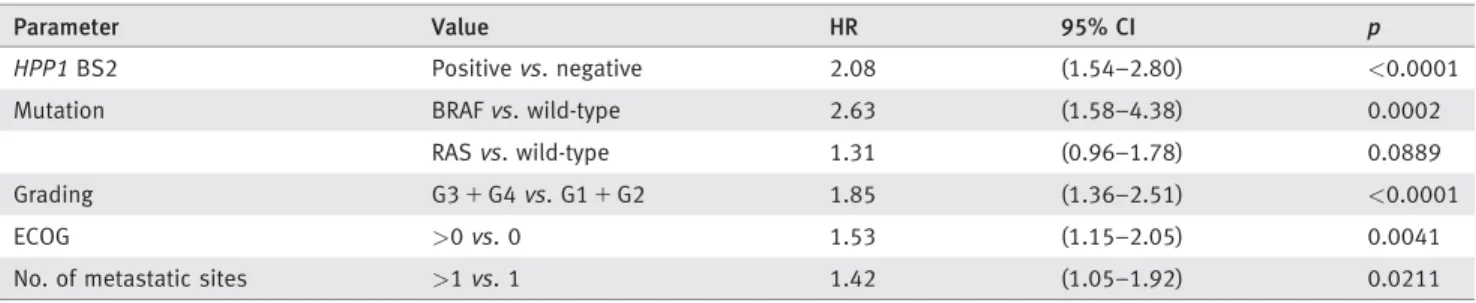
Table 3.Multivariate analysis regarding the overall survival (OS)
Parameter Value HR 95% CI p
HPP1BS2 Positivevs. negative 2.08 (1.54–2.80) <0.0001
Mutation BRAFvs. wild-type 2.63 (1.58–4.38) 0.0002
RASvs. wild-type 1.31 (0.96–1.78) 0.0889
Grading G31G4vs. G11G2 1.85 (1.36–2.51) <0.0001
ECOG >0vs. 0 1.53 (1.15–2.05) 0.0041
No. of metastatic sites >1vs. 1 1.42 (1.05–1.92) 0.0211
Based on the calculation and comparison of AIC values for different Cox models (Supporting Information Table 5), we decided to use a Cox model including clinical parameters and theHPP1mfcDNA levels at BS2 to perform a multivariate analysis for OS. The corresponding hazard ratios (HR) and confidence intervals (95% CI) of this model are presented for each parameter.pvalues indicate statistical significant differences between values.
Tumor
Markers
and
wild-type mCRC patients and were able to identify patients that did (not) respond to a therapy including cetuximab or
panitu-mumab.50These studies are all characterized by a limited
num-ber of patient samples and retrospective data analysis. In comparison, we studied a homogeneous collection of 467 mCRC patients that have all been treated with a fluoropyrimidine,
oxali-platinandbevacizumab in a prospective clinical study. Based on
our results, detection of methylated, free-circulatingHPP1DNA
is a prognostic as well as a response biomarker for mCRC
patients. For this reason,HPP1mfcDNA might become a
bio-marker that could be used for monitoring response to first-line therapy and switching therapy protocols earlier than indicated by radiological staging. However, this potential use needs to be confirmed by prospective studies guiding therapy depending on the response of the biomarker. Furthermore, a study is desirable that tests the various above-mentioned biomarkers and poten-tially other markers head-to-head. Interestingly, in our as well as
another study,48CEA was not suitable as an early marker to
indi-cate a response to therapy.
Our study benefits from the prospective collection of samples, the large number of available patient samples and the homogenous treatment of the mCRC patients included. Nevertheless, the treat-ment protocol only included patients receiving a fluoropyrimidine, oxaliplatin and bevacizumab; other relevant chemotherapeutics or biologicals, like irinotecan or anti-EGFR antibodies, have not been included in this study. The patients included in this study were not pretreated. Hence, results using samples from pretreated patients might be different. Due to the implemented protocol, blood sam-ples were only taken before and after the first administration of the combination chemotherapy. Repeated blood sampling during the chemotherapy was not performed. Therefore, we do not know whether even earlier time points after the first administration of
the chemotherapy would be feasible for the analysis of HPP1
mfcDNA. In the current study, there is (apart from CEA) no
Figure 3.Response curves for second blood HPP1 mfcDNA and CEA levels. (a, b) Response curves were generated by receiver-operator-analysis (ROC) analysis and the area under the curve (AUC) was determined to find out ifHPP1mfcDNA in the second blood sample discriminate between CRC patients with “response or stable” (CR, PR, SD)versus“progressive” (PD) disease, respectively, according to the radiological staging 12 weeks (a) or 24 weeks (b) after start of treatment. The sensitivity (“Sens.”), specificity (“Spez.”), positive predictive value (“PPV”) and negative predictive value (“NPV”) are given for both analyses. (c, d) These ROC analyses were repeated for CEA levels in the second blood sample based on the radiological staging 12 (c) or 24 weeks (d) after start of treatment. The AUC for each analysis is given in the upper left corner of the graph area.
Tumor
Markers
and
comparison with other biomarkers with potential clinical
rele-vance, likeRASmutational status or lactate dehydrogenase (LDH)
levels. However, we compared the suitability ofHPP1 mfcDNA,
CEA and LDH as prognostic biomarkers in a previous study.42
Similarly, the correlation of theHPP1methylation status in tumor
and blood samples of the same patients was not part of this study
but has been reported earlier by us.33
In conclusion, detection ofHPP1 mfcDNA has the
poten-tial to become a clinically relevant biomarker. In CRC
patients with metastatic diseases, analysis of HPP1 mfcDNA
is a suitable prognostic biomarker. In addition, detection of
HPP1 mfcDNA could be used as a marker to monitor
response to therapy and help to identify mCRC patients who most likely benefit from a combination therapy containing a fluoropyrimidine, oxaliplatin and bevacizumab. However,
further studies are needed to establish the detection ofHPP1
mfcDNA as a prognostic and response marker for clinical use and to guide therapeutic decisions.
References
1. Hecht JR, Douillard J-Y, Schwartzberg L, et al. Extended RAS analysis for anti-epidermal growth factor therapy in patients with metastatic colorec-tal cancer.Cancer Treat Rev2015;41:653–9. 2. Welch S, Spithoff K, Rumble RB, et al.
Bevacizu-mab combined with chemotherapy for patients with advanced colorectal cancer: a systematic review.Ann Oncol2010;21:1152–62.
3. K€ohne C-H. How to integrate molecular targeted agents in the continuum of care.Ann Oncol
2010;21Suppl7:vii134–9.
4. Adam R, Haller DG, Poston G, et al. Toward optimized front-line therapeutic strategies in patients with metastatic colorectal cancer–an expert review from the International Congress on Anti-Cancer Treatment (ICACT) 2009.Ann Oncol2010;21:1579–84.
5. Jass JR. Classification of colorectal cancer based on correlation of clinical, morphological and molecular features.Histopathology2007;50:113– 30.
6. Gerlinger M, Rowan AJ, Horswell S, et al. Intra-tumor heterogeneity and branched evolution revealed by multiregion sequencing.N Engl J Med2012;366:883–92.
7. Schwarzenbach H, Hoon DSB, Pantel K. Cell-free nucleic acids as biomarkers in cancer patients.
Nat Rev Cancer2011;11:426–37.
8. Webb A, Scott-Mackie P, Cunningham D, et al. The prognostic value of CEA, beta HCG, AFP, CA125, CA19-9 and C-erb B-2, beta HCG immu-nohistochemistry in advanced colorectal cancer.
Ann Oncol1995;6:581–7.
9. Harrison LE, Guillem JG, Paty P, et al. Preopera-tive carcinoembryonic antigen predicts outcomes in node-negative colon cancer patients: a multi-variate analysis of 572 patients.J Am Coll Surg
1997;185:55–9.
10. Carriquiry LA, Pi~neyro A. Should carcinoem-bryonic antigen be used in the management of patients with colorectal cancer?.Dis Colon Rec-tum1999;42:921–9.
11. Park YJ, Youk EG, Choi HS, et al. Experience of 1446 rectal cancer patients in Korea and analysis of prognostic factors.Int J Colorectal Dis1999;14: 101–6.
12. Wang WS, Chen PM, Chiou TJ, et al. Factors predictive of survival in patients with node-positive colorectal cancer in Taiwan. Hepatogas-troenterology2000;47:1590–4.
13. Yuste AL, Aparicio J, Segura A, et al. Analysis of clinical prognostic factors for survival and time to progression in patients with metastatic colorec-tal cancer treated with 5-fluorouracil-based che-motherapy.Clin Colorectal Cancer2003;2:231–4. 14. J€urgensmeier JM, Schmoll H-J, Robertson JD,
et al. Prognostic and predictive value of VEGF,
sVEGFR-2 and CEA in mCRC studies comparing cediranib, bevacizumab and chemotherapy.Br J Cancer2013;108:1316–23.
15. Petrioli R, Licchetta A, Roviello G, et al. CEA and CA19.9 as early predictors of progression in advanced/metastatic colorectal cancer patients receiving oxaliplatin-based chemotherapy and bevacizumab.Cancer Invest2012;30:65–71. 16. Eisenhauer EA, Therasse P, Bogaerts J, et al. New
response evaluation criteria in solid tumours: revised RECIST guideline (version 1.1).Eur J Cancer2009;45:228–47.
17. Heinemann V, Stintzing S, Modest DP, et al. Ear-ly tumour shrinkage (ETS) and depth of response (DpR) in the treatment of patients with metastat-ic colorectal cancer (mCRC).Eur J Cancer2015; 51:1927–36.
18. Sidransky D, Tokino T, Hamilton SR, et al. Iden-tification of ras oncogene mutations in the stool of patients with curable colorectal tumors.Science
1992;256:102–5.
19. Anker P, Lefort F, Vasioukhin V, et al. K-ras mutations are found in DNA extracted from the plasma of patients with colorectal cancer. Gastro-enterology1997;112:1114–20.
20. Hibi K, Robinson CR, Booker S, et al. Molecular detection of genetic alterations in the serum of colorectal cancer patients.Cancer Res1998;58: 1405–7.
21. Grady WM, Rajput A, Lutterbaugh JD, et al. Detection of aberrantly methylated hMLH1 pro-moter DNA in the serum of patients with micro-satellite unstable colon cancer.Cancer Res2001; 61:900–2.
22. Leung WK, To K-F, Man EPS, et al. Quantitative detection of promoter hypermethylation in multi-ple genes in the serum of patients with colorectal cancer.Am J Gastroenterol2005;100:2274–9. 23. Nakayama H, Hibi K, Taguchi M, et al.
Molecu-lar detection of p16 promoter methylation in the serum of colorectal cancer patients.Cancer Lett
2002;188:115–9.
24. Lenhard K, Bommer GT, Asutay S, et al. Analysis of promoter methylation in stool: a novel method for the detection of colorectal cancer.Clin Gas-troenterol Hepatol2005;3:142–9.
25. Toyota M, Ahuja N, Ohe-Toyota M, et al. CpG island methylator phenotype in colorectal cancer.
Proc Natl Acad Sci U S A1999;96:8681–6. 26. Issa J-P. CpG island methylator phenotype in
cancer.Nat Rev Cancer2004;4:988–93. 27. Weisenberger DJ, Siegmund KD, Campan M,
et al. CpG island methylator phenotype underlies sporadic microsatellite instability and is tightly associated with BRAF mutation in colorectal can-cer.Nat Genet2006;38:787–93.
28. Toyota M, Ho C, Ahuja N, et al. Identification of differentially methylated sequences in colorectal cancer by methylated CpG island amplification.
Cancer Res1999;59:2307–12.
29. Baylin SB, Herman JG, Graff JR, et al. Alterations in DNA methylation: a fundamental aspect of neoplasia.Adv Cancer Res1998;72:141–96. 30. Maeda K, Kawakami K, Ishida Y, et al.
Hyperme-thylation of the CDKN2A gene in colorectal can-cer is associated with shorter survival.Oncol Rep
2003;10:935–8.
31. Hiranuma C, Kawakami K, Oyama K, et al. Hypermethylation of the MYOD1 gene is a novel prognostic factor in patients with colorectal can-cer.Int J Mol Med2004;13:413–7.
32. Umetani N, Takeuchi H, Fujimoto A, et al. Epi-genetic inactivation of ID4 in colorectal carcino-mas correlates with poor differentiation and unfavorable prognosis.Clin Cancer Res2004;10: 7475–83.
33. Philipp AB, Stieber P, Nagel D, et al. Prognostic role of methylated free circulating DNA in colo-rectal cancer.Int J Cancer2012;131:2308–19. 34. Van Rijnsoever M, Elsaleh H, Joseph D, et al.
CpG island methylator phenotype is an indepen-dent predictor of survival benefit from 5-fluorouracil in stage III colorectal cancer.Clin Cancer Res2003;9:2898–903.
35. Shen L, Catalano PJ, Benson AB, et al. Associa-tion between DNA methylaAssocia-tion and shortened survival in patients with advanced colorectal can-cer treated with 5-fluorouracil based chemothera-py.Clin Cancer Res2007;13:6093–8.
36. Young J, Biden KG, Simms LA, et al. HPP1: a transmembrane protein-encoding gene commonly methylated in colorectal polyps and cancers.Proc Natl Acad Sci U S A2001;98:265–70.
37. Ebert MPA, Mooney SH, Tonnes-Priddy L, et al. Hypermethylation of the TPEF/HPP1 gene in pri-mary and metastatic colorectal cancers.Neoplasia
2005;7:771–8.
38. Chen TR, Wang P, Carroll LK, et al. Generation and characterization of Tmeff2 mutant mice. Bio-chem Biophys Res Commun2012;425:189–94. 39. Elahi A, Zhang L, Yeatman TJ, et al.
HPP1-medi-ated tumor suppression requires activation of STAT1 pathways.Int J Cancer2008;122:1567–72. 40. Wallner M, Herbst A, Behrens A, et al. Methyla-tion of serum DNA is an independent prognostic marker in colorectal cancer.Clin Cancer Res
2006;12:7347–52.
41. Herbst A, Wallner M, Rahmig K, et al. Methyla-tion of helicase-like transcripMethyla-tion factor in serum of patients with colorectal cancer is an indepen-dent predictor of disease recurrence.Eur J Gas-troenterol Hepatol2009;21:565–9.
Tumor
Markers
and
42. Philipp AB, Nagel D, Stieber P, et al. Circulating cell-free methylated DNA and lactate dehydroge-nase release in colorectal cancer.BMC Cancer
2014;14:245.
43. Hegewisch-Becker S, Graeven U, Lerchenm€uller CA, et al. Maintenance strategies after first-line oxaliplatin plus fluoropyrimidine plus bevacizumab for patients with metastatic colorectal cancer (AIO 0207): a rand-omised, non-inferiority, open-label, phase 3 trial.
Lancet Oncol2015;16:1355–69.
44. Eads CA, Danenberg KD, Kawakami K, et al. MethyLight: a high-throughput assay to measure DNA methylation.Nucleic Acids Res2000;28:E32.
45. Pepe MS. The statistical evaluation of medical tests for classification and prediction. Oxford: Oxford University Press, 2004.
46. Dawson S-J, Tsui DWY, Murtaza M, et al. Analysis of circulating tumor DNA to monitor metastatic breast cancer.N Engl J Med2013;368: 1199–209.
47. Murtaza M, Dawson S-J, Tsui DWY, et al. Non-invasive analysis of acquired resistance to cancer therapy by sequencing of plasma DNA.Nature
2013;497:108–12.
48. Tie J, Kinde I, Wang Y, et al. Circulating tumor DNA as an early marker of therapeutic response
in patients with metastatic colorectal cancer.Ann Oncol2015;26:1715–22.
49. Hansen TF, Carlsen AL, Heegaard NHH, et al. Changes in circulating microRNA-126 during treatment with chemotherapy and bevacizumab predicts treatment response in patients with metastatic colorectal cancer.Br J Cancer2015; 112:624–9.
50. Barbazan J, Muinelo-Romay L, Vieito M, et al. A multimarker panel for circulating tumor cells detection predicts patient outcome and therapy response in metastatic colorectal cancer.Int J Cancer2014;135:2633–43.