w w w . e l s e v i e r . c o m / l o c a t e / b j i d
The Brazilian Journal of
INFECTIOUS DISEASES
Original article
One-step real-time PCR assay for detection and
quantification of RNA HCV to monitor patients
under treatment in Brazil
Elisabete Andrade
a,b, Daniele Rocha
a, Marcela Fontana-Maurell
a, Elaine Costa
a,
Marisa Ribeiro
a, Daniela Tupy de Godoy
a, Antonio G.P. Ferreira
a, Amilcar Tanuri
b,
Patrícia Alvarez
a,∗, Rodrigo Brindeiro
baFundac¸ão Oswaldo Cruz (Fiocruz), Instituto de Tecnologia em Imunobiológicos Bio-Manguinhos, Rio de Janeiro, RJ, Brazil bUniversidade Federal do Rio de Janeiro (UFRJ), Rio de Janeiro, RJ, Brazil
a r t i c l e
i n f o
Article history: Received 4 May 2018 Accepted 16 August 2018
Available online 20 September 2018
Keywords: HCV Viral load Real time PCR Monitoring patients
a b s t r a c t
The Brazilian Public Health Service provides pegylated alfa-interferon free-of-charge to treat patients infected with HCV. The primary goal of HCV therapy is the long-term elimination of HCV from the blood to reduce the risk of HCV associated complications and death. Patient viremia affects treatment duration and response, thus influencing clinical decisions. We developed a high-throughput method to perform the quantification of RNA hepatitis C virus virus load in plasma samples to monitor patients under treatment. The method is based on a duplex detection, in a one-step real-time RT-PCR assay which has been validated accord-ing to the rules established by the official Brazilian regulatory agency (ANVISA). This new method was compared to a commercial kit (Cobas/Taqman HCV Test v2.0 – Roche), showing virus load results with significant correlation between them (p= 0.012) using commercial and clinical panels. In addition, 611 samples from patients treated with␣PEG-IFN from dif-ferent regions of Brazil were analyzed. Our one-step real-time RT-PCR assay demonstrated good performance in viral load measurement and in treatment course monitoring, with acceptable sensitivity and specificity values.
© 2018 Sociedade Brasileira de Infectologia. Published by Elsevier Editora Ltda. This is an open access article under the CC BY-NC-ND license (http://creativecommons.org/licenses/ by-nc-nd/4.0/).
Introduction
Hepatitis C virus (HCV) belongs to the familyFlaviviridae, genus Hepacivirus. HCV infection is one of the major causes of chronic liver disease and an important health problem worldwide.
∗ Corresponding author.
E-mail address:[email protected](P. Alvarez).
According to recent estimates, 71 million people have chronic hepatitis C infection around the world, of whom 399 thousand die each year from HCV-related liver diseases, which include liver cirrhosis and hepatocellular carcinoma.1,2The hepatitis
C virus is a blood borne virus and the most common routes of infection are: (a) unsafe drug injection practices; (b) inade-quate sterilization of medical equipment; and (c) transfusion
of unscreened blood and/or blood products.2
There is great genetic heterogeneity among the different strains of HCV, with at least six classical HCV genotypes
https://doi.org/10.1016/j.bjid.2018.08.003
identified across the world.3–5 Genotype 1–3 is distributed
worldwide, while genotypes 4 and 5 are found mainly in Africa and genotype 6 is found primarily in Asia.6In Brazil, genotypes
1, 2, 3, 4, and 5 are present, but genotype 1 is the most
preva-lent in different country regions.7 HCV genotype variation
is an important factor for management of infected patients once it is associated with different responses to pegylated alfa-interferon (␣PEG-IFN) based anti-HCV treatment. Patient viremia is also a factor that affects treatment duration and response, thus influencing the antiviral regimen decision in clinical studies. It has been shown that patients infected with genotype 1 and 6 tend to have viral loads higher than those infected with genotype 2 or 38,9and this can impact the rate
of sustained virological response (SVR) to therapy.
The Brazilian Public Health Service provides␣PEG-IFN free-of-charge to treat patients infected with HCV. The primary goal of HCV therapy is the long-term elimination of HCV from the blood, which prevents hepatic cirrhosis, hepatocellular carcinoma (HCC), and severe extra-hepatic manifestations. In addition, it reduces the risk of HCV associated complications and death.10,11
SVR to treatment is defined as undetectable HCV RNA after 12 weeks (SVR12) or 24 weeks (SVR24) of treatment
completion.9,12Predicting the outcome of patients with HCV
infection who have been treated has been a challenging task. In this way, it is important to understand the natural history of the hepatitis C virus infection and the nature of resistance to interferon-␣therapy.13,14Long-term follow-up studies have shown that a SVR in more than 95% of cases may represent a cure from HCV infection.15
We describe herein the development and validation, according to the rules established by the official Brazilian reg-ulatory agency (ANVISA), of a complete analytical assay for the detection and quantification of HCV RNA (viral load) in human plasma specimens based on reverse transcription (RT) coupled real-time PCR. Additionally, a clinical evaluation was performed, through the virological response, of 611 patients treated with␣PEG-IFN.
Materials and methods
Samples
Samples from 611 patients with chronic hepatitis C infection, attending public hospitals in south, southeast, and northeast regions of Brazil were used in this study, during 2013. We did a longitudinal, prospective analysis for virologic success (based on viral load assay) of sustained response to treatment (viral load undetectability) after 12 and 24 weeks of treatment
initiation with ␣PEG-IFN monotherapy. Whole blood
speci-mens were collected when patient first arrived at the hospital seeking treatment and during the weeks 4, 8, 12 and 24 of
treatment with␣PEG-IFN monotherapy. The specimens were
collected in sterile Vacutainer PPT tubes (BD); centrifuged 10 minutes at 2400×gand stored at−80◦C until isolation of RNA. Plasma samples were used to determine pre-treatment and on-treatment viral loads. The present study was con-ducted in accordance with the provisions of the declaration
of Helsinki and Good Clinical Practice guidelines, approved by Ethical Committee in Research (IRB approval # GPPG 09581).
Commercial International Panels
A standard reference panel was calibrated against the WHO 3rd Hepatitis C Virus (HCV) RNA International Stan-dard (NIBSC 06/100), containing plasma with genotype 1a HCV. The material was calibrated in an international collaborative study involving 33 laboratories, yielding a
consensus viral load of 154.88 IU mL−1. Using this
cal-ibrated specimen a secondary panel of concentrations of 1.9E + 03 IU mL−1, 9.6E + 02 IU mL−1, 4.8E + 02 IU mL−1,
2.4E + 02 IU mL−1, 1.2E + 02 IU mL−1, 6.0E + 01 IU mL−1 and
3.0E + 01 IU mL−1 was developed. All dilutions of this panel
were made in negative human plasma.
Virus-like particle from internal control and standard curve
The internal control (IC) is a virus-like particle (VLP) that mimics HIV virions. It is biosafe because it does not have the envelope proteins from HIV virus responsible for the interaction with CD4 molecule. Thus, this VLP has no abil-ity to replicate. The IC aims to control all steps of RNA extraction, purification, detection, and quantification without cross-reacting with the detection of HCV RNA possibly present in the plasma.
The standard curve of quantitative calibration was per-formed with another VLP derived from the HIV genome
backbone with an insertion of the 5′UTR fragment from HCV
genome at theenvgene of HIV, with this non-infective hybrid
HCV 5′UTR – HIV VLP which allows biosafe handling as
posi-tive control for both viruses (VLP HIV/5′UTR HCV). Both VLPs are protected by patent PI0600715-5.16
RNA extraction
A molecular biology workstation (BioRobot MDx, Qiagen) using the QIAamp one-for-all nucleic acid kit (Qiagen) was used to isolate HCV RNA from patients’ samples, according to the
manufacturer’s instruction. RNA was extracted from 530L
plasma and eluted in 65L elution buffer. The IC was added to each sample before extraction (11.3L) in a fixed concentra-tion to reach real-time PCR detecconcentra-tion cycle threshold (Ct) = 33. For HCV quantification by COBAS/Taqman HCV Test v2.0 (Roche), RNA was isolated with the High Pure System Viral Acid Kit (Roche), according to the manufacturer’s instruction.
Real-time RT-PCR amplification
The real-time RT-PCR reaction set-up was carried out using an automated workstation (Janus, PerkinElmer). HCV detec-tion was performed by a duplex, one-step, real-time RT-PCR,
in a 50L total volume reaction, with 1x PCR mix
dye at its 5′end and a NFQ dark quencher (Thermo Fisher Sci-entific) at its 3′end, together with a MGB DNA clamp (Thermo Fisher Scientific).
The standard curve is composed by three standards with different viral loads: standard P1 with high viral
load (2E + 06 IU mL−1), standard P2 with medium viral load
(2E + 04 IU mL−1), and standard P3 with a low viral load
(2E + 02 IU mL−1).
The amplification was performed on the Life technologies 7500 real-time PCR system (Thermo Fisher Scientific). The PCR thermal profile consisted in an initial incubation for 30 min at 51◦C, a second step of 10 min at 95◦C, followed by 50 cycles of 30 s at 95◦C and 1 min at 60◦C. Fluorescence signal detec-tion was performed at annealing/extension step of each cycle. Threshold value were defined based on the limit of detection assay with the WHO 3rd Hepatitis C Virus (HCV) RNA Inter-national Standard (NIBSC). The threshold value for the IC was set at 0.3 and it was set at 0.2 to clinical samples and standard curves.
Validation of the real-time RT-PCR assay
Validation of duplex, one-step, real-time RT-PCR assay was performed in accordance to the Brazilian Health
Regula-tory Agency (ANVISA) resolution RDC No. 27/2012(http://
bvsms.saude.gov.br/bvs/saudelegis/anvisa/2012/rdc0027 17 05 2012.html) and 166/2017 (old 899/2003) (https://www20. anvisa.gov.br/coifa/pdf/rdc166.pdf) that regulates the validation of diagnostic tests in medicine.
Limit of detection (LOD) or sensitivity of the assay was determined by using the standard reference panel with pre-defined viral loads (1.9E + 03 IU mL−1, 9.6E + 02 IU mL−1,
4.8E + 02 IU mL−1, 2.4E + 02 IU mL−1, 1.2E + 02 IU mL−1,
6.0E + 01 IU mL−1 and 3.0E + 01 IU mL−1) using commercial
kit COBAS/Taqman HCV Test v2.0. Each dilution was tested in batches of eight replicates. HCV virus concentrations were log10-transformed for analysis. We examined the linear range
by comparing plotted data to a line of equality. Calculated correlation coefficient and linear regression analyses were performed on scatter plots of log-transformed HCV RNA levels using Microsoft Excel (Microsoft Corp.).
Precision of the assay was assessed by testing six different concentrations of HCV RNA (5E + 06 IU mL−1; 1E+ IU mL−1;
3E + 03 IU mL−1; 1.5E + 02 IU mL−1; 6E + 01 IU mL−1 and
3E + 01 IU mL−1), in batches of eight replicates (intra-assay
variability), in three different days (inter-assay variability), followed by statistical calculation of standard deviations (SD) of the mean and confidence intervals of 95%.
A total of 17 clinical samples, positive to HCV RNA, pre-viously characterized by the commercial kit COBAS/Taqman HCV Test v2.0, were submitted to the accuracy assay. The quantification performance of our assay was determined comparing the one-step RT-PCR results with the results obtained by the commercial kit COBAS/Taqman HCV Test v2.0. All operations steps were carried out according to
instruc-tions provided by the manufacturer. Student’st-test and the
Pearson’s correlation regression (withp= 0.05) were used to
compare HCV RNA quantifications by the two methods. The calibration verification was performed at least three times. Calibration assay tested: (i) one true positive HCV
RNA sample with eight different viral loads ranging from 4.53E + 06 IU mL−1 to 6E + 01 IU mL−1; (ii) eight samples true
negative; (iii) eight replicates of an HCV RNA positive sample with viral load adjusted to 104IU mL−1; (iv) negative control
in duplicates, and (v) three points of the standard curve in duplicates. The IC results were evaluated in all negative sam-ples. The criteria to accept the standard curve to P1 – high VL (2E + 06 IU mL−1) was a Ct value of 21±0.6, to P2 – medium VL
(2E + 04 IU mL−1) was a Ct value of 27±0.6 and to P3 – low VL
(2E + 02 IU mL−1) was a Ct value of 33±0.6.
Evaluation of the robustness of our duplex, one-step, real-time RT-PCR assay in the presence of interfering substances was done with the commercial kit OptiChallenge Inhibition Panel (Acrometrix). Negative human plasma, as well as plasma samples spiked with HCV were tested in the presence of EDTA plasma, hemolyzed plasma, heparin plasma, triglyc-erides, and bilirubin. Each interfering substance were tested individually.
The HCV genotype panel (HCV RNA Genotype AccuTrak Qualification Panel, Seracare) was also used for the evaluation of the HCV real-time PCR assay. This panel is composed by nine samples of genotypes 1–6 (1a, 1b, 2a/c, 2b, 3a, 4a, 5a, 6 and NTC) of HCV with titers ranging from 1.62E + 04 to 1.85E + 05 IU/mL (as determined by Roche AmpliPrep/COBAS TaqMan HCV v2.0 kit).
Genotyping
The Linear Array HCV Genotyping Test (Roche) was used to determine the genotype (1–6) of each HCV sample from patients, according to the manufacturer’s instruction.
Results
Development of a duplex one-step real-time RT-PCR for HCV and internal control detection
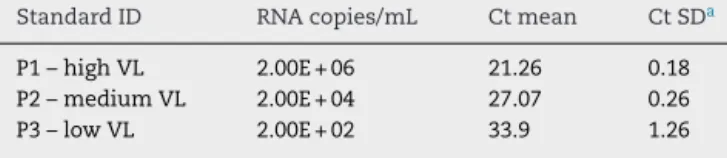
Our one-step real-time RT-PCR assay, named BioM HCV VL test, was designed to perform 88 tests in a 96-well plate. The assay contains a negative control and the VLP standard curve, consisting of standard 1 (P1), standard 2 (P2), and standard 3 (P3) samples in duplicates (Table 1). Each standard is made
with adjusted concentration of the hybrid VLP HIV/5′UTR HCV
corresponding to 2E + 06, 2E + 04 and 2E + 02, respectively. The IC is added to all samples tested and to the negative control. IC guarantees the quality control of the whole process, from RNA extraction to target amplification and quantification. The
Table 1 – Ct values obtained for kit standards, P1 – high viral load, P2 – medium viral load and P3 – low viral load, in duplicates from three assay runs (six replicates/each).
Standard ID RNA copies/mL Ct mean Ct SDa
P1 – high VL 2.00E + 06 21.26 0.18
P2 – medium VL 2.00E + 04 27.07 0.26
P3 – low VL 2.00E + 02 33.9 1.26
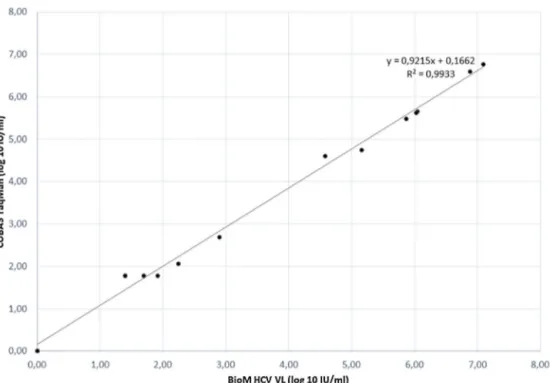
Fig. 1 – Correlation plot of results obtained from VL assays of BioM HCV VL Test and Roche’s COBAS Taqman HCV Test v2.0.
overall procedure is completed in six hours in an automated system avoiding contamination.
No false positive result was detected when testing neg-ative plasma samples occasionally contained interfering substances, such as EDTA, hemolysis, heparin, triglycerides, or bilirubin (Table S1). However, heparin inhibited the target and the IC amplification.
Quantification by one-step real-time RT-PCR assay
The LOD of our one-step real-time RT-PCR assay for detec-tion was 77 IU mL−1(136.12 IU mL−1> CI
95> 57.62 IU mL−1). The
lower limit of quantification was the lowest concentration in the linear range that met the criteria for variability and was set at 60 IU mL−1. The coefficient of variation (CV) of the
calibra-tion curve (Table S2) was found to be between 0.22% and 9.29%, according to HCV RNA concentration. The standard curve P1, P2, and P3 fit the criteria of acceptance in all assays. Precision of the assay (Table S3) was found to be between 0.51% to 9.88% intra-assay and CV 0.3% to 13.52% inter-assay, depending on the viral load measured.
The correlation between HCV RNA quantification with our BioM HCV VL test and COBAS/Taqman HCV Test v2.0 was evaluated on 17 samples, previously quantified with COBAS/Taqman HCV Test v2.0. The correlation plot of results is presented inFig. 1. The regression curve showed a
signifi-cantR2value of 0.9933 and the observed relationship showed
that results obtained from both tests were equivalent in dif-ferent virus load range (p= 0.012).
HCV genotype detection
HCV genotypes 1, 2, 3, 4, 5 and 6, from the HCV RNA genotype performance panel (HCV RNA Genotype AccuTrak
Qualifica-Table 2 – Distribution of HCV genotypes in Brazilian regions.
HCV genotype Brazilian regions Brazil
South Southeast Northeast
1 231 60 6 297 (48.61%)
2 59 6 1 66 (10.80%)
3 224 12 12 248 (40.51%)
tion Panel 2400-0182, Seracare) were successfully detected and quantified by BioM HCV VL Test (Table S4), with Ct values ranging from 25 to 34, which falls in the range of detection of our kit.
Monitoring patients
HCV genotype assessment for clinical samples
In order to evaluate the impact of HCV genotyping on the clinical performance of BioM HCV VL, 611 HCV RNA positive samples from patients under treatment (see item 2.1 in Mate-rial and Methods for more details) were subjected to genotype determination. The analysis revealed the presence of geno-types 1, 2 and 3. Genotype 1 was detected in 297 (48.61%) patients, genotype 2 in 66 (10.8%) patients, and genotype 3 in 248 (40.51%) patients. Cases with mixed genotype infec-tion were not found.Table 2 shows the distribution of HCV genotype in each region of Brazil.
Clinical evaluation through virological response to treatment
In order to evaluate the virological response on 611 patients under treatment, the viral load of HCV was performed on weeks 4, 8, 12, and 24 of treatment, to calculate the SVR.Table 3
Table 3 – Virological response to␣PEG-IFN according to HCV genotype.
VR Genotype 1 (%) Genotype 2 (%) Genotype 3 (%)
Early sustained virological response (SVR 12) 128 (43.24%) 60 (90.9%) 208 (83.87%) Sustained virological response (SVR 24) 120 (40.54%) 6 (9.09%) 32 (12.9%)
Nonresponder 48 (16.21%) 0 8 (3.22%)
1 presented 43.24% and 40.54% of SVR12 and SVR24, respec-tively; 16.21% were non-responders. Patients infected with HCV genotype 2 presented 90.9% and 9.09% of SVR 12 and SVR 24, respectively; there no non-responders. In addition, those infected with HCV genotype 3 presented 83.87% and 12.9% of SVR12 and SVR 24, respectively; 3.22% were non-responders. Genotype 1 had significantly more non-responders than geno-types 2 and 3 (p< 0.05).
It was verified that people with genotype 3 had a higher SVR12, while those of genotype 1 had a higher SVR24.
Regarding genotype 2, 90.9% presented SVR12), but since the number of patients with this genotype was very small, no statistical comparisons with the other groups were under-taken.
Discussion
Detection of hepatitis C virus and its quantification in human plasma are required steps to be taken before patients can be treated and monitored. Using an approach that carries good analytical performance, has high-throughput capacity while keeping the cost low is no doubt the preferred option. Herein, we successfully developed and validated a one-step, duplex, real-time RT-PCR assay for detection and quantification of HCV RNA, in a single tube, with an internal amplification control. It takes about six hours to complete HCV RNA quantification for 88 different samples fitted in a 96-well plate with standard curve and negative control. The results obtained by our assay were linear and reproducible. The robustness of the test was demonstrated by the reproducibility study inter-lot and also intra-lot. Heparin was the only interfering substance observed to inhibit the target amplification. It is well known that heparin inhibit DNA polymerase activity in PCR and real-time PCR.17,18
The relationship observed from HCV RNA quantification of our BioM HCV VL and COBAS/Taqman HCV Test v.2.0, showed that both tests are equivalent and the correlation between the methods is lower than 0.4 log IU mL−1that is the average value
of mean differences between commercially available assays for HCV RNA quantification.
The LOD of our assay is in accordance with the test spec-ification and with the limits recommended by the Brazilian Ministry of Health for HCV RNA quantification for monitor-ing patients under treatment. However, if we compare the 95% LOD from BioM HCV VL assay with two other commer-cial assays, such as COBAS AmpliPrep/COBAS TaqMan HCV Test and The Abbott RealTime HCV assay our results are less sensitive.
In the present study, HCV genotype 1 was the most com-mon, followed by genotype 3, and type 2. In our study, HCV genotypes 4, 5 and 6 were not detected. Previous data about HCV genotypes in Brazil found types 1, 2, 3, 4 and 5. In all regions genotype 1 was the most frequent, whereas type 4
and 5 were rare.7,19–21The similarities between the pattern of
HCV genotypes distribution in Brazil and that found in many European countries have been pointed out. In both cases types 1 and 3 are prevalent and share the same epidemiological behavior with characteristics of an exponential spread that has taken place in recent years, most likely through blood
transfusion.7The HCV genotype distribution has been studied
in some European countries, Japan, and in the United States. In all cases, genotype 1 is the most frequently found.21
The natural history of HCV genotypes 1, 2 and 3 seems to be similar, with patients having a high risk of developing liver cir-rhosis and hepatocellular carcinoma. Moreover, genotype 3 is found to be associated with an increase in hepatic steatosis.22
Reports on the relationship between the histological degree of inflammation, the biochemical marker of inflammation ala-nine transaminase (ALT), and levels of serum HCV RNA are still controversial.8,23 In the present study, viral load
quan-tification was compared between the three genotype groups. After 12 weeks of treatment, the average level of viral load in patients infected by genotype 2 was significantly higher compared to that of patients infected with genotypes 1 and 3. However, after 24 weeks, no patient infected with genotype 2 had detectable viral load (data not shown). In fact, HCV geno-type 1 infection is described as the most difficult genogeno-type to
treat with␣PEG-IFN-based therapy, with low SVR rates.
Con-versely, genotypes 2 and 3 HCV infected patients have higher SVR rates.24In this study, patients infected with genotype 1
had a higher rate of nonresponders (16.21%), in relation to genotype 3 (3.22%), and consequently patients infected with genotype 3 presented better early virological response perfor-mance (83.87%) (Table 3).
BioM HCV VL test demonstrated good performance in viral load measurement and in treatment course monitoring, with similar sensitivity and specificity values as compared to another commercial method. Once our assay receives its reg-istration, it will likely be introduced into laboratories of public health in Brazil and will be used to evaluate de kinetics of viral load from patients on treatment to achieve better response to treatment.
In conclusion, our BioM HCV VL test proved to be suit-able for monitoring patients with chronic HCV infection on antiviral treatment.
Conflicts of interest
The authors declare no conflicts of interest.
Funding
Acknowledgements
Many thanks to Clinical Advice of Bio-Manguinhos (ASCLIN) and FIOCRUZ.
Appendix A. Supplementary data
Supplementary data associated with this article can be
found, in the online version, at https://doi.org/10.1016/
j.bjid.2018.08.003.
r e f e r e n c e s
1. Kretzer IF, Livramento A, Cunha J, et al. Hepatitis C worldwide and in Brazil: silent epidemic – data on disease including incidence, transmission, prevention, and treatment. Sci world J. 2014. ID 827849.
2. WHO. World Health Organization. Hepatitis C. Fact sheet; 2017.http://www.who.int/mediacentre/factsheets/fs164/en/
[accessed July, 2017].
3. Zein NN, Persing D. Hepatitis C genotypes: current trends and future implications. Mayo Clin Proc. 1996;71:458–62.
4. Smith DB, Bukh J, Merhoff AS, Rice CM, Stapleton JT, Simmonds P. Expanded classification of hepatitis C virus into 7 genotypes and 67 subtypes: updated criteria and genotype assignment web resource. Hepatology. 2014;59:318–27. 5. Athar MA, Xu Y, Xie X, et al. Rapid detection of HCV
genotyping 1a, 1b, 2a, 3a, 3b and 6a in a single reaction using two-melting temperature codes by real time PCR-based assay. J Virol Methods. 2015;222:85–90.
6. Nguyen MH, Keefe EB. Chronic hepatitis C: genotypes 4 to 9. Clin Liver Dis. 2005;9:411–26.
7. Campiotto S, Pinho JRR, Carrilho FJ, et al. Geographic distribution of hepatitis C virus genotypes in Brazil. Braz J Med Biol Res. 2005;38:41–9.
8. Chakravarti A, Dogra G, Verma V, Srivastava AP. Distribution pattern of HCV genotypes & its association with viral load. Indian J Med Res. 2011;133:326–31.
9. EASL. European Association for the Study of the Liver. EASL Recommendations on treatment of hepatitis C 2015. J Hepatol. 2015;63:199–236.
10. Ghany MG, Strader DB, Thomas DL, Seeff LB. American association for the Study of Liver Disease. Diagnosis, management, and treatment of hepatitis C: an update. Hepatology. 2009;49:1335–74.
11. EASL. European Association for the Study of the Liver. EASL Recommendations on treatment of hepatitis C 2016. J Hepatol. 2017;66:153–94.
12. Conteduca V, Sansonno D, Russi S, Pavone F, Dammacco F. Therapy of chronic hepatitis C virus infection in the era of direct-acting and host-targeting antiviral agents. J Infect. 2014;68:1–20.
13. Navaneethan U, Kemmer N, Guy W. Predicting the probable outcome of treatment in HCV patients. Ther Adv
Gastroenterol. 2009;2:287–302.
14. Rong X, Lu L, Wang J, et al. Correlation of viral loads with HCV genotypes: higher levels of virus were revealed among blood donors infected with 6a strains. PLoS ONE. 2012;7:
e52467.
15. Heim MH. 25 years of interferon-based treatment of chronic hepatitis C: an epoch coming to an end. Nat Rev Immunol. 2013;13:535–42.
16. PI0600715-5 – Brindeiro PAB, Brindeiro RM, Tanuri A, Ferreira AGP, Ferreira JAS. Virus Calibrador Bioseguro/HIV; 2006. 17. Wang JT, Wang TH, Sheu JC, Lin SM, Lin JT, Chen DS. Effects of
anticoagulants and storage of blood samples on efficacy of the polymerase chain reaction assay for hepatitis C virus. J Clin Microbiol. 1992;30:750–3.
18. Willems M, Moshage H, Nevens F, Fevery J, Yap SH. Plasma collected from heparinized blood is not suitable for HCV-RNA detection by conventional RT-PCR assay. J Virol Methods. 1993;42:127–30.
19. Zarife MAS, Oliveira ECP, Romeu JMSL, Reis MG. Detecc¸ão do genótipo 4 do vírus da hepatite C em Salvador, Bahia. R Soc Bras Med Trop. 2006;39:567–9.
20. Gonzaga RMS, Rodart IF, Reis MG, Neto CER, Silva DW. Distribution of hepatitis C virus (HCV) genotypes in seropositive patients in the state of Alagoas, Brazil. Braz J Microb. 2008;39:644–7.
21. Petruzziello A, Marigliano S, Loquercio G, Cozzolino A, Cacciapuoti C. Global epidemiology of hepatitis C virus infection: an up-date of the distribution and circulation of hepatitis C virus genotypes. World J Gastroenterol. 2016;22:7824–40.
22. Tapper EB, Afdhal NH. Is 3 the new 1: perspectives on virology, natural history and treatment for hepatitis C genotype 3. J Viral Hepatol. 2013;20:669–77.
23. Bhattacharjee D, Mukherjee K, Chakroborti G, Ghosh R, Mandal N, Bose M. Correlation study between HCV genotypes distribution pattern and viral load in a tertiary care hospital in Kolkata, India. J Clin Diagn Res. 2015;9:DC15–7.