IN-CLOUD AND BELOW-CLOUD SCAVENGING ANALYSIS OF SULFATE IN THE
METROPOLITAN AREA OF SÃO PAULO, BRAZIL
F. L. T. GONÇALVES
1, W. N. MORINOBU, M. F. ANDRADE
2& A. FORNARO
21, 2
University of São Paulo (IAG-USP), Department of Atmospheric Sciences.
Rua do Matão, 1226, 05508-900, São Paulo, Brazil
1
Corresponding author: e-mail [email protected]
Received July 2005 - Accepted November 2005
ABSTRACT
The Metropolitan Area of São Paulo (MASP) is one of the largest urban centers in the world. The VLJQL¿FDQW DWPRVSKHULF FRQFHQWUDWLRQV RI R]RQH LQKDODEOH SDUWLFOHV DQG RWKHU SROOXWDQWV LQ WKH MASP raise serious air-quality concerns. In this study, we consider gases, particulate matter (PM) and cloud processes, with a focus on sulfate chemistry. The Regional Atmospheric Modeling System mesoscale numerical model was used in conjunction with detailed scavenging models to compare varying PM mass spectra and size distributions. Field data were collected during the July 1989-May DQG)HEUXDU\2FWREHUFDPSDLJQV$GMXVWHGXUEDQDQGUXUDOVSHFWUDVHHPWR¿WEHWWHUZLWK observed results which improved the scavenging numerical modeling. Correlations between modeled and observed concentrations were better when the model included rural and adjusted-urban spectra, suggesting locally dominant below-cloud scavenging. Spatial variability analysis and numerical modeling also revealed that the varying sulfate rainwater concentrations indicate below-cloud removal process dominance.
Keywords: air pollution, sulfur compounds, numerical modeling, scavenging processes, rainwater chemistry.
RESUMO:ANÁLISE DOS PROCESSOS DE REMOÇÃO DE SULFATO DENTRO E ABAIXOANÁLISE DOS PROCESSOS DE REMOÇÃO DE SULFATO DENTRO E ABAIXO DA NUVEM NA REGIÃO METROPOLITANA DE SÃO PAULO, BRASIL .
A região metropolitana da cidade de São Paulo (RMSP) é uma das maiores aglomerados urbanos do PXQGR6LJQL¿FDWLYDVFRQFHQWUDo}HVDWPRVIpULFDVGHR]{QLRSDUWtFXODVLQDOiYHLVHRXWURVSROXHQWHV na RMSP aumentam seriamente a qualidade do ar. Neste estudo, nos consideramos os gases, material SDUWLFXODGR30HSURFHVVRVIRUPDGRUHVGHQXYHQVFRPIRFRQDTXtPLFDGRVXOIDWR2PRGHOR numérico de mesoscala RAMS (Regional Atmospheric Modeling System) foi usado, em conjunto DXPPRGHORGHWDOKDGRGHUHPRomRSDUDFRPSDUDUGLIHUHQWHVHVSHFWURVGR30HGLVWULEXLo}HVGH tamanho. Dados observados foram coletados durante os meses de Julho de 1989 a maio de 1990 e entre fevereiro e outubro de 2000. Espectros urbano-ajustado e rural parecem ter melhor ajuste aos GDGRVREVHUYDGRVFRPFRQVHTHQWHDYDQoRQDPRGHODJHPQXPpULFDGRVSURFHVVRVGHUHPRomR &RUUHODo}HVHQWUHFRQFHQWUDo}HVPRGHODGRVHREVHUYDGRVIRUDPPHOKRUDGDVTXDQGRRHVSHFWURHUD RUXUDOHRXUEDQRDMXVWDGRVXJHULQGRXPDGRPLQkQFLDORFDOHDUHPRomRDEDL[RGDQXYHP$QiOLVHV GDPRGHODJHPQXPpULFDLJXDOPHQWHPRVWUDUDPTXHDVYDULDo}HVQDVFRQFHQWUDo}HVGHVXOIDWRHP iJXDGHFKXYDLQGLFDPXPDGRPLQkQFLDGRVSURFHVVRVDEDL[RGDQXYHP
1. INTRODUCTION
Most current knowledge on acid deposition was GHYHORSHG LQ WKH V DQG V GXULQJ ZKLFK H[WHQVLYH studies by both American and European researchers from various VFLHQWL¿F¿HOGVGHPRQVWUDWHGWKDWDFLGUDLQLVWKHHQGUHVXOWRI FRPSOH[FKHPLFDODQGSK\VLFDOLQWHUDFWLRQVRISROOXWDQWVLQ the atmosphere (Cowling, 1982). In the atmosphere, sulfur DQGQLWURJHQFRPSRXQGVFDQXQGHUJRR[LGDWLRQLQWKHJDVDQG liquid phases, forming NO3- and SO42-. These ionic pollutants are typically anthropogenic (from industrial and transportation sources) and are considered to play an important role in the formation of acid rain (Minoura and Iwasaka, 1996). More recently, various studies analyzing the chemical composition of rainwater have been conducted worldwide. Most of these studies have evaluated sulfur compounds, nitrogen compounds and the pH in bulk precipitation (Cowling, 1982).
Within the same rainfall event, chemical species concentrations can present marked temporal variations. Therefore, sequential sampling during a precipitation event is essential to the evaluation of scavenging processes. Precipitation chemistry is especially useful in the development and evaluation of acidic deposition models, which are designed to simulate and predict the removal process. Among studies evaluating the chemical composition of rainwater as well as scavenging HI¿FLHQFLHVPRUHKDYHEHHQEDVHGRQWKHVDPSOLQJRILQWHJUDWHG events (monthly, weekly, daily or per-event) than on the sequential sampling of precipitation (Baez et al., 1992, Poissant and Beron, 1992, Lim et al., 1991, Durana et al., 1992). Various IDFWRUV FRQWURO WKH VFDYHQJLQJ HI¿FLHQF\ RI ZHW GHSRVLWLRQ and, consequently, rainwater concentrations. These factors include the type of cloud, the type of precipitation, the air mass trajectory and the solubility of gaseous species, as well as the nature, size and shape of hydrometeors involved in in-cloud and below-cloud scavenging processes.
In recent years, models of in-cloud and below-cloud scavenging processes for air pollutants have been evaluated by some authors who have shown the relevance of inter-compartment transfer from the atmosphere to the hydrosphere. Numerical modeling studies have also been conducted simulating reservoir transfer in many regions around the world, especially in the most heavily polluted areas. However, very few studies have been carried out in tropical areas. The importance of these regions is based on the faster hydrological cycle where the total amount of rainfall is usually quite high.
&DXWHQHW DQG /HIHLYUH DQG *RQoDOYHVHWDO (2003) used numerical modeling to evaluate gas and aerosol scavenging processes in tropical areas. The authors evaluated modeled and observed concentrations of SO2, SO42- and NH4+ in convective rainfall within the African and Amazonian
HTXDWRULDO IRUHVWV UHVSHFWLYHO\ %RWK VWXGLHV H[DPLQHG WKH relationship between liquid water and trace element content in convective precipitation. The results compared favorably with the evaluation of the observed data set collected during the ABLE 2B $PD]RQLDQIRUHVWDQG'(&$)($IULFDQIRUHVWH[SHULPHQWV *RQoDOYHVHWDO(2003) performed the sampling campaign in WKHVWDWHRI$PDSiVLWXDWHGLQWKHQRUWKHUQSDUWRI%UD]LOLDQ $PD]RQLD7KHDXWKRUVGHWHUPLQHGWKDWWKHHI¿FLHQF\RIDHURVRO scavenging decreased in proportion to increases in rain intensity DQGWKDWWKHYHUWLFDOSUR¿OHRIDWPRVSKHULFWUDFHHOHPHQWVKDGD strong impact on ground-level concentrations of those elements in rainwater. The inclusion of in-cloud data was instrumental in the improved modeling of scavenging processes seen in that study. The authors employed the Regional Atmospheric Modeling System (RAMS) mesoscale atmospheric model, which addresses the spatial and temporal evolution of cloud microphysics within rainfall systems. This model is particularly useful in the analysis of cloud liquid water content, as well as the cloud droplet spectrum and vertical dimensions thereof.
On the other hand, the metropolitan area of São Paulo (MASP) is also in a tropical area, at Southeastern Brazil and faces serious air-quality problems. Through an array of numerous government-funded automatic air-quality monitoring stations, key air pollutants in the area have been measured since 1973 and continuously evaluated since 1981 (CETESB, 2003). The main source of air pollutants in São Paulo is mobile emissions from both WKHOLJKWDQGKHDY\GXW\ÀHHW0RUHWKDQRIQLWURJHQR[LGH FDUERQPRQR[LGHDQGQRQPHWKDQHK\GURFDUERQHPLVVLRQVDUH generated from the burning of fuel used in internal-combustion HQJLQHV7KHVHIXHOVLQFOXGHJDVRKROHWKDQROSXUHHWKDQRO DQGGLHVHO,QDGGLWLRQDVLJQL¿FDQWSRUWLRQRIVXOIXUGLR[LGH emissions is attributable to industrial sources. Within the MASP, 2,000 companies (a small fraction of the total) are responsible IRUPRUHWKDQRILQGXVWULDOHPLVVLRQV 2YHU WKH SDVW VHYHUDO Over the past several years, the levels of primary air pollutants have decreased butthe levels of primary air pollutants have decreased but events with high levels of NO2, CO, particulate material and ozone still take place. Atmospheric ozone concentrations in the ozone concentrations in the UHJLRQKDYHUHDFKHGOHYHOVRIPRUHWKDQ¿YHWLPHVWKDWFRQVLGHUHG protective of public health by the World Health Organization. In WKHZLQWHUWLPHSDUWLFXODWHPDWWHUSDUWLFOHVOHYHOVURXWLQHO\H[FHHG the 150 g/m3 24h (CETESB, 2003).
volume-weighted mean pH of 4.6 for rainwater. This is similar to the pH of 4.5 recorded in another study carried out from September 1993 to May 1994 (Paiva et al., 1997).
According to the monitoring air quality data (CETESB DWPRVSKHULFVXOIXUGLR[LGHJDVGHFUHDVHGIURP g m-3 (in 1990) to 20 g m-3 (in 2000) in MASP area. This drop can be attributed to enhanced control over sulfur emissions, owing to the enforcement of two governmental regulations: mandatory low sulfur content in diesel and gasohol, and controlled percentages RIVXOIXUGLR[LGHDQGVXOIDWHSDUWLFXODWHLQLQGXVWULDOHPLVVLRQV As a consequence, sulfate in rainwater has also decreased, from 24.8 mol L-1 (in 1989, Fornaro et al. 1993) to 9.5 mol L-1 (in 2000). Therefore, enforcement of governmental regulations has proven effective during the last decade.
)URPWRVHYHUDOREVHUYDWLRQDO¿HOGVWXGLHV ZHUHFRQGXFWHGLQRUGHUWRGHWHUPLQHWKHH[WHQWRIWKHGDPDJHWR the Serra do Mar rainforest, nearby MASP (Klockow et al., 1996). Based on data, obtained during a March 1992 campaign from this study and conducted in the Cubatão region (a highly industrialized DUHDQHDUWKH0$63*RQoDOYHVHWDODQGSUHVHQWHG two numerical modeling studies of cloud processes: with RAMS (Regional Atmospheric Mesoscale Modeling) and a model called %Y7KH¿UVWLQIRFXVHGRQEHORZFORXGVFDYHQJLQJ whereas the second (in 2002) analyzed in-cloud scavenging where this last model (B.v.2) was developed. The results showed that below-cloud scavenging dominated the scenario in the rain events studied. Because Cubatão is located at the base of a mountain (in the Serra do Mar range) and is surrounded by WURSLFDOUDLQIRUHVWFRQGLWLRQVDUHH[WUHPHO\XQIDYRUDEOHIRUWKH dispersion of atmospheric pollutants. As a result, the soil and vegetation have suffered the impact of the pollution, mainly due to the air-water transport. The high annual rainfall rates, which can reach 4,500 mm, contribute to this effect. The results of the *RQoDOYHVHWDOVWXG\ZHUHTXLWHVLPLODUWRWKRVHRIWKH SUHYLRXVO\PHQWLRQHG*RQoDOYHVHWDO$PDSiVWXG\LQ that RAMS in-cloud scavenging simulations proved quite useful. Therefore, RAMS-based numerical modeling has demonstrated its value in the investigation of scavenging processes, contributing to the understanding of wet deposition. It is important to note that atmospheric wet deposition is quite relevant to inter-compartment WUDQVIHUZKLFKKDVVLJQL¿FDQWFRQVHTXHQFHVIRUORFDODVZHOODV global, modeling studies.
The main goal of the present paper is a preliminary investigation of sulfur transfer from the atmosphere to the hydrosphere in the MASP region, with a focus on whether the local or remote effect, through the RAMS numerical modeling ZLWKGLIIHUHQWLQSXWVSHFWUD7KHUHIRUHWKHVLJQL¿FDQFHRIWKLV paper should be on the overall improvement knowledge about the sulfur transferences at the studied region as well as the scavenging numerical modeling.
2. DATA AND METHODS
7KHGDWDZHUHFROOHFWHGDWH[SHULPHQWDOVLWHVVHF analyzed through rain sampling (sec. 2.2), numerical modeling (sec. 2.3) using the rain sampling and the comparison between both (sec. 2.4).
2.1. Experimental Sites
7KH H[SHULPHQWDO VLWHV ZHUH WZR VWDWLRQV RQH LQ the “Parque Estadual das Fontes do Ipiranga (PEFI)” and the other on the University of São Paulo campus (Cidade 8QLYHUVLWiULD 863 ERWK ZLWKLQ WKH 0$63 DQG ERWK measuring air humidity, temperature, wind direction, and others. The PEFI station is situated at 23.39°S and 46.37°W at an altitude of 800 m, southeast of the city center. The campus is situated at 23.34oS and 46.44oW, near the city center, at DQDOWLWXGHRIP)LJXUH7KHVLWHVDUHDSSUR[LPDWHO\ 15 km apart. There were two main campaigns, July 1989 (only at USP) and July 2000 (at USP and PEFI), which will be compared herein.
It is important to note that MASP area has a subtropical climate with rainfall 1400 mm per year, mainly from December to March (summer period). In the wintertime the weather is characterized by dry conditions, thermal inversions and events of high air pollutants concentrations.
2.2. Rain and aerosol sampling: observed and input
data
Specific collectors, placed in both locations, were used to gather rainwater samples (wet-only), that were then analyzed for sulfate. In the 1989 campaign, a DIONEX 4000i FKURPDWRJUDSKHU ZLWK DQ$6 'LRQH[ FROXPQ ZDV XVHG IRUWKLVSXUSRVH7KHHOXHQWZDVDPL[WXUHRIPPRO/-1 of Na2CO3 and 3.9 mmol L-1 of NaHCO3ÀRZLQJDWDUDWH of 1 mL min-1$VXSSUHVVHUFROXPQ$006'LRQH[DQGD regenerant solution of 20 mmol L-1 H2SO4 were also used. The VDPSOHVZHUH¿OWHUHGZLWK0LOOH[ P0LOOLSRUH¿OWHUV (Fornaro, 1991).
In the 2000 campaign, rainwater sulfate was determined by capillary zone electrophoresis using contact-less conductivity detection as described by Rocha et al. (2003), as well as by Fornaro and Gutz (2003). In the present study, a 75 m internal diameter fused silica capillary, 60 cm in length (50 cm before the detector), was employed. The injection was performed hydrostatically by elevating the standard solution or sample by 10 cm for 30 s, the detector was operated at 600 kHz, and the separation potential was -15 kV. Prior to each session, the capillary was treated with 0.2 mol L-1 NaOH for 30 min and VXEVHTXHQWO\ZDVKHG¿UVWZLWKGHLRQL]HGZDWHUDQGWKHQZLWK the buffer solution for 30 min. For anion separation, a pH 6.2 buffer, consisting of 20 mmol L-1 of 2-[morphine] ethanesulfonic acid and 20 mmol L-1 of histidine, was used in combination with a solution of 0.2 mmol L-1 of cetylmethylammonium bromide &7$%DFWLQJDVDQHOHFWURRVPRWLFÀRZPRGL¿HU
In the winter (August) of 1999, aerosol collection was performed on the University of São Paulo campus (23.34°S, 46.44°W), which is situated in the NW periphery of the city. Winter samplings were performed from August 3-13 using a VWDFNHG¿OWHUXQLWDQGDPLFURRUL¿FHXQLIRUPGHSRVLWLPSDFWRU (MOUDI). Aerosol spectra were constructed from the data measured by the MOUDI, which has ten different stages. 7KHQRPLQDOFXWRIISRLQW'IRUHDFKVWDJHLV
DIWHU¿OWHU m and
18.0 m (inlet to cut the particles). The MOUDI has rotating impactor plates that provide nearly uniform deposits over FLUFXODULPSDFWLRQDUHDV3RO\FDUERQDWHFRDWHG1XFOHSRUH¿OWHUV (0.4- PSRUHVL]HZLWKPP)RPEOLQ¿OWHUVZHUHXVHGZLWK a 1- PSRUHVL]HDIWHU¿OWHUDQGDÀRZUDWHRIDSSUR[LPDWHO\ 20 L min-1'XULQJVDPSOLQJÀRZUDWHVZHUHFRQWUROOHGE\D PDVVÀRZPHWHUZLWKDYROXPHLQWHJUDWRU
During this campaign, the MOUDI operated on weekdays with an integration time of 10 hours during the day (diurnal samplings from 8:00 to 18:00 LT) and 14 hours at night (nocturnal samplings from 18:00 to 8:00 LT). Over the weekend, the integration time was 24 hours (from 8:00 to 8:00 LT). This
UHVXOWHG LQ VL[ GD\WLPH VDPSOHV VHYHQ QLJKWWLPH VDPSOHV and two 24-hour samples. Mass analysis was carried out by gravimetry and the elemental concentrations were measured by Particle Induced X-ray Emission (PIXE). The PIXE analysis was performed on both samples and blanks at the Physics Institute RIWKH8QLYHUVLW\RI6mR3DXOR7KH¿OWHUVZHUHLUUDGLDWHGZLWK a 2.4-MeV proton beam, at a typical current of 20 nA. The X-ray spectra were accumulated for 600 s, as recommended by Miranda et al. (2002). It was considered that all the sulfur presented in the sample, analyzed by PIXE, was ammonium sulfate. Ammonium sulfate showed simple unimodal size distribution during the day (with peak diameter of 0.38 µm) and bimodal size distribution at night (0.38 and 0.59 µm). The crustal material contribution was greater in larger cutoff diameter stages. Ynoue and Andrade (2004) showed that most RIWKH¿QHPRGHPDVVLQWKH0$63FRQVLVWHGRIRUJDQLFDQG black carbon and, in lesser quantities, ammonium sulfate. The WKUHHWRJHWKHUDSSHDUWRFRQVWLWXWHWKHEXONRI¿QHSDUWLFXODWH matter in the region and that the dominant ions are ammonium, sulfate and nitrate. The authors showed that concentrations of crustal material had elevated concentrations at higher MOUDI stages, corresponding to the coarse fraction of the aerosol. The main crustal elements found were aluminum, silicon, titanium DQG LURQ %DVHG XSRQ WKHLU UHVXOWV WKH ¿QH PRGH VPDOOHU than 1 m) receives a larger contribution from carbonaceous materials (organic carbon + black carbon) than from ammonium sulfate. The characteristics of urban aerosols in the São Paulo atmosphere are different from those in other urban areas because the primary source is mobile emission, which is also responsible IRUDVLJQL¿FDQWSRUWLRQRIWKHSDUWLFXODWHPDWWHUVSHFL¿FDOO\ XOWUD¿QHSDUWLFOHVIURPOLJKWDQGPDLQO\KHDY\GXW\YHKLFOH
The CETESB monitoring stations house automatic gas samplers for NO, NO2, SO2, CO, total HC, non-methane HC and O3, together with a beta gauge particulate monitor for PM10 (particulate matter with aerodynamic diameters less than 10 µm). The 29 automatic stations are distributed throughout MASP, as well as in Cubatão and other major cities within the state of São Paulo. There are 12 stations that measure SO2 and report hourly. No biogenic emissions are included.
2.3. The scavenging modeling.
The spatial structure of the scavenging modeling processes ZDV EDVHG XSRQ D YHUWLFDO RQHGLPHQVLRQDO FORVHG ER[ between the ground and cloud base for below-cloud modeling and between cloud base and cloud top for in-cloud modeling;
The gas-scavenging modeling presents similar equations for both processes. Particulate matter (PM) scavenging modeling is also similar and includes nucleation processes;
The in-cloud modeling was developed using the mesoscale numerical modeling RAMS. This was done in order to evaluate the following parameters:
D7KHYHUWLFDOSUR¿OHRIWKHcloud water content was used in order to obtain the cloud droplet spectra and to integrate the LQFORXGVFDYHQJLQJSURFHVVHVDORQJLWVYHUWLFDOSUR¿OH E)RUORZUHVROXWLRQJULGVRI5$06WKHYHUWLFDOSUR¿OH
concentrations were obtained with a parameterization of sub-grid scale convective transport of gases and aerosol particles associated with deep and moist convection systems. Aerosol was considered without mass. The parameterization was based on the ‘top-hat’ method, has been coupled to the cumulus parameterization scheme of RAMS-CSU model;
)RU EHORZFORXG PRGHOLQJ WKH H[LVWHQFH RI D XQLIRUP raindrop size distribution (DSD) was based on a given rainfall rate. No splitting, break-up events or other changes of the DSD took place during the event. Different function relations FRXOGH[SUHVVWKH'6'7KH'6'XVHGKHUHLQZDVGLYLGHG LQWR¿IW\FODVVHVRIUDLQGURSVL]HYDU\LQJIURPPPWR 5.2mm in diameter. The raindrop size distributions were also assumed to follow a Gamma function distribution as proposed LQ*RQoDOYHVHWDOUHODWLYHWRWKHPHDVXUHGUDLQIDOO rate for each event;
The main chemical modeling reactions analyzed from gases DEVRUSWLRQZHUHDOVREDVHGRQ*RQoDOYHVHWDO622, was the gas and SO4= was the particulate matter, both used as input data (atmospheric concentrations). The prognostic variables were SO4= in rainwater.
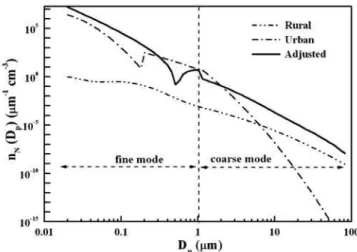
The particulate matter size distribution for all aerosol species is characterized by a lognormal function, according to Whitby (1978) and Jaenicke and Davies (1976) for rural distribution, urban and adjusted-urban distributions, within the 0.01 to 40 m radius and divided into 73 mass class sizes ( g m-3). Particle mass and number distributions are assumed to be temporally constant with respect to particulate aerodynamic diameter, or rather; hygroscopic growth is not considered (Figure 2). Particle density is assumed to be equal to 1 g cm-3. A measured aerosol spectra from a MOUDI collector is also used, herein referred to as the adjusted-urban spectra, presented in Table 1 (Ynoue and Andrade, 2004).
Figure 2 – Aerosol input spectra in number per diameter class. Rural and urban adapted from Whitby (1978) and urban adjusted for sulfate H[WUDFWHGIURPORFDOPHDVXUHPHQWV
Table 1±$YHUDJHFKHPLFDOFRPSRVLWLRQRIDHURVRO¿QHPRGHSDUWLFOHV (in µg/m3) as a function of their size during (a) daytime and (b) night-WLPHZKHUH$)PHDQV³DIWHU¿OWHU´
(a)daytime
D50
ȝP SO4= NH4+ NO3- BC Mass
AF 0.85 0.76 0.20 2.5 10.2
0.18 1.53 1.10 0.15 0.3 18.1
0.32 1.18 0.85 0.12 0.2 14.4
0.56 0.91 0.71 0.13 0.5 10.7
1 0.72 0.36 0.31 0.3 11.8
1.8 0.21 0.21 0.38 0.2 10.7
Total 5.39 3.99 1.30 4.05 75.90
(b)nighttime
D50
ȝP SO4= NH4+ NO3- BC Mass
AF 1.03 0.47 0.13 6.1 12.1
0.18 1.68 0.97 0.08 0.4 17.3
0.32 1.20 0.69 0.10 0.2 11.0
0.56 1.49 0.79 0.15 0.6 10.4
1 0.76 0.31 0.28 0.4 7.8
1.8 0.16 0.03 0.39 0.2 7.5
Total 6.32 3.27 1.14 8.03 66.06
The main RAMS parameterization are:
the other two having 4 km and 1 km horizontal resolutions (see also Figure 1), respectively, with z of 100 m, a 1.2 YHUWLFDOJULGVWUHWFKUDWLRDQGPPD[LPXP z for vertical stretch. Time steps were assumed to be 20 s, with 2 s being the smallest;
2.4. Statistics methods
The following statistical tools are used in order to provide a comparison between modeled and observed data groups: FRUUHODWLRQFRHI¿FLHQWDQGURRWPHDQVTXDUHHUURU506(,Q this study, the variables behave as lognormal functions, therefore WKH3HDUVRQFRUUHODWLRQFRHI¿FLHQWLVFDOFXODWHGXVLQJWKHVH variables in the lognormal distribution.
In order to perform the modeling described above, case studies were selected from among rainfall events occurring on the university campus. The events of July 26, 1989, July 15, 2000 and July 23, 2000 were chosen because, for these events, complete data for the modeling analysis were available for the various scenarios (below-cloud and in-cloud scavenging using size distribution spectra from rural, urban and adjusted-urban areas). Two numerical modeling simulations (below-cloud scavenging or in-cloud scavenging, both using the various spectra distributions) were designed for the July 15, 2000 and July 23, 2000 events at both locations. Observed and modeled concentrations were compared.
3. RESULTS AND DISCUSSIONS
3.1. Synoptic description of July 26, 1989, July 15,
2000 and July 23, 2000 rainfall events
In the July 26, 1989 event, a frontal system arrived in WKH0$63DWDSSUR[LPDWHO\/7RQ-XO\7KLVV\VWHP
created 46.5 mm of precipitation from 3:25 LT to 20:00 LT. The July 15, 2000 event was characterized as stratiform and was caused by a cold front approaching the site at 16:40 LT and passing at 23:00 LT. The integrated precipitation totaled 15.7 mm. The July, 23, 2000 event was also characterized as stratiform, remaining over the station from 5:00 LT to 23:00 LT and releasing 34.6 mm of total precipitation.
3.2. Results of the modeling for the July 26, 1989,
July 15, 2000 and July 23, 2000 rainfall events: PM
spectra differences
Figures 3 to 5 show the observed and modeled rainwater sulfate concentrations with the three spectra: urban, adjusted-urban and rural. Compared to the rural and DGMXVWHGXUEDQVSHFWUDWKHXUEDQVSHFWUXPH[KLELWHGGLIIHUHQW behavior. Rural and adjusted-urban spectra provided the highest early sulfate rainwater concentrations due to the fact that there was a greater amount of larger-diameter aerosol particles (and consequently more mass in the coarse fraction) than in the urban VSHFWUXP7KHFROOLVLRQHI¿FLHQF\LQFUHDVHVXQWLOLWUHDFKHVQHDU unity for aerosols larger than 2.5 m. Consequently, the coarse fractions of both rural and adjusted-urban spectra are quickly removed, generating higher rainwater concentrations in the ¿UVWVDPSOHV)LJXUHVWR2QWKHRWKHUVLGHLQWKHXUEDQ spectra, the rainwater concentrations show a mild decrease DQGWKHUHIRUHGRQRWVKRZDVWDWLVWLFDOO\VLJQL¿FDQWFRUUHODWLRQ FRHI¿FLHQWZLWKWKHREVHUYHGFXUYHVDVLWLVGHVFULEHGDVLW follows. Tables 2a and 2b show those results. These results also emphasize that rural and urban-adjusted spectra generally KDYHKLJKHUFRUUHODWLRQFRHI¿FLHQWVDQGVPDOOHU506(YDOXHV than urban spectrum. All results show a RMSE-to-observed values ratio lower than the observed data standard deviations, GHPRQVWUDWLQJWKHJRRGQHVVRI¿WWLQJ
Figure 3 – Sulfate rainwater concentration (mg L-1) during July 26th 1989 rain event. Observed data ( ) and modeled using rural (), urban (S)
and adjusted (z) aerosol spectra distribution: (a) below-cloud modeling; (b) below-cloud + in-cloud modeling..
a) b)
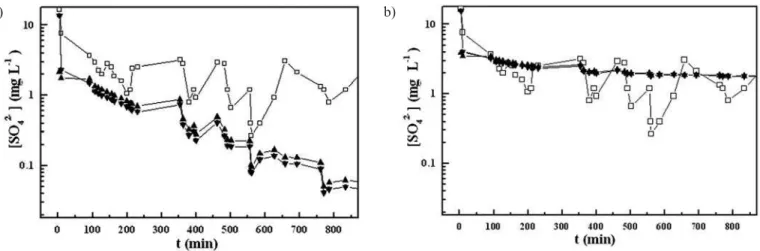
Figure 4 – Sulfate rainwater concentration (mg L-1) during July 15th 2000 rain event. Observed data ( ) and modeled using rural (), urban (S) and adjusted (z) aerosol spectra distribution: (a)below-cloud modeling; (b) below-cloud + in-cloud modeling.
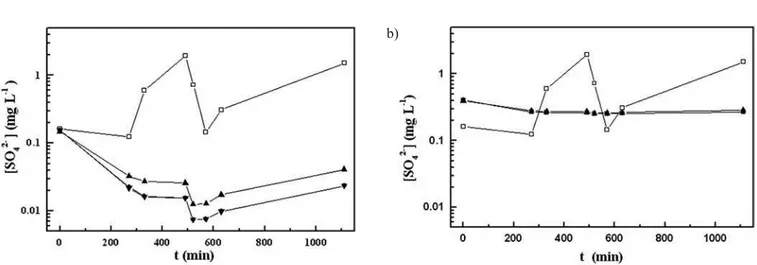
Figure 5 – Sulfate rainwater concentration (mg L-1) during July 23th 2000 rain event. Observed data ( ) and modeled using rural (), urban (S) and adjusted (z) aerosol spectra distribution: (a) below-cloud modeling; (b) below-cloud + in-cloud modeling.
a) b)
)URPWKRVH7DEOHVWKHFRUUHODWLRQFRHI¿FLHQWVDUH for spectra from rural and adjusted-urban, respectively, versus 0.68 for the urban spectrum during the July 26, 1989 event (see also Figures 3a and 3b). The RMSE event averages were 0.47 for rural and adjusted-urban spectra, respectively, versus 1.48 for the urban spectrum during the same event. For the July 15, 2000 event, the rural and urban-adjusted spectra presented D FRHI¿FLHQW FRUUHODWLRQ RI ZKHUHDV WKDW RI WKH XUEDQ VSHFWUXPZDV7KH506(IRUWKLVHYHQWZDVDSSUR[LPDWHO\ 0.43 for rural and urban-adjusted spectra and 0.37 for the urban
VSHFWUXP$OOWKHVHVWDWLVWLFDOUHVXOWVZHUHKHDYLO\LQÀXHQFHG E\WKHYDOXHVRIWKH¿UVWVDPSOHVIRUWKHPRGHOHGDQGREVHUYHG data (Figures 3 to 5).
DQGEGXULQJWKHHYHQW7KLVZLQGVKLIWZDVFRQ¿UPHGZLWK weather charts (Figure 6). It is of note that there is no advection ZLWKLQWKHVFDYHQJLQJPRGHOVLQFHLWLVDFORVHGER[
Figure 6 – Wind direction at USP during July 23th 2000.
7KHVHUHVXOWVZKLFKVHHPWR¿WEHWWHUZLWKREVHUYHG FRQFHQWUDWLRQVLQWKH¿UVWWZRUDLQIDOOHYHQWVPLJKWEHDVFULEHG to local sources.
3.3. Results of the modeling of the July 26, 1989,
July 15, 2000 and July 23, 2000 events: in-cloud and
below-cloud contributions
Figures 3a, 4a and 5a show only below-cloud contributions with the overall decays, which are compared to the observed data curves. Upon including in-cloud contributions to the PRGHOLQJ)LJXUHVEEDQGEWKHPRGHOHGYDOXHVH[FHHG the observed ones. The observed decays are more pronounced
than are those in the below-cloud + in-cloud models, a fact that FRXOGEHH[SODLQHGE\WKHGRPLQDQFHRIEHORZFORXGVFDYHQJLQJ (Naik et al., 1994), although quantitative data is not available.
Figures 5a and 5b show that the behavior of the July 23, 2000 event was different from that of the other events in that WKHH[SHFWHGGHFD\LVQRWVHHQ7KHUHZDVDQLQWHQVHLQFUHDVH after 300 minutes of rainfall. However, the direct high temporal UHVROXWLRQGDWDGRQRWLQGLFDWHLQFUHDVHGVXOIDWHVXOIXUGLR[LGHLQ air, which would affect rainwater concentrations. This increase could, therefore, be due to the change in wind direction, as H[SODLQHGDERYH
3.4. Results of the modeling of the July 15, 2000 and
July 23, 2000 events: local differences
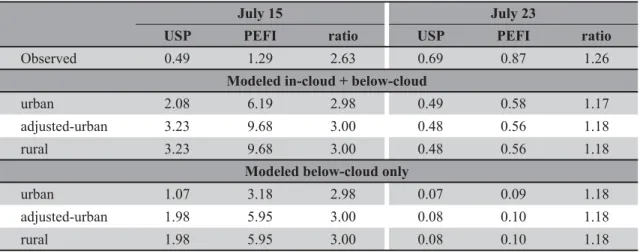
Table 3 shows local average rainwater concentrations with the three modeled simulated concentrations, observed data and the PEFI/USP (both locations) ratios. In these three simulations, the in-cloud + below-cloud concentrations were also included. Despite the lack of agreement among observed and modeled values, the overall results show good agreement between the USP/PEFI ratios of modeled and observed values. Additionally, the SO2 input data was determinant to the modeled spatial variability which was found in both observed and modeled rainwater, through the USP/PEFI ratios, which emphasizes below-cloud scavenging.
Table 2a.&RUUHODWLRQFRHI¿FLHQWVEHWZHHQPRGHOHGDQGREVHUYHGVXOIDWHUDLQZDWHUFRQFHQWUDWLRQVIRUGLIIHUHQWDHURVROVSHF -WUXPLQSXWVLQDORJQRUPDOGLVWULEXWLRQ&RUUHODWLRQFRHI¿FLHQWVS
Spectrum Date
July 26, 1989 July 15, 2000 July 23, 2000
Rural 0.71 0.98 -0.33
Urban 0.68 0.92 -0.30
Adjusted-urban 0.71 0.98 -0.34
Table 2b. Root mean square errors (RMSE) for modeled values divided by mean observed sulfate rainwater concentrations for different aerosol spectra and events, adding mean observed values and their respective standard deviations.
RMSE/Observed Rural spectrum
Urban spectrum
Adjusted spectrum
Mean observed
Standard deviation
July 26, 1989- a 0.23 1.16 0.23 2.27 2.68
July 26, 1989- b 0.70 1.80 0.70 2.27 2.68
July 15, 2000- a 0.31 0.38 0.30 0.49 0.76
July 15, 2000- b 0.56 0.36 0.54 0.49 0.76
July 23, 2000- a 0.62 0.61 0.62 0.69 0.68
July 23, 2000- b 0.43 0.43 0.43 0.69 0.68
From Table 3, using only below-cloud modeling, modeled values are closer to observed values than when below-cloud and in-cloud processes are considered together. However, in WKH -XO\ HYHQW DV DQWLFLSDWHG E\ *RQoDOYHVHWDO (2002), below cloud modeled values are twice as high as observed values in the urban spectrum and in-cloud + below cloud modeled, four times higher. With the two other spectra, the values are even higher than observed values. Therefore, the below-cloud modeling seems to estimate the observed values rather than the both scavenging processes together. As LWZDVH[SODLQHGLQ*RQoDOYHVHWDOWKHUHVXOWVVKRZ WKHH[SHFWDQWRYHUHVWLPDWLRQRIWKHREVHUYHGYDOXHV6LPLODU results were obtained in the simulations conducted during the July 1989 campaign.
It is not that the case in the July 23, 2000 event, modeled and observed concentrations did not differ considerably, probably due to the previously mentioned shift in wind direction, which might have led to an increase in the observed data.
Therefore, there are usually significant differences between modeled and observed which could mostly be due to the non advection terms.
In general, the below-cloud process seems to play the most important role in atmospheric scavenging in these case studies, where local sources were dominant in the wet deposition contamination. This dominance was due to the pattern of wet deposition rather than to the amount of contamination.
4. CONCLUSIONS
7KHSULPDU\¿QGLQJRIWKLVVWXG\ZDVWKDWEHORZFORXG scavenging dominates in winter stratiform events. We base this conclusion on the great spatial variability of the concentrations of compounds in rainwater and on the behavior of the rate
Table 3 – Results of the modeling for the July 15, 2000 and July 23, 2000 events, compared to the observed data for sulfate in rainwater (mg/L)
July 15 July 23
USP PEFI ratio USP PEFI ratio
Observed 0.49 1.29 2.63 0.69 0.87 1.26
Modeled in-cloud + below-cloud
urban 2.08 6.19 2.98 0.49 0.58 1.17
adjusted-urban 3.23 9.68 3.00 0.48 0.56 1.18
rural 3.23 9.68 3.00 0.48 0.56 1.18
Modeled below-cloud only
urban 1.07 3.18 2.98 0.07 0.09 1.18
adjusted-urban 1.98 5.95 3.00 0.08 0.10 1.18
rural 1.98 5.95 3.00 0.08 0.10 1.18
of pollutant removal, as evidenced by the lower values seen in samples collected later in the event. The comparison between two different locations seems to support the idea that below-cloud scavenging dominates the stratiform event scenario. )RUH[DPSOHDWPRVSKHULFFRQFHQWUDWLRQVRI622 also indicate a ORFDOLQÀXHQFHZKLFKSOD\VDYHU\LPSRUWDQWUROHLQWKHZDWHU chemistry. Wind direction also plays an important role, as can be noted when there is an abrupt variation in wind direction. Modeling of scavenging processes compared favorably with the REVHUYHGUHVXOWVFRQ¿UPHGE\WKHORZ506(YDOXHVWKHUHE\ demonstrating the dominance of below-cloud scavenging. The differences
The results indicate that the aerosol size distribution spectra play a major role in the removal process, which is clearly seen through the numerical modeling. Adjusted-urban (MASP) and rural spectra gave the best representation of the concentrations of the various compounds in rainwater, presenting smaller RMSE values than did the urban spectra. Our results also indicate a SRVVLEOHORFDOLQÀXHQFHGXHWRWKHIDFWWKDWERWK863DQG3(), are surrounded by natural aerosol sources, i.e. vegetation that matches the rural spectrum or adjusted-urban, within the urban DUHD7KHDGMXVWHGVXOIDWHDHURVROVSHFWUXPH[KLELWVDPL[WXUH of rural and urban characteristics, though more similar to that of the rural spectrum. Those results also favor the improvement of the scavenging modeling which thereafter will use the aerosol spectra as in important input data.
5. ACKNOWLEDGEMENTS
6. REFERENCES
BAEZ, A.; BELMONT, P.R.; PADILLA, H., 1992. Variation ofVariation of chemical composition of wet precipitation using a sequential sampling: urban-rural areas. Atmosfera, v. 6, p. 163-174. CAUTENET, S., LEFEIVRE, B.: 1994. Contrasting behavior of
gas and aerosol scavenging in convective rain: a numerical DQG H[SHULPHQWDO VWXG\ LQ WKH$IULFDQ HTXDWRULDO IRUHVW Journal of Geophysical Research, v.99, p.13013-13024.
CETESB, 2003, Relatório de Qualidade do Ar no Estado de São Paulo - 2002, Secretaria do Meio Ambiente, Série Relatórios ISSN 0103-4103, São Paulo (www.cetesb.sp.gov.br). COWLING E. B.: 1982. Acid precipitation in historical
perspective. Environmental Science Technology 16(2), p. 110A-123A.
DURANA, N., CASADO, H., EZCURRA, A., GARCIA, C., /$&$8;-3',1+39([SHULPHQWDOVWXG\RIWKH scavenging process by means of a sequential precipitation collector, preliminary results. Atmospheric Environment 26A(13), p. 2437-2443.
FLATAU, P.J.: 1989. The CSU RAMS Cloud Microphysical module: General Theory and Code Documentation. Colorado St. Univ. Dep. Atm. Sci. Fort Collins, CO 80523. Atmospheric Science, p.451 .
FORNARO, A.: 1991.Chuva ácida em São Paulo: caracterização química de amostras integradas e seqüenciais de deposição úmida., 0DVWHU 'LVVHUWDWLRQ DW ,QVWLWXWR GH 4XtPLFD (Chemistry Institute), University of São Paulo.
FORNARO, A., GUTZ. I.G.R.: 2003. Wet deposition and related atmospheric chemistry in the São Paulo Metropolis, Brazil: Part 2. Contribution of formic and acetic acids. Atmospheric Environment v.37, p.117-128.
FORNARO, A., ISOLANI, P.C., GUTZ, I.G.R., 1993. Low-cost automated rain collector and its application to the study of wet-only deposition in São Paulo (Brazil). Atmospheric Environment v.27(B), 307-312.
FORTI, M.C., MOREIRA-NORDEMANN, L.M., ANDRADE, M.F.; ORSINI, C.Q.: 1990, Elements in the precipitation of S. Paulo City (Brazil). Atmospheric Environment v.24B, p. 355-360.
GONÇALVES, F.L.T., MASSAMBANI O., BEHENG, K.D., SOLCI, ROCHA, V., M.C., SCHILLING, M.,VAUTZ, W., KLOCKOW, D.: 2000. Modelling and measurements of below scavenging processes in the highly industrialized region of Cubatão-Brazil. Atmospheric Environment v.34, p. 4113-4120.
GONÇALVES, F.L.T., MALHEIROS, A. R., FREITAS, R. S., ASSUNÇÃO, M. A. F., MASSAMBANI O.: 2002. In-cloud and below-cloud numerical simulation of scavenging processes at Serra do Mar region, SE Brazil. Atmospheric Environment, v.36, (33), p. 5245-5255.
GONÇALVES F.L.T., ANDRADE, M.F., FORTI, M.C., ASTOLFO, R., RAMOS, M.A., MASSAMBANI, O., MELFI, A.J.: 2003. Preliminary estimation of the rainfall chemical composition evaluated through the scavenging PRGHOLQJ IRU 1RUWKHDVWHUQ$PD]RQLDQ UHJLRQ $PDSi State, Brazil). Environmental Pollution v.121(1), p.63-73.
JAENICKE R., DAVIES, C.N.: 1976. The mathematical H[SUHVVLRQRIWKHVL]HGLVWULEXWLRQRIDWPRVSKHULFDHURVROV Journal of Aerosol Science v.7, p. 255-259.
KLOCKOW, D., TARGA, H.J., VAUTZ, W.: 1996. Air pollution and vegetation damage in the Tropics- the Serra do Mar DVDQH[DPSOH)LQDOUHSRUW*HUPDQ%UD]LOLDQ Cooperation in Environmental Research and Technology, 150 p.
LEVINE, S.Z., SCHWARTZ, S. E.: 1982. In-cloud andIn-cloud and below-cloud scavenging of nitric acid vapor. Atmospheric Environment v.6, p. 317-320.
LIM, B., JICKELLS, T.D., DAVIES, T.D.: 1991. Sequential sampling of particles, major ions and total trace metals in wet deposition. Atmospheric Environment v.25A(3-4), p. 745-762.
MINOURA, H., IWASAKA, Y.: 1996. Rapid change in nitrate and sulfate concentrations observed in early stage of precipitation and their deposition process. Journal Atmospheric Chemistry v.24, p. 39-55.
MOLINARI, J., 1985. A general-form of Kuo cumulus parameterization. Monthly Weather Review v.113, p.1411-1416.
NAIK, M.S; KHEMANI, L.T.; MOMIN, G.A.; RAO, P.S.P.; SAFAI, P.D.: 1994. Variation in the ionic composition in convective showers in Pune, India. Tellus, v.46B, p. 68-75. PAIVA, R.P., PIRES, M.A.F., MUNITA, C.S., ANDRADE,
M.F., GONÇALVES, F.L.T., MASSAMBANI, O.: 1997. A preliminary study of the anthropogenic contribution to São Paulo rainfall. Fresenius Environmental Bulletin v.6, p. 508-513. PANDIS, S.N., SEINFELD, J.H., PILINIS, C.: 1990. ChemicalChemical
composition differences among droplets of different sizes. Atmospheric Environment v.24A, p.1957-1969.
POISSANT, L., BÉRON, P.: 1992. Design and operation of an automatic sequential rainfall sampler. Water Research v.26(4), p. 547-551.
ROCHA, F.R, SILVA, J.A.F., LAGO, C.L, FORNARO, A., GUTZ. I.G.R.: 2003. Wet deposition and related atmospheric chemistry in the São Paulo Metropolis, Brazil: Part 1. Major inorganic ions in rainwater as evaluated by capillary electrophoresis with contactless conductivity detection, Atmospheric Environment v.37, p. 105-115.
SEINFELD, J.H., PANDIS, S.N.: 1998. Atmospheric ChemistryAtmospheric Chemistry and Physics: from Air Pollution to Climate Change. John Wiley & Sons, New York, 1326 p.
WHITBY, K.T.: 1978. The physical characteristics of the sulfur aerosols. Atmospheric Environment v.12, p.135-159.
![Figure 1 – Localization of the studying area (1 is USP and 2 is PEFI) DQG DSSUR[LPDWHO\ WKH VL]H RI WKH QHVWHG JULGV NP NP DQG 20 km).](https://thumb-eu.123doks.com/thumbv2/123dok_br/18987276.459333/3.892.467.829.713.1090/figure-localization-studying-pefi-dssur-lpdwho-qhvwhg-julgv.webp)