The effects of early protein malnutrition and environmental
stimulation on behavioral and biochemical parameters in rats
Valdomiro de Freitas Sampaio, Luiz Marcellino de Oliveira
†, Sebastião Sousa Almeida, Julio
Sérgio Marchini, José Antunes-Rodrigues and Lucila Leico Kagohara Elias
Universidade de São Paulo, Ribeirão Preto, Brazil† in memoriam
Abstract
The present study investigated the effects of protein malnutrition and environmental stimulation on biochemical and behavioral parameters in rats. The concentrations of polyamines in the frontal cortex, striatum, and hippocampus, as well as plasma corticosterone levels, were measured. The exploratory behavior was analyzed using the elevated plus-maze (EPM) test. Rats received either 16% (well-nourished - W) or 6% (malnourished - M) protein diets and were divided into stimulated or non-stimulated groups. Malnutrition increased corticosterone levels and decreased plasma protein and anxiety. Non-stimulated rats tested in the EPM had increased corticosterone levels and decreased frontal cortex, striatum and hippocampus protein and polyamines contents. Stimulation decreased open arm entries in the EPM in M animals and increased closed arm entries in the W ones. Stimulation increased frequency and time spent in risk-assessment behaviors. These results suggest that both malnutrition and EPM testing are distressing situations, as indicated by increased corticosterone levels. These results are consistent with lower anxiety and/or higher impulsiveness in M animals. Keywords: malnutrition, polyamines, corticosterone, elevated plus-maze, anxiety.
Received 31 October 2008; received in revised form 13 December 2008; accepted 16 December 2008. Available online 29 December 2008.
Valdomiro F. Sampaio, Luiz M. de Oliveira and Sebastião S. Almeida – Faculdade de Filosoia, Ciências e Letras de Ribeirão Preto da Universidade de São Paulo. Ribeirão Preto, SP, Brazil. Júlio S. Marchini, José Antunes-Rodrigues and Lucila L.L. K. Elias – Faculdade de Medicina de Ribeirão Preto da Universidade de São Paulo. Ribeirão Preto, SP, Brazil. Correspondence regarding this article should be directed to: Valdomiro F. Sampaio – Laboratório de Nutrição e Comportamento do Departamento de Psicologia e Educação da Faculdade de Filosoia, Ciências e Letras de Ribeirão Preto. Avenida dos Bandeirantes, 3900 - Ribeirão Preto - São Paulo, Brazil, 14040-901. E-mail: [email protected]
Introduction
Malnutrition is a worldwide problem that affects millions of newborns and children during the most vulnerable stages of cerebral development, impairing several maturational events and leading to morphological, neurochemical, behavioral, and cognitive alterations (Levitsky & Strupp, 1995; Morgane, Mokler, & Galler, 2002). Experimental studies in animals indicate that both malnutrition and sensory deprivation affect learning and memory. On the other hand, the appropriate dietary restoration and environmental stimulation can help to prevent and/or partially reduce these effects (Schanberg, Butler, & Suskind, 1978).
Prolonged protein malnutrition in the rat leads to decreased 5-HT1A serotonin receptor expression and decreased neurogenesis in the central nervous system (Mirescu, Peters, & Gould, 2004), hippocampal atrophy (Lister et al., 2005) and decreased glucocorticoid receptor density in the hippocampus (de Kloet, Oitlz, & Joëls, 1999), with consequent changes in the negative
feedback regulation of corticosterone (CORT) upon the
hypothalamic-pituitary-adrenal axis and maintained
elevation of plasma adrenocorticotropin and CORT levels
(Jacobson, Zurakowski, & Majzoub, 1997). Malnutrition also contributes to hypothyroidism (Ramos, Lima, Teixeira, Brito, & Moura, 1997), low levels of brain derived neurotrophic factor (BDNF) (Mesquita, Pereira, & Andrade, 2002) and decreased activity of ornithine
decarboxylase (ODC) (Schertel & Eichler, 1991), a
regulatory, limiting of polyamine synthesis enzyme and a marker of cellular proliferation and differentiation (Pegg, 1988; Tabor & Tabor, 1984).
The polyamine metabolism complexity and the variety of compensatory mechanisms involved in the maintenance of its homeostasis support their critical role in cellular survival. Historically the ornithine decarboxylase
(ODC; EC 4.1.1.17) and the spermidine/spermine-N1 -acetyltransferase enzymes (SSAT; EC 2.3.1.57) have been
considered as regulators of biosynthesis and catabolism
cytosolic enzyme that responds to trophic stimuli, with
a half-life lasting from 10 minutes to one hour. ODC is
subject to positive and negative feedback regulation by polyamines: polyamine high concentration decreases while polyamine low concentration increases the enzyme activity.
This regulation is under the inluence of antizyme induction - an ODC speciic inhibitor (Hayashi & Murakami, 1995)
with a half-life shorter than 30 minutes - as the result of the intracellular increase of polyamines (Pegg, 2006). Both spermine and spermidine are substrata for and inductors of SSAT, with spermidine being approximately three times
more eficient as substratum than spermine (Wallace,
Fraser, & Hughes, 2003). SSAT has a half-life lasting from 20 to 40 minutes and is quickly inducible. Ientile, De Luca,
Di Giorgio and Macaione (1988) reported the ODC and
SSAT induction in the hippocampus and cerebellum by
CORT, with striking increase of putrescine and a small
decrease in spermidine concentration, probably due to the N1-acetylspermidine slow cleavage by polyamine oxidase
(PAO). According to Ientile et al. (1988), the synthesis
of the ODC enzyme would be the inducing mechanism
(peak of induction around six hours after glucocorticoid administration), even though the short latency period for its onset suggests alternative mechanisms. The action of agmatine, produced by arginine decarboxylase with its inductive action upon antizyme (Dudkowska et al.,
2003), the nitric oxide inhibition upon ODC activity
(Satriano, Ishizuka, Archer, Blantz, & Kelly, 1999), and the
polyamine inlux from the extracellular space may all be
involved in these fast alternative mechanisms. Polyamine transportation into the cell and the N1-acetylspermidine,
spermidine and putrescine exportation contributes to the polyamine homeostasis, spermine not being exported by the cell (Seiler, 2004). Only the free fraction of polyamines, about 10% of the intracellular amount (Igarashi & Kashiwagi, 2000), is catabolized and excreted by mammal cells (Hyvönen, 1989). Fogel-Petrovic, Vujcic, Miller and Porter (1996) reported that, despite the fact that the intracellular concentration of polyamines is in the millimolar range and that there is SSAT mRNA in excess, the translation is not activated unless there
is a cellular polyamine inlux. The polyamine inlux
seems to be controlled by intracellular concentrations of polyamines (Shappell, Fogel-Petrovic, & Porter, 1993).
There are several behavioral consequences of malnutrition, and some authors have shown that malnutrition leads to reduced environmental exploration, increased locomotor activity, and low thresholds to aversive stimuli (shocks, intense light, cold water),
characterizing an intensiied emotional reaction
(Almeida et al., 1994; Moreira, de Araujo, de Oliveira, & Almeida, 1997; Rocinholi, Almeida, & de Oliveira, 1997). Increases in the number of entries and in the time spent on the open arms of the elevated plus-maze suggest that the low protein diet causes a permanent increase in impulsiveness and/or a greater tendency to
explore the open arm novelty, an indicative of lower anxiety (Almeida et al., 1994).
The use of environmental stimulation was shown to be a useful technique to reduce the impairments produced by early malnutrition or by environmental isolation (Rosenzweig, Bennet, & Diamond, 1972). Environmental stimulation increases glucocorticoid receptor expression in the hippocampus and frontal
cortex of rats (Jutapakdeegul, Casalotti, Govitrapong,
& Kotchabhakdi, 2003), changing the regulation of the hypothalamic synthesis of the corticotrophin-releasing
factor (CRF) and the HPA axis reactivity to stress (Ladd,
Owens, & Nemeroff, 1996).
Thus, the main objective of the present work was to study the biochemical alterations in polyamine (putrescine, spermidine, and spermine) concentration in the frontal cortex, striatum and hippocampus; as well
as the plasma CORT levels and behavioral alterations
in rats submitted to early protein malnutrition and environmental stimulation, following exposure to the elevated plus-maze test.
Methods
Animals
Male Wistar (Rattus norvegicus) rats from the
animal colony of the Ribeirão Preto Campus of the
University of São Paulo were used. Each litter was culled to 6 male and 2 female pups on the day of birth. The dams and the pups were housed in transparent plastic cages (40 x 30 x 20 cm) and assigned randomly to a 6% or a 16% protein ad libitum diet. The diets were offered during lactation to both mother and nestlings, and post-lactation phases until day 35 of age. During lactation, the whole litters were weighed on days 0, 7, 14 and 21 of life, while in the post-natal period the animals were individually weighed on days 21, 28 and 35.
The diets were prepared according to the nutrient proportions recommended by the AIN (American
Institute of Nutrition) and AOAC (Association of Oficial Agricultural Chemists) as described by Reeves, Nielsen and Fahey (1993) and Rocinholi et al. (1997). Briely, the protein-deicient diet contained approximately 8% casein
(6% protein), 5% salt mixture, 1% vitamin mixture, 8% corn oil, 0.2% choline, and 77.8% corn starch (w/w). The regular protein diet contained approximately 20% casein (16% protein), 60.8% corn starch and the same percentage
of the other constituents as the protein-deicient diet. The
two diets were supplemented with L-methionine (2.0 g/kg
protein) since casein is deicient in this amino acid.
The animals were divided into litters according to
three variables. The irst variable was the diet condition,
animals submitted (S+) or not (S-) to environmental
stimulation. The third variable was the test condition, with animals being submitted (T+) or not (T-) to the
EPM. This experimental design produced the following 8 groups of conditions WS-T-, WS-T+, WS+T-, WS+T+,
MS-T-, MS-T+, MS+T- and MS+T+.
After weaning, the male animals were placed in individual cages of polypropylene measuring 30 x 19 x 13 cm, according to the distribution of the above groups (n = 12 per group). During all this period the groups submitted to stimulation received environmental stimulation, which consisted of holding the nestling with one hand and sliding the thumb of the other hand on the back of the animal in the cephalo-caudal direction for three minutes, followed by sonorous stimulation with sounds of 3KHz and 70 dB for 3 minutes at regular intervals of 24 seconds. On the 36th day of life the
tested groups were submitted to the EPM and, after 30 min, removed from the home cage and decapitated. All groups were decapitated in the morning between 08:00 a.m and 10:00 am, observing the nadir period of the HPA axis (Guillemin, Dear, & Liebelt, 1959).
After decapitation the animals had their blood collected
for CORT analysis, and the frontal cortex, striatum and
hippocampus were quickly dissected. The samples, after fresh weighing, were frozen to -70 0C, a procedure that
permits a storage of the material for at least six months (Halline, Dudeja, & Brasitus, 1989).
The animals were maintained on a 12:12-h light/dark cycle (lights on at 6:00 am) with room temperature kept at 23-25 oC, and with free access to water and food throughout
the experiment. The experiments were performed in compliance with the recommendations of the Brazilian
Society of Neuroscience and Behavior (SBNeC), which
are based on the US National Institutes of Health Guide
for Care and Use of Laboratory Animals.
Behavioral Analysis
The behavioral analysis was conducted in the EPM apparatus. The EPM was made of wood and consisted of two open arms (50 x 10 cm) opposite to each other, crossed by two enclosed arms (50 x 10 x 40 cm), with an open
roof (Pellow, Chopin, File, & Briley, 1985). The maze was
elevated 50 cm from the ground. Fluorescent ceiling light (40 W) provided the only illumination in the experimental room. All the tests occurred in the morning between 08:00 and 10:00 am. The animals were individually placed in the center of the maze, facing an enclosed arm, and allowed to explore for 5 minutes. The experimental sessions were recorded by a video-camera mounted vertically above the EPM and afterwards analyzed using the software X-Plo-Rat 2005 version 1.1.0, developed in the Laboratory of Exploratory Behavior of the Faculty of Philosophy, Sciences and Letters of Ribeirão Preto (USP), available at http://scotty.ffclrp.usp.br. The following behaviors were analyzed: 1) percentage of open arm entries (an arm
entry deined as the rat having all four paws into an arm),
2) time spent in the open arms, 3) closed-arm entries, 4) rearing (rising on the hind paws), 7) head-dipping
(scanning over the sides of the maze toward the loor),
8) stretch-attend posture (forward elongation of head and shoulders followed by retraction to the original position). The behavioral categories stretch-attend posture and head-dips have been previously described as risk-assessment behaviors (Moreira et al., 1997).
Biochemical Analysis
Polyamines
After homogenizing and deproteinizing, each sample
was iltered and analyzed with HPLC, using ion-pair
reversed phase chromatography with o-ftaldialdehyde post-column derivatization, as described previously
(Löser, Wunderlich, & Fölsch, 1988), and modiied for a inal dilution of 1/10. The results were described in
nanomoles per gram of tissue. The normalization to milligrams of protein for each sample was accomplished and supplied similar results.
Corticosterone analysis
Plasma CORT levels were obtained through a speciic
radio-imunoassay method, after ethanol extraction, as previously described (Elias, Antunes-Rodrigues,
Elias, & Moreira, 1997; Elias, Elias, Castro,
Antunes-Rodrigues, & Moreira, 2004). The anti-corticosterone antibody was kindly supplied by Dr. José Gilberto Vieira (Federal University of São Paulo, Brazil) and the 1,2,6,7 3H corticosterone was bought from GE Healthcare Life Sciences (USES). The assay sensibility and the intra and
inter-assay coeficient variations were 0.4 µg/dL, 5.1%
and 8.4%, respectively.
groups days mean ± SEM
WS
-0 8.87 ± 0.40
21 56.53 ± 1.89
35 141.8 ± 4.81
MS
-0 8.79 ± 0.87
21 21.97 ± 0.57
35 27.41 ± 1.02
WS+
0 8.58 ± 0.67
21 49.35 ± 1.98
35 127.9 ± 5.40
MS+
0 7.95 ± 0.40
21 21.05 ± 0.73
35 27.75 ± 1.14
Protein analysis
The Coomassie blue method with the Dye Reagent Concentrate (BIO-RAD Protein Assay) and bovine
albumin (Pierce Protein assay reagents) was used (Bradford, 1976) for tissue and plasma protein dosage.
Statistical analysis
Statistical analysis, using the Statistica® software, was conducted applying a 3-factor analysis of variance (ANOVA), with diet, stimulation and test conditions as main factors. When appropriate, post hoc comparisons were made using the Newman-Keuls test. The level of
signiicance was set at .05.
Results
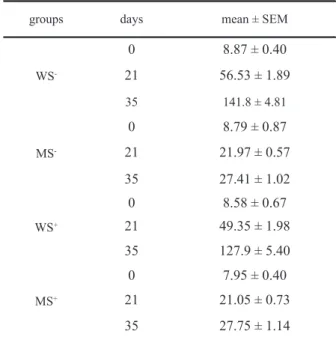
Body weight
The weights of the animals during lactation and post-lactation are presented in Table 1. The ANOVA did not show differences in birth weight [F(1,13) = 0.31; p > .05] of animals designed to different diet conditions. However, at the end of the lactation
period (21 days of age) there was a signiicant effect
of diet [F(1,100) = 466.36; p < .001], with lower
weight in malnourished animals when compared with well-nourished ones. In addition, there was a
signiicant effect of stimulation [F(1,100) = 7.75; p
< .01], with higher weight in the stimulated animals as compared with non-stimulated ones. Finally, there
was a signiicant diet by stimulation interaction
[F(1,100) = 4.61; p < .05]. At 35 days of age there
was a signiicant effect of diet [F(1,100) = 820.42;
p < .001], with lower weight in malnourished as compared with well-nourished animals. However,
CORT (mean ± SEM)
groups µg/dL groups µg/dL
WS-T- 0.78 ± 0.08 MS-T- 8.51 ± 1.43
WS-T+ 4.33 ± 0.46 MS-T+ 14.55 ± 1.08
WS+T- 4.15 ± 0.79 MS+T- 9.24 ± 1.54
WS+T+ 5.81 ± 0.83 MS+T+ 8.29 ± 1.76
Plasma protein (mean ± SEM)
Groups* g/dL groups g/dL
WS-T- 6.99 ± 0.19** MS-T- 4.44 ± 0.22#
WS-T+ 5.71 ± 0.26 MS-T+ 4.37 ± 0.30
WS+T- 6.41 ± 0.10 MS+T- 5.11 ± 0.24
WS+T+ 6.34 ± 0.21 MS+T+ 4.37 ± 0.29
groups (FC) protein (mg/g)
A x B A B
WS-T- x WS-T+ 236.4 ± 50.23 * 124.1 ± 20.71
WS+T- x WS+T+ 208.5 ± 32.80 254.7 ± 32.54
MS-T- x MS-T+ 220.6 ± 29.24 * 159.2 ± 13.46
MS+T- x MS+T+ 193.8 ± 18.18 171.1 ± 9.54
groups (ST) protein (mg/g)
A x B A B
WS-T- x WS-T+ 230.2 ± 61.93 * 119,6 ± 16.25
WS+T- x WS+T+ 264.9 ± 52.19 242.7 ± 27.42
MS-T- x MS-T+ 218.5 ± 39.75 * 144.7 ± 22.16
MS+T- x MS+T+ 155.3 ± 16.58 136.4 ± 28.54
groups (HC) protein (mg/g)
A x B A B
WS-T- x WS-T+ 233.8 ± 46.42 * 85.19 ± 12.1
WS+T- x WS+T+ 236.7 ± 35.56 267.9 ± 40.4
MS-T- x MS-T+ 296.1 ± 47.16 * 144.4 ± 12.26
MS+T- x MS+T+ 192.9 ± 11.11 175.9 ± 21.29 Table 2. Plasma CORT concentration (µg/dL) in the
experimental groups (n = 96).
Table 3. Plasma protein concentration (g/dL) in the experimental groups (n = 96).
* p < .05 compared to malnourished groups; ** p < .05 compared to WS-T+; and # p < .05 compared to MS+T-.
Table 4. Tissue protein concentration in mg/g of tissue (mean ± SEM) in the frontal cortex (FC), striatum (ST) and hippocampus (HC) of the experimental groups (n = 96).
ANOVA + Newman-Keuls post hoc: stimulation vs. test [F(1.83) = 5.61; p < .05]: NET < ET (p < .05), NET < NENT (p < .05).
ANOVA + Newman-Keuls post hoc: test [F(1.68) = 4.06; p < .05]; diet vs. stimulation [F(1.68) = 4.19; p < .05]: WS+ > MS+ (p < .05).
Frontal Cortex WS-T- WS-T+ WS+T- WS+T+
PUT n.d. n.d. n.d. n.d.
SPD 280.3 ± 26.56 * 201.4 ± 22.9 296.9 ± 24.21 308.7 ± 35.16
SPM 343.8 ± 39.44 * 159.4 ± 27.12 284.8 ± 29.84 319.3 ± 38.94
SPD+SPM 624.1 ± 61.41 * 353.2 ± 47.17 581.7 ± 43.52 628.1 ± 73.87
SPD/SPM 0.878 ± 0.08 1.35 ± 0.19 * 1.18 ± 0.14 0.98 ± 0.02
Striatum WS-T- WS-T+ WS+T- WS+T+
PUT n.d. n.d. n.d. n.d.
SPD 389.3 ± 46.1 385.8 ± 29.97 431.7 ± 23.59 460.4 ± 43.49
SPM 260 ± 29.7 271.9 ± 48.75 297.8 ± 22.22 362.8 ± 36.96
SPD+SPM 649.3 ± 66.71 657.8 ± 73.92 729.5 ± 34.6 823.2 ± 72.33
SPD/SPM 1.6 ± 0.2 2.2 ± 0.5 1.6 ± 0.1 1.2 ± 0.1
Hippocampus WS-T- WS-T+ WS+T- WS+T+
PUT 0.82 ± 0.17 0.63 ± 0.004 1.23 ± 0.24 1.23 ± 0.17
SPD 410 ± 48.42 401.1±41.26 489.7 ± 40.67 452 ± 59.94
SPM 319.8 ± 41.54 255.1 ± 49.11 360.4 ± 29.89 339.5 ± 35.93
SPD+SPM 729.8 ± 87.68 656.2 ± 85.17 850 ± 62.84 815.4 ± 93.95
SPD/SPM 1.35 ± 0.1 2.5 ± 0.5 * 1.3 ± 0.1 1.4 ± 0.1
there were no signiicant effects of stimulation or diet
by stimulation interaction.
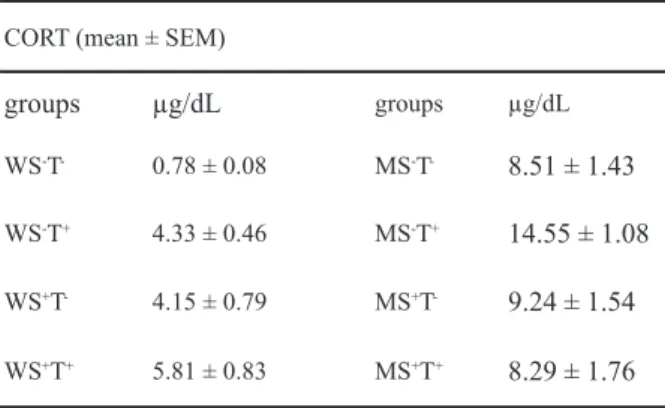
Corticosterone and plasma protein analysis
The results of the statistical analysis on plasma
CORT are presented in Table 2.
There was a signiicant effect of diet [F(1,88) =
57.89; p < .001] with malnourished presenting higher
values of CORT as compared with well-nourished animals. There was also a signiicant effect of testing
[F(1,88) = 9.70; p < .05] with tested animals presenting
higher levels of CORT when compared with non-tested
animals. No effects of stimulation were observed.
A signiicant diet by stimulation interaction was
found [F(1,88) = 9.49, p < .01]. Post-hoc analysis with the Newman-Keuls test showed that environmental stimulation
signiicantly increased CORT in well-nourished animals (p < .05) while signiicantly decreasing it in malnourished ones (p < .01). There was also a signiicant stimulation by
test interaction [F(1,88) = 7.25; p < 01] with
Newman-Keuls post-hoc analysis showing a signiicant increase
in CORT levels as the result of testing in non-stimulated
animals (p < .05), whereas testing did not alter the levels of
CORT in stimulated animals.
The results of the statistical analysis on total plasma protein are presented in Table 3.
The total plasma protein analysis showed a
signiicant effect of diet [F(1,95) = 117,76, p < .001] with
well-nourished presenting higher values as compared
with malnourished animals. There was also a signiicant
effect of testing [F(1,95) = 10.72; p < .001] with tested animals presenting lower levels of plasma protein as compared with non-tested ones. Finally, there was
also a signiicant diet by stimulation by test interaction
[F(1,95) = 8,10; p <.05]. Post-hoc analysis showed that EPM testing decreased plasma protein levels in well-nourished non-stimulated animals (p < .05) but did not affect it in stimulated well-nourished ones.
Tissue protein analysis
The results of tissue protein determination in the frontal cortex, striatum, and hippocampus are presented in Table 4.
In the frontal cortex there were no signiicant
differences due to diet, stimulation and testing factors,
but a signiicant effect of the stimulation by testing
interaction was demonstrated [F(1,83) = 5.61; p < .05].
Post-hoc analysis showed that EPM testing signiicantly
decreased protein levels in non-stimulated animals (p < .05) with no effects on stimulated ones.
In the striatum there were no signiicant differences
due to diet and stimulation factors, but there was a
signiicant effect of testing [F(1,68) = 4.06; p < .05] with
EPM tested animals presenting lower protein levels as compared with non-tested animals. There was also a
signiicant diet by stimulation interaction [F(1,68) =
4.19; p<.05] with the post-hoc analysis showing that
stimulation signiicantly increased protein levels in well-nourished (p < .05) while signiicantly decreasing
these levels in malnourished ones (p < .05).
In the hippocampus there were no signiicant
differences due to diet and stimulation factors, but there
was a signiicant effect of testing [F(1,85) = 9.07; p < .01]
with EPM tested animals presenting lower protein levels as compared with non-tested animals. There was also a
signiicant effect of the diet by stimulation interaction
[F(1,85) = 7.33, p < 01] with post-hoc analysis showing
that stimulation signiicantly increased protein levels in
well-nourished animals (p < .05) and decreased the same levels in malnourished ones (p < .05). Finally, there was
a signiicant stimulation by testing interaction [F(1,85)
= 10.96; p < .001] with the post-hoc analysis showing
that EPM testing signiicantly decreased protein levels
in non-stimulated animals (p < .05) while increasing them in stimulated ones (p < .05).
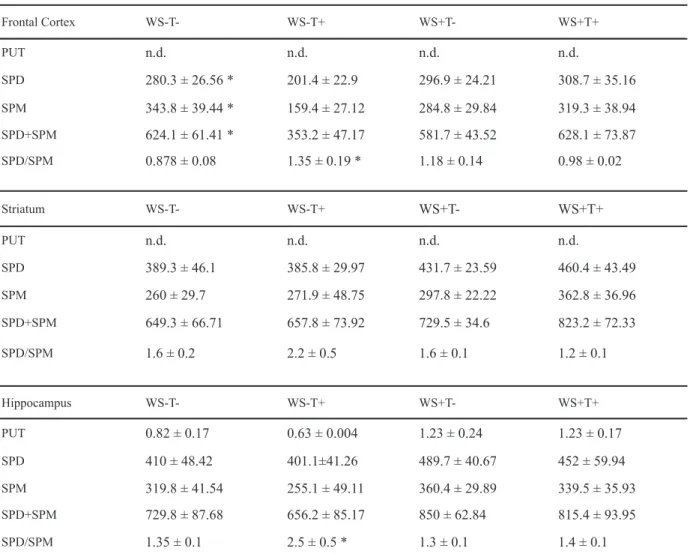
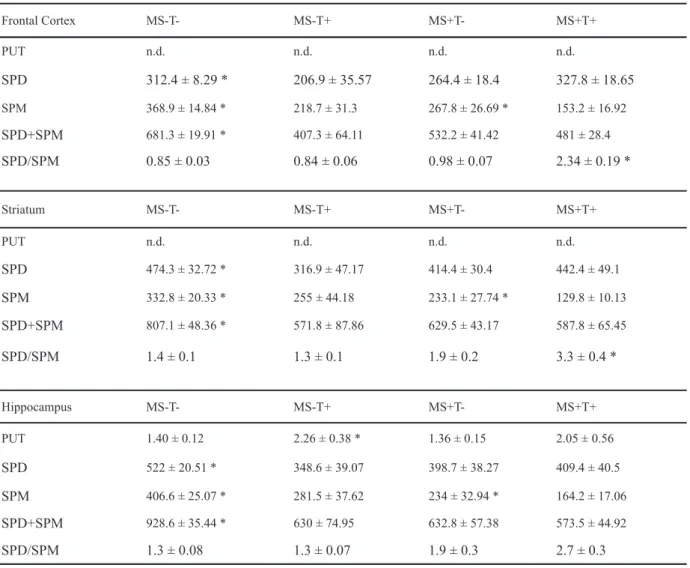
Polyamine analysis
The measures of tissue concentration of putrescine, spermidine, and spermine are presented in Tables 5 and 6.
Putrescine was not detected in the frontal cortex and striatum. In the hippocampus, there was only a
signiicant effect of diet [F(1,32) = 17.67; p < .01], with
malnourished animals presenting higher concentrations
Frontal Cortex MS-T- MS-T+ MS+T- MS+T+
PUT n.d. n.d. n.d. n.d.
SPD 312.4 ± 8.29 * 206.9 ± 35.57 264.4 ± 18.4 327.8 ± 18.65
SPM 368.9 ± 14.84 * 218.7 ± 31.3 267.8 ± 26.69 * 153.2 ± 16.92
SPD+SPM 681.3 ± 19.91 * 407.3 ± 64.11 532.2 ± 41.42 481 ± 28.4
SPD/SPM 0.85 ± 0.03 0.84 ± 0.06 0.98 ± 0.07 2.34 ± 0.19 *
Striatum MS-T- MS-T+ MS+T- MS+T+
PUT n.d. n.d. n.d. n.d.
SPD 474.3 ± 32.72 * 316.9 ± 47.17 414.4 ± 30.4 442.4 ± 49.1
SPM 332.8 ± 20.33 * 255 ± 44.18 233.1 ± 27.74 * 129.8 ± 10.13
SPD+SPM 807.1 ± 48.36 * 571.8 ± 87.86 629.5 ± 43.17 587.8 ± 65.45
SPD/SPM 1.4 ± 0.1 1.3 ± 0.1 1.9 ± 0.2 3.3 ± 0.4 *
Hippocampus MS-T- MS-T+ MS+T- MS+T+
PUT 1.40 ± 0.12 2.26 ± 0.38 * 1.36 ± 0.15 2.05 ± 0.56
SPD 522 ± 20.51 * 348.6 ± 39.07 398.7 ± 38.27 409.4 ± 40.5
SPM 406.6 ± 25.07 * 281.5 ± 37.62 234 ± 32.94 * 164.2 ± 17.06
SPD+SPM 928.6 ± 35.44 * 630 ± 74.95 632.8 ± 57.38 573.5 ± 44.92
SPD/SPM 1.3 ± 0.08 1.3 ± 0.07 1.9 ± 0.3 2.7 ± 0.3
as compared with well-nourished ones.
In relation to spermidine in the frontal cortex, there
was a signiicant effect of stimulation [F(1, 91) = 7.28; p < .01] and a signiicant interaction between stimulation
and testing [F(1, 91) = 12.67; p < .001]. Post-hoc analysis showed that while EPM testing decreased spermidine values in non-stimulated animals, they were increased in stimulated ones (p < .05). In the striatum there was only a stimulation by testing effect [F(1,94) = 4.06; p < .05], with post-hoc analysis showing that while EPM testing increased spermidine values in non-stimulated animals, it decreased those values in stimulated ones (p < .05). No effects were observed in the hippocampus.
Regarding spermine in the frontal cortex, there was
a signiicant effect of stimulation [F (1,89) = 23.34; p <
.001), with stimulated animals presenting lower values as compared with non-stimulated animals (p < .05).
There was also a signiicant diet by stimulation by testing
interaction [(F(1,89) = p < .05]. In the striatum there
was a signiicant effect of diet [F(1,91) = 6.77; p < .05]. There were also signiicant interactions between diet
and stimulation factors [F(1,91) = 14.46; p < .001] and between diet and testing factors [F(1,91) = 7.71; p < .05].
Post-hoc analysis showed that while both environmental stimulation and EPM testing increased spermine values in well-nourished animals, they produced a decrease in malnourished ones (p < .05). In the hippocampus
there was a signiicant effect of EPM testing [F(1,93)
= 7.92; p < .01], with tested animals presenting lower spermine values as compared with non-tested ones
(p < .05). There was also a signiicant diet by
stimulation interaction [F(1,93) = 17.33; p < .001], with environmental stimulation increasing spermine values in well-nourished animals, while decreasing them in malnourished ones (p < .05).
The data of spermidine + spermine in the frontal cortex
showed that there was a signiicant effect of stimulation
[F(1,90) = 14.28; p < .001], with stimulated animals presenting higher values as compared with non-stimulated
ones (p < .05). There were also signiicant interactions
between diet and stimulation factors [F(1,90) = 4.48; p < .05] and between stimulation and testing factors [F(1,90) = 13.78; p < .001]. Post-hoc analysis showed that while environmental stimulation increased spermidine + spermine values in well-nourished animals, it produced a decrease in malnourished ones (p < .05). Post-hoc analysis also showed that while EPM testing decreased spermidine + spermine values in non-stimulated animals, it did not alter the values in stimulated ones (p < .05).
Regarding the spermidine + spermine values in
the striatum, there were only signiicant interactions
between diet and stimulation [F(1,92) = 5.25; p < .05] and between diet and testing [F(1,92) = 4.55; p < .05]. Post-hoc analysis showed that while both environmental stimulation and EPM testing increased
values in well-nourished animals, these values were decreased in malnourished ones (p < .05).
The data concerning spermidine + spermine
in the hippocampus showed a signiicant effect of
stimulation [F(1,93) = 5.39; p < .05] with stimulated animals presenting lower values as compared with
non-stimulated ones. There was also a signiicant effect
of the diet by stimulation interaction [F(1,93) = 9.90; p < .05], with post-hoc analysis showing that, while stimulation increased the spermidine + spermine values in well-nourished animals, these values were decreased in malnourished ones (p < .05).
The data related to the spermidine/spermine ratio in
the frontal cortex showed signiicant effects of stimulation
[F(1,91) = 20.70; p < .001], with stimulated animals presenting higher values as compared with non-stimulated
ones, and signiicant effects of testing [F(1,91) = 22.19;
p < .001], with EPM tested animals presenting higher values as compared with non-tested ones. There were
also signiicant interactions between diet and stimulation
[F(1,91) = 24.11; p < .001], diet and testing [F(1,91) = 9.57; p < .01], and stimulation and testing [F(1,91) = 4.29; p < .05]. Finally, there was a diet by stimulation by testing interaction [F(1,91) = 35.41; p < .001].
In the striatum, the spermidine/spermine ratio
showed a signiicant effect of diet [F(1,92) = 4.11; p <
.05], with well-nourished animals presenting higher values as compared with malnourished ones. There were
also signiicant effects of stimulation [F(1,92) = 4.54; p
< .05], with stimulated animals presenting higher values
as compared with non-stimulated ones; and signiicant
effects of testing [F(1,92) = 4.98; p < .05], with EPM tested animals presenting higher values as compared with non-tested ones. The diet by stimulation factor [F(1,92) = 26.77; p < .001] and diet by stimulation by testing factors
[F(1,92) = 12.52; p < .001] were also signiicant.
Finally, in the hippocampus the spermidine/ spermine ratio showed a significant effect of testing [F(1,93) = 6.17; p < .05], with EPM tested animals presenting higher values as compared with non-tested ones. There were also significant effects of diet by stimulation [F(1,93) = 21.34; p < .001] and diet by stimulation by testing [F(1,93) = 5.56; p < .05] interactions.
Behavior in the Elevated Plus-Maze
The behavioral data in the EPM are presented in Table 7. The percentage of open arm entries showed a
signiicant effect of diet [F(1,46) = 38.70; p < .001], with
malnourished animals presenting a higher number of entries as compared with well-nourished ones. No effects of stimulation or diet by stimulation interactions were observed. This result was the same for the percentage of
time spent in the open arms with a signiicant effect of
diet only [F(1,46) = 18.66; p < .001].
significant effect of diet [F(1,46) = 9.16; p < .01], with well-nourished animals presenting a higher number of entries as compared with malnourished animals. There was also a significant effect of stimulation [F(1,46) = 6.80; p < .05], with stimulated animals entering more the closed arms as compared with non-stimulated animals.
The data on rearing behavior indicated a signiicant
effect of diet [F(1,46) = 61.11; p < .001], with well-nourished animals showing higher values as compared
with malnourished ones. There was also a signiicant
effect of stimulation [F(1,46) = 45.75; p < .001], with stimulated animals presenting higher values as compared with non- stimulated ones.
Regarding the head-dipping behavior, signiicant
effects of diet [F(1,46) = 6.11; p < .05] were found, with malnourished animals presenting higher values as compared with well-nourished ones.
In the stretch-attend behavior, a signiicant effect
of diet was found [F(1,46) = 13.95; p < .01], with well-nourished animals presenting higher values as compared with malnourished ones. There was also a
signiicant effect of stimulation [F(1,46) = 24.66; p <
.001], with stimulated animals presenting higher values as compared with non-stimulated ones.
No differences in the grooming behavior were found.
Discussion
The data reported here describe the effects of protein malnutrition and environmental stimulation on the anxiety behavior and hypothalamic-pituitary-adrenal axis activity after exposing the rat to the EPM.
The malnourished animals showed elevated basal
plasma CORT as compared with well-nourished ones
and responded with increasing levels of glucocorticoid after EPM exposure, as previously described (File, Zangrossi, Sanders, & Mabbutt, 1994; Jacobson et al.,
1997; Rodgers et al., 1999; Sobotka, Cook, & Brodie, 1974). This result conirms that protein malnutrition is a
chronic stimulus upon the activity of the HPA axis which preserves the responsivity to other stressors at the same time that it elevates the basal levels of glucocorticoids. The repetitive environmental stimulation, acting as a mild chronic stressor, may be contributing to the basal
CORT elevation in well-nourished animals. According to Dallman et al. (1987), basal plasma CORT concentration is less than 1 µg/dL in undisturbed rats with free access
to food and water. Food and water deprivation for 12
or more hours can raise plasma CORT concentration to values between 5 and 9 µg/dL (Dallman et al., 1987).
This elevation can be the result of increased central drive,
resulting in elevated secretion of CRF and ACTH during
the normal trough on adrenocortical system function. Interestingly, the fact that animals submitted to the environmental stimulation did not increase
plasma CORT levels after EPM exposure as
compared with non-stimulated animals may suggest that chronic environmental stimulation beginning at
birth (Fenoglio, Brunson, Avishai-Eliner, Chen, &
Baram, 2004) leads to adaptations in the HPA axis, which include the fastest response or less prolonged
secretion of CORT (Hess, Denenberg, Zarrow, &
Pfeifer, 1969; Jutapakdeegul et al., 2003; Plotsky & Meaney, 1993) and catecholamines (Meerlo, Horvath, Nagy, Bohus, & Koolhass, 1999) after acute stressor exposure. This fact can be due to a higher sensitivity of the HPA axis to the negative feedback, related to the increased glucocorticoid receptor expression in the rat hippocampus and frontal cortex (Jutapakdeegul et
al., 2003). Thus, the raise in CORT plasma levels, as
a result of EPM exposure, is of a smaller magnitude or peaked earlier in animals in both diet conditions submitted to the environmental stimulation.
The lower values of total plasma protein in the malnourished rats as compared with well-nourished
animals may suggest a large free CORT circulating
fraction. Gelfand, Mathews, Bier and Sherwin (1984) reported that prolonged glucocorticoid, epinephrine, and nor-epinephrine elevation in situations of severe stress
CATEGORIES / GROUP WS- MS- WS+ MS+
Open arms entrance (%) 20.32 ± 4.96 46.3 ± 1.76 * 28 ± 1.75 42.3 ± 3.67 *
Time in open arms (%) 10.46 ± 3.61 28.07 ± 3.34 * 12.99 ± 1.86 24.17 ± 4.0 *
Closed arms entries 9.25 ± 1.16 8.43 ± 0.68 12.92 ± 0.74 *† 8.92 ± 0.48
Head-dips 9.5 ± 2.1 15.36 ± 2.04 * 8.75 ± 0.98 12.25 ± 2.11 *
Rearing 9.83 ± 0.65 * 4.21 ± 0.55 15.75 ± 0.89 *† 9 ± 1.0 †††
Grooming 2.92 ± 0.68 4.86 ± 1.29 2.5 ± 0.48 2.83 ± 0.6
Stretch-attend posture 10.58 ± 1.46 * 5.36 ± 1.21 18.92 ± 1.38 *† 12.5 ± 2.11 †
Time spent in stretch-attend 38.61 ± 6.0 * 7.51 ± 1.95 35.79 ± 4.2 26.24 ± 6.10 †
contributes to the massive loss of nitrogen, muscular proteolysis, and hyper-metabolism. Wronska, Niezgoda, Sechman and Bobek (1990) described that the suppression of catabolic hormones elevation induced by stress, in food deprived animals, contributes for the decrease of the metabolic rate and preservation of corporal protein.
The present study described the decrease of tissue protein levels in the frontal cortex, striatum, and hippocampus thirty minutes after EPM testing in non-stimulated animals in both diet conditions, an effect not observed in animals previously submitted to environmental stimulation. Better stress coping conditions in the stimulated animals, which may be reflected by a shorter, less prolonged,
elevation of plasma CORT levels after the EPM test,
may be contributing to the absence of proteolysis in the same magnitude as that observed in non-stimulated animals. It is also possible that, after the exposure of stimulated animals to the EPM, the reactive catecholamines secretion is being less intense or shorter (Lucion, Pereira, Winkelman, & Sanvitto, 2003), as also described by Konarska,
Stewart and McCarty (1989) after exposure to
chronic intermittent stress. In the present study, the concentration of total plasma protein was also smaller after EPM testing in well-nourished non-stimulated animals.
To the transitory activation of the cerebral
polyamine metabolism under glucocorticoid inluence,
Gilad, Rabey, Kimiagar and Gilad (2001) referred to the polyamine stress response (PSR). PSR can
be considered as a cellular speciic biochemical
mechanism, demonstrating the capacity of the brain to control the cellular polyamines homeostasis under stressful conditions uniquely or repeatedly presented. In this work, the reaction of polyamine metabolism to the EPM exposure was observed, characterizing itself by the decrease of spermidine and spermine concentrations, and of the spermidine + spermine [SPD+SPM] pool in the frontal cortex in well-nourished non-stimulated animals, and in the frontal cortex, striatum, and hippocampus in malnourished non-stimulated animals. No differences were observed in basal spermidine and spermine levels in the three structures in animals in both diet conditions (no stimulation and no EPM testing), suggesting the plasticity of malnourished organisms in the polyamine homeostasis maintenance. The plasma
CORT elevation, fall of tissue protein concentration,
and activation of polyamines catabolism in groups under similar experimental conditions, mostly in the frontal cortex and hippocampus, suggest the interaction of these factors in the PSR observed. Thus, at the cellular level,
CORT elevation induces catabolism of polyamines,
after SSAT activation, with a decrease of tissue protein by oxidative stress, and a possibly larger quantity of free polyamines in the cytoplasm, with N1-acetylspermidine
and N1-acetylspermine eflux to the extracellular space
and the consequent decrease of the spermidine and spermine pool and, mostly, spermine with occurrence or not of variations on the SPD/SPM ratio. The altered PSR in animals previously submitted to the environmental stimulation would be explained by the different coping of the HPA axis under the stress condition, as described
above, with the PSR relecting the changes in plasma CORT concentration in these groups.
The spermidine/spermine ratio (SPD/SPM) has been used as a more reliable measure of spermidine formation from spermine during the polyamine inter-conversion cycle (Seiler & Bolkenius, 1985). Hixson, Emerson, Shassetz and Gerner (1994) reported that the SPD/SPM ratio is the less susceptible indicator to measure mistakes because it does not depend on a second measure for normalization, like the weight or protein content of the samples. It is interesting that malnourished stimulated animals, even without
signiicant alterations of CORT levels and tissue
protein concentration after EPM exposure, showed activation of the polyamine metabolism, with elevation of the SPD/SPM ratio in the frontal cortex and striatum, but not in the hippocampus, a more plastic structure due to spermine concentration fall and preservation of spermidine content.
Regarding the behavioral analysis in the EPM, as reported elsewhere (Moreira et al., 1997) protein malnutrition resulted in greater exploration of the open arms, indicating lower anxiety and/or greater impulsiveness. In addition, a higher frequency of head-dipping and a lower rate of stretch-attend behaviors were observed, indicating impairments of risk-assessment behaviors in malnourished animals. The decrease in rearing behavior, as the result of early malnutrition, may suggest impaired exploratory behavior.
Acknowledgements
The authors express gratefulness to Gilberto João Padovan, chemist of the Mass Spectrometry Laboratory
at the Nutrition Division of the Medical Clinical
References
Almeida, S.S., Garcia R.A., Cibien, M.M.R., de Araújo, M., Moreira,
G.M.S., & de Oliveira, L.M. (1994). The ontogeny of exploratory behaviors in early-protein-malnourished rats exposed to the elevated plus-maze test. Psychobiology, 22, 283-288.
Bradford, M.M. (1976). A rapid and sensitive method for the quantitation of microgram quantities of protein utilizing the principle of protein-dye binding. Analytical Biochemistry, 72, 248-254.
Dallman, M.F., Akana, S.F., Cascio, C.S., Darlington, D.N., Jacobson, L., & Levin, N. (1987). Regulation of ACTH secretion: variations
on a theme of B. Recent Progress in Hormone Research, 43, 113-173.
de Kloet, E.R., Oitlz, M.S., & Joëls, M. (1999). Stress and cognition: are corticosteroids good or bad guys? Trends in Neuroscience, 22, 422-426.
Dudkowska, M., Lai, J., Gardini, G., Stachurska, A.,
Grzelakowska-Sztabert, B., Colombatto, S., & Manteuffel-Cymborowska,
M. (2003). Agmatine modulates the in vivo biosynthesis and interconversion of polyamines and cell proliferation. Biochimica et Bophysica Ata, 1619, 159-166.
Elias, L.L., Antunes-Rodrigues, J., Elias, P.C., & Moreira, A.C. (1997).
Effect of plasma osmolality on pituitary-adrenal responses to corticotropin-releasing hormone and atrial natriuretic peptide changes in central diabetes insipidus. Journal of Endocrinology Metabolism, 82, 1243-1247.
Elias, P.C., Elias, L.L., Castro, M., Antunes-Rodrigues, J., & Moreira, A.C., (2004). Hypothalamic-pituitary-adrenal axis up-regulation
in rats submitted to pituitary stalk compression. Journal of Endocrinology, 180, 297-302.
Fenoglio K.A., Brunson, K.L., Avishai-Eliner, S., Chen, Y., & Baram,
T.Z. (2004). Region-speciic onset of handling-induced changes in corticotropin-releasing factor and glucocorticoid receptor expression. Endocrinology, 145, 2702-2706.
File, S.E., Zangrossi Jr., H., Sanders, F.L., & Mabbutt, P.S. (1994). Raised corticosterone in the rat after exposure to the elevated plus-maze. Psychopharmacology, 113, 543-546.
Fogel-Petrovic, M., Vujcic, S., Miller, J., & Porter, C.W. (1996).
Differential post-transcriptional control of ornithine decarboxylase and spermidine-spermine N1-acetyltransferase by polyamines. FEBS Letters, 391, 89-94.
Gelfand, R.A., Matthews, D.E., Bier, D.M., & Sherwin, R.S. (1984). Role of counterregulatory hormones in the catabolic response to stress. Journal of Clinical Investigation, 74, 2238-2248.
Gilad, V.H., Rabey, J.M., Kimiagar, Y., & Gilad, G.M. (2001). The
polyamine stress response: tissue-, endocrine-, and developmental-dependent regulation. Biochemical Pharmacology, 61, 207-213. Guillemin, R., Dear, W.E., & Liebelt, R.A. (1959). Nychthemeral
variations in plasma free corticosteroid levels of the rat. Proceedings of the Society for Experimental Biology and Medicine, 101, 394-395.
Halline, A.G., Dudeja, P.K., & Brasitus, T.A. (1989). 1, 2-Dimethylhydrazine-induced alterations in N1-acetylspermidine levels and spermidine N1-acetyltransferase activity in rat colonic mucosa. Cancer Research, 49, 633-638.
Hayashi, S., & Murakami, E. (1995). Rapid and regulated degradation of ornithine decarboxylase. Biochemistry Journal, 306, 1-10. Hess, J.L., Denenberg, V.H., Zarrow, M.X., & Pfeifer, W.D. (1969).
Modiication of the corticosterone response curve as a function
of handling in infancy. Physiology and Behavior, 4, 109-111. Hixson, L.J., Emerson, S.S., Shassetz, R., & Gerner, E.W. (1994).
Sources of variability in estimating ornithine decarboxylase activity and polyamine contents in human colorectal mucosa. Cancer Epidemiology, Biomarkers & Prevention, 3, 317-323. Hyvönen, T. (1989). Excretion of acetylated and free polyamines by
polyamine depleted Chinese hamster ovary cells. International Journal of Biochemistry, 21, 313-316.
Ientile, R., De Luca, G., Di Giorgio, R.M., & Macaione, S. (1988). Glucocorticoid Regulation of Spermidine acetylation in the rat brain. Journal of Neurochemistry, 51, 677-682.
Igarashi, K., & Kashiwagi, K. (2000). Polyamines: mysterious modulators of cellular functions. Biochemical and Biophysical Research Communications, 271, 559-564.
Jacobson, L., Zurakowski, D., & Majzoub, J.A. (1997). Protein malnutrition increases plasma adrenocorticotropin and anterior
pituitary proopiomelanocortin messenger ribonucleic acid in the rat. Endocrinology, 138, 1048-1057.
Jutapakdeegul, N., Casalotti, S.O., Govitrapong, P., & Kotchabhakdi, N.
(2003). Postnatal touch stimulation acutely alters corticosterone levels and glucocorticoid receptor gene expression in the neonatal rat. Developmental Neuroscience, 25, 26-33.
Konarska, M., Stewart, R.E., & McCarty, R. (1989). Habituation of
sympathetic-adrenal medullary responses following exposure to chronic intermittent stress. Physiology and Behavior, 45, 255-261.
Ladd, C.O., Owens, M.J., & Nemeroff, C.B. (1996). Persistent changes
in corticotropin-releasing factor neuronal systems induced by maternal deprivation. Endocrinology, 137, 1212-1218. Levitsky, D.A., & Strupp, B.J.E. (1995). Enduring cognitive effects of
early malnutrition: a theoretical reappraisal. Journal of Nutrition, 125, 2221S-2232S.
Lister, J.P., Blatt, G.J., DeBassio, W.A., Kemper, T.L., Tonkiss, J., Galler, J.R., & Rosene, D.L. (2005). Effect of prenatal protein malnutrition on numbers of neurons in the principal cell layers of the adult rat hippocampal formation. Hippocampus, 15, 393-403.
Löser, C., Wunderlich, U., & Fölsch, U.R. (1988). Reversed-phase liquid chromatographic separation and simultaneous luorimetric
detection of polyamines and theirs monoacetyl derivatives in human and animal urine, serum and tissue samples: an improved, rapid and sensitive method for routine application. Journal of Chromatography, 430, 249-262.
Lucion, A.B., Pereira, F.M., Winkelman, E.C., & Sanvitto, G.L.
(2003). Neonatal handling reduces the number of cells in the locus coeruleus of rats. Behavioral Neuroscience, 117, 894-903. Meerlo, P., Horvath, K.M., Nagy, G.M., Bohus, B., & Koolhass,
J.M. (1999). The inluence of postnatal handling on adult
neuroendocrine and behavioural stress reactivity. Journal of Neuroendocrinology, 11, 925-933.
Mesquita, R.M., Pereira, P.A., & Andrade, J.P. (2002). Low levels of brain-derived neurotrophic factor and tyrosine kinase receptor B are related to loss of dentate granule cells after prolonged low-protein feeding in the rat. Neuroscience Letters, 330, 155-158.
Mirescu, C., Peters, J.D., & Gould, E. (2004). Early life experience alters
response of adult neurogenesis to stress. Nature Neuroscience, 7, 841-846.
Moreira, G.M.S., de Araujo, M., de Oliveira, L.M., & Almeida, S.S. (1997). The behavior of protein-calorie-malnourished rats on the elevated plus-maze test: an ethopharmacological analysis. Psychobiology, 25, 180-185.
Morgane, P.J., Mokler, D.J., & Galler, J.R. (2002). Effects of prenatal protein malnutrition on the hippocampal formation. Neuroscience and Biobehavioral Reviews, 26, 471-483.
Pegg, A.E. (1988). Polyamine Metabolism and its importance in neoplastic growth and as a target for chemotherapy. Cancer Research, 48, 759-774.
Pegg, A.E. (2006). Regulation of ornithine decarboxylase. Journal of Biological Chemistry, 281, 14529-14532.
Pellow, S., Chopin, P., File, S., & Briley, M. (1985). Validation of
open: closed arm entries in an elevated plus-maze as a measure of anxiety in the rat. Journal of Neuroscience Methods, 14, 149-167.
Plotsky, P.M., & Meaney, M.J. (1993). Early, postnatal experience
alters hypothalamic corticotropin-releasing factor (CRF) mRNA, median eminence CRF content and stress-induced release in
adult rats. Molecular Brain Research, 18, 195-200.
Ramos, C.F., Lima, A.P.S., Teixeira, C.V., Brito, P.D., & Moura, E.G.
(1997). Thyroid function in post-weaning rats whose dams were fed a low-protein diet during suckling. Brazilian Journal of Medical and Biological Research, 30, 133-137.
Reeves, P.G., Nielsen, F.H., & Fahey Jr., G.C. (1993). AIN-93 Puriied diets for laboratory rodents: inal report of the American Institute
of Nutrition ad hoc committee on the reformulation of the AIN-76 rodent diet. Journal of Nutrition, 123, 1939-1951.
Rocinholi, L.F., Almeida, S.S., & de Oliveira, L.M. (1997). Response threshold to aversive stimuli in stimulated early protein-malnourished rats. Brazilian Journal of Medical and Biological Research, 30, 407-413.
Rodgers, R.J., Haller, J., Holmes, A., Halasz, J., Walton, T.J., & Brain,
P.F. (1999). Corticosterone response to the plus-maze: high
Behavior, 68, 47-53.
Rosenzweig, M.R., Bennet, E.L., & Diamond, M.C. (1972). Brain
changes in response to experience. Scientiic American, 226, 22-29.
Satriano, J., Ishizuka, S., Archer, D.C., Blantz, R.C., & Kelly, A.C.J.
(1999). Regulation of intracellular polyamine biosynthesis and transport by NO and cytokines TNF-alpha and IFN-gamma. American Journal of Physiology, 276, C892-C899.
Schanberg, S.M., Butler, S.R., & Suskind, M.R. (1978). Maternal behavior as a regulator of polyamine biosynthesis in brain and heart of the developing rat pup. Science, 199, 445-447. Schertel, B., & Eichler, W. (1991). Polyamine biosynthesis in arginine-starved
and refed rats. Biological Chemistry Hopper-Seyler, 372, 27-33.
Seiler, N. (2004). Catabolism of polyamines. Amino Acids, 26, 217-233. Seiler, N., & Bolkenius, F. (1985). Polyamine reutilization and
turnover in brain. Neurochemistry Research, 10, 529-544.
Shappell, N.W., Fogel-Petrovic, M.F., & Porter, C.W. (1993).
Regulation of spermidine/spermine N1-acetyltransferase by intracellular polyamine pools. FEBS Letters, 321, 179-183.
Sobotka, T.J., Cook, M.P., & Brodie, R.E. (1974). Neonatal
malnutrition: neurochemical, hormonal and behavioral manifestation. Brain Research, 65, 443 - 457.
Tabor C.W., & Tabor H. (1984). Polyamines. Annual Review of Biochemistry, 53, 749-790.
Wallace, H.M., Fraser, A.V., & Hughes, A. (2003). A perspective of polyamines metabolism. Biochemical Journal, 376, 1-14. Wronska, D., Niezgoda, J., Sechman, A., & Bobek, S. (1990). Food