Article
J. Braz. Chem. Soc., Vol. 23, No. 4, 770-781, 2012. Printed in Brazil - ©2012 Sociedade Brasileira de Química 0103 - 5053 $6.00+0.00
A
*e-mail: [email protected]
Selective and Efficient Mitochondrial Staining with Designed 2,1,3-Benzothiadiazole
Derivatives as Live Cell Fluorescence Imaging Probes
Brenno A. D. Neto,*,a José R. Corrêa,a Pedro H. P. R. Carvalho,a Diego C. B. D. Santos,a
Bruna C. Guido,a Claudia C. Gatto,a Heibbe C. B. de Oliveira,a Maíra Fasciotti,b
Marcos N. Eberlinb and Eufrânio N. da Silva Jr.c
aLaboratory of Medicinal and Technological Chemistry, Chemistry Institute, University of Brasília (UnB),
Campus Universitário Darcy Ribeiro, CP 4478, 70904-970 Brasília-DF, Brazil
bThoMSon Mass Spectrometry Laboratory, University of Campinas (UNICAMP),
13083-970 Campinas-SP, Brazil
cInstitute of Exact Sciences, Department of Chemistry,
Federal University of Minas Gerais, 31270-901 Belo Horizonte-MG, Brazil
Novos sensores planejados fluorescentes derivados do núcleo 2,1,3-benzotiadiazola foram sintetizados, caracterizados e aplicados como marcadores celulares de imageamento em vivo onde se observou exclusivamente preferência por mitocôndrias em modelos celulares de câncer de mama (MCF-7). A eficiência destes novos marcadores se mostrou muito superior ao corante comercial MitoTracker® Red. Experimentos celulares e in vitro permitiram uma compreensão
mais profunda da relação existente entre a arquitetura molecular planejada dos novos corantes e a seletividade celular observada.
Novel designed 2,1,3-benzothiadiazole fluorescent probes were synthesized, characterized and applied as live cell fluorescence imaging probe staining only mitochondria in mammalian cancer cell lines (MCF-7). The efficiency of these new probes was found to be much superior to that of the commercially available MitoTracker® Red. Cellular and in vitro experiments allowed better
understanding of the relationship between the planned molecular architecture of the new dyes and the observed cellular selectivity.
Keywords: benzothiadiazole, synthesis, mitochondria, cellular staining
Introduction
The search for more efficient and selective fluorescent cellular probes is a matter of high interest in modern chemical biology.1 Recently, the main target has been to
improve selectivity via the development of fluorescent probes able to selectively stain specific parts of the cellular machinery such as the cell nucleus, lipids, proteins and mitochondria.2,3 Among all organelles, mitochondria play
crucial role in the cell and as such are directly related to a large number of diseases and intrinsic apoptotic pathways.4
Since mitochondria can be found in dynamic networks, it is of great importance to develop highly selective fluorescent mitochondrial probes which may allow a better observation
of different cellular events involving the highly complex mitochondrial machinery.5-8
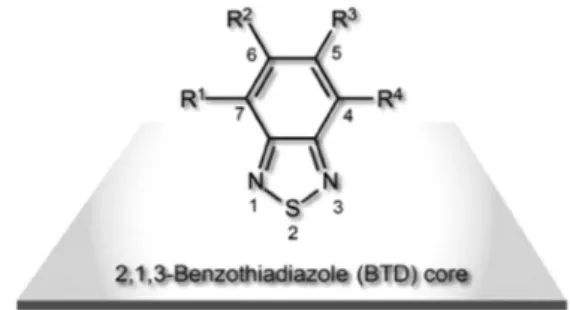
2,1,3-Benzothiadiazole derivatives (BTD, Figure 1) are widely used in many areas of light technology with several and distinctive applications.9-11 The commonly
observed efficiency of these fluorophores derived from a
direct π-extension of the BTD core renders to this nucleus high interest, normally displaying exceptional features for these fluorescent derivatives.12-14
The use of such BTD derivatives for biological applications is relative new. For instance, we used some small molecule-based BTD probes to detect and quantify dsDNA (double-stranded DNA) in solution.15 A polymeric
derivative was also used as a multicolor sensor for DNA detection and quantification.16 More recently, we and others
have independently showed the unique potential of new BTD derivatives to selectively stain cellular organelles using small molecule BTD fluorescent probes and a micellar BTD-containing system, respectively.17,18 Based
on this promising potential, we have recently reported two novel 2,1,3-benzothiadiazole BTD derivatives containing an excited state intramolecular proton transfer (ESIPT) site with impressive cellular selectivity staining only mitochondria in different cell lines.19 As a continued effort
of our group in the search of new cellular fluorescent probes, we describe herein the synthesis, photophysical, molecular architecture and application of an efficient and selective fluorescent probe based on the BTD core, which stains only mitochondria in MCF-7 cancer cell line during cell-imaging experiments.
Experimental
See Supplementary Information (SI) section for detailed experimental procedures, spectral data and analyses.
CCDC (Cambridge Crystallographic Data Centre) 863580 (BTDPyMe) contains the supplementary crystallographic data for this paper and the cif file can also be obtained from the corresponding author.
Results and Discussion
Synthesis and characterization
Scheme 1 shows the routes used to synthesize the novel fluorescent BTD derivatives.
The known compound BTDPy20 was directly treated
with iodomethane at 80 °C affording the new cationic compound BTDPyMe in 18%. BTDPy was also submitted to a straightforward Suzuki coupling protocol using an ionically-tagged catalyst, according to a procedure described elsewhere,21 affording the fluorescent probe
BTDShiny in 99% after purification.
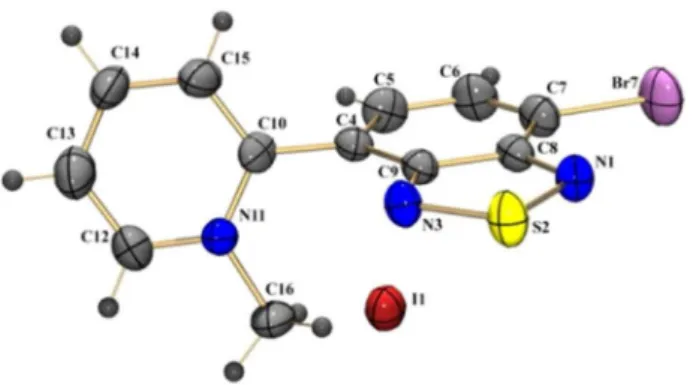
BTDPyMe, fortunately, upon recrystallization with acetone:benzene mixtures, formed well-ordered crystals, allowing X-ray diffraction characterization (from single crystal) of the novel compound (Figure 2, Table 1, also see Figure S1 and Table S1 in the SI section).
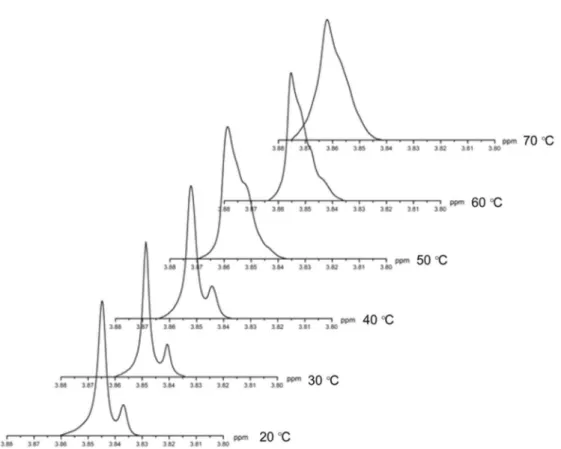
BTBShiny displayed the property of atropisomerism at room temperature (20-30 °C), which was confirmed by NMR. The two sets of signals assigned for the O-CH3 coalesced at 70 °C, pointing to the existence of
atropisomers (Figures 3 and 4). Using the methodology previously described by Shanan-Atidi and Bar-Eli,22
the interconversion barrier energy connecting these two atropisomers was determined (Figure 3). See SI section (Table S2 and Figure S4) to access all data used for the determination.
The values of the free energies of activation (∆Gǂ) of each isomer were obtained using Eyring’s equations (equations 1a and 1b) as following:
(1a)
(1b)
In the equations, kB (3.299 × 10⁻²⁷ mol kcal K-1),
h (1.584 × 10-37 kcal s) and R (1.986 × 10⁻³ kcal mol-1) are
the Boltzmann, Planck and the universal ideal gas constants, respectively. δν (Hz) is the difference between the signals of the conformers during the slow exchange process, TC is the
coalescence temperature, ∆P is the difference between the molar fractions of the species and X is a parameter iteratively obtained through the following expression (equation 2):
(2)
At room temperature, a proportion of 0.8:0.2 (anti:syn;
∆P = 0.6) was determined for the isomers of BTDShiny. Upon temperature increase, the population of syn isomers increases. At 70 °C, the signals coalesced, indicating free rotation of both substituents. The determined Figure 2. Molecular structure of BTDPyMe with crystallographic
labeling. Thermal ellipsoids are drawn at the 50% probability level.
Table 1. X-ray diffraction data collection and refinement parameters
BTDPyMe Chemical formula C12H9N3SBrI
M / (g mol-1) 434.09
Crystal system Monoclinic
Space group P21/c
Unit cell
a / Å 7.274(4)
b / Å 8.030(5)
c / Å 24.037(2)
β/ degree 95.827(4)
V / Å3 1396.90(2)
Z 4
Linear absorption coefficient / mm-1 5.287
Measured reflections 10874
Independent reflections (Rint) 2374/0.0341
Refined parameters 164
Absorption correction Multi-scan
Tmin/Tmax 0.238/0.862
Refinement method Full-matrix least-squares on F2
F(000) 824
Theta range for data collection / degree 1.70-24.69 Limiting indices −8 ≤ h ≤ 8, −9 ≤ k ≤ 9, −28 ≤ l ≤ 24 Goodness-of-fit (F2) 1.071
R1 (F) / wR2 (F2) (I > 2σ(I))a 0.0297/0.0631
Largest diffraction peak and hole / (e Å-3) 0.489 and −0.360
aR
1= |Fo – Fc|/|Fo|; wR2=[w(Fo2 – Fc2)2/(wFo2)]-1/2.
energy difference between isomers syn and anti was 0.90 Kcal mol-1. The interconversion barrier energy
(Figure 3) was 19.04 kcal mol-1 (syn → anti) and
20.14 kcal mol-1 (anti→syn).
Spectrophotometric and spectrofluorimetric analyses
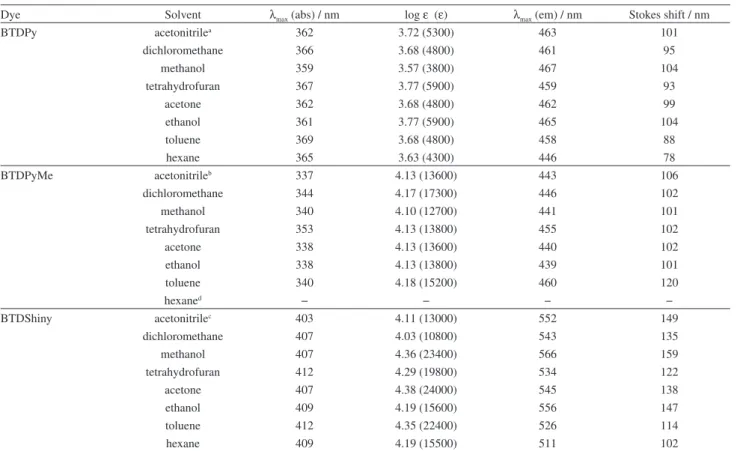
Spectrophotometric and spectrofluorimetric analyses were carried out in different solvents, and Table 2 summarizes the results.
All compounds showed efficient π-π* transitions and log ε values ranging from 3.57-3.77 (BTDPy), 4.10-4.18 (BTDPyMe) and 4.03-4.38 (BTDShiny). UV-Vis analyses gave interesting results (Figure 5). Note that the salt formation in BTDPyMe resulted in a great torsion angle considering the quaternized pyridyl and BTD groups, thus, blue shifting of the absorption maxima (337-353 nm) when compared with BTDPy (359-369 nm) due to a π-conjugation decrease. The π-extension from BTDPy to form the novel dye BTDShiny showed the opposite behavior (red shift), as expected, and the absorption maxima values were observed ranging from 403 to 412 nm.
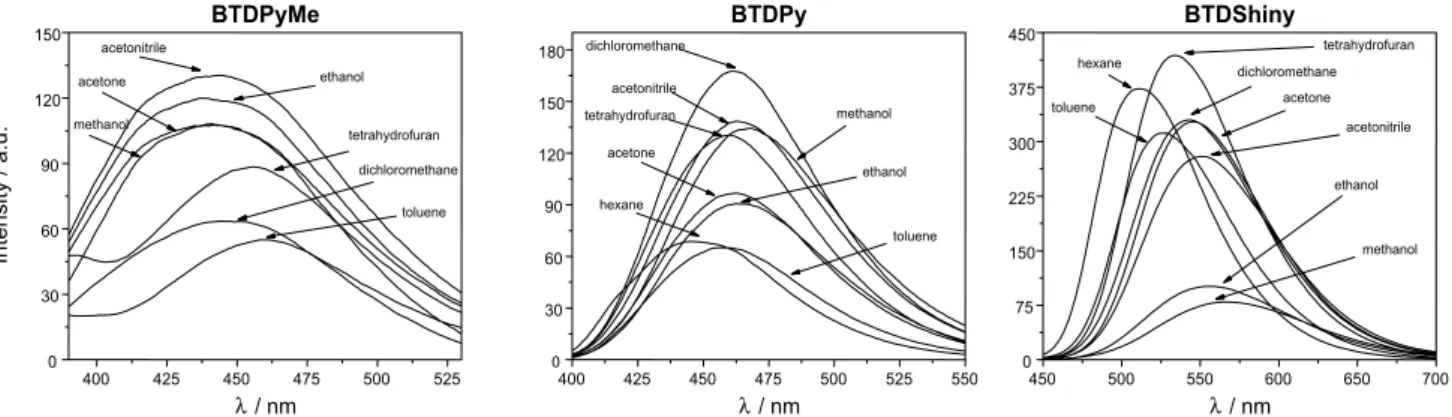
Fluorescence emissions were studied in several solvents (Figure 6). All tested compounds also showed large Stokes shifts ranging from 78-104 nm (BTDPy), 101-120 nm (BTDPyMe) and 102-159 nm (BTDShiny). These large
values indicate the high stability of the novel dyes in the excited state in all tested solvents. As expected, the large
π-extension of BTDShiny allowed the emission at higher wavelength values when compared with BTDPy and BTDPyMe and a much more intense fluorescence under the same analysis conditions. Moreover, the quantum yield of fluorescence of BTDShiny (0.85) is far larger than BTDPyMe (0.05) and BTDPy (0.48), therefore showing an outstanding efficiency of the fluorescent decay pathway from the excited state of BTDShiny.
Based on the data from Table 2 (Stokes shifts) and with the already described ETN values (solvent polarity function)23
for a plethora of solvents (with different polarities),24 the
Lippert-Mataga25 plot was constructed (Figure 7). The
relationship between the Stokes shift and the solvent polarity can therefore be evaluated as well as its influence on the emission spectra of the tested luminophores, which are related to the efficiency of the solvatochromic effect.26
In other words, the Lippert-Mataga equation evaluates the Stokes shift in terms of the change in dipole moment of the fluorophore on photoexcitation.27-29
A good linearity is observed for all fluorophores (R2 > 0.80 for all dyes) in different media, indicating high
stability of the molecules independently of the solvent, which is a characteristic generally found for 4,7-π-extended BTD derivatives.30-32
Figure 4. Temperature dependence of the 1H NMR methyl signal (300 MHz, DMSO-d
Table 2. UV-Vis absorption and fluorescence emission data (in different solvents) for BTDPy, BTDPyMe and BTDShiny
Dye Solvent λmax (abs) / nm log ε (ε) λmax (em) / nm Stokes shift / nm
BTDPy acetonitrilea 362 3.72 (5300) 463 101
dichloromethane 366 3.68 (4800) 461 95
methanol 359 3.57 (3800) 467 104
tetrahydrofuran 367 3.77 (5900) 459 93
acetone 362 3.68 (4800) 462 99
ethanol 361 3.77 (5900) 465 104
toluene 369 3.68 (4800) 458 88
hexane 365 3.63 (4300) 446 78
BTDPyMe acetonitrileb 337 4.13 (13600) 443 106
dichloromethane 344 4.17 (17300) 446 102
methanol 340 4.10 (12700) 441 101
tetrahydrofuran 353 4.13 (13800) 455 102
acetone 338 4.13 (13600) 440 102
ethanol 338 4.13 (13800) 439 101
toluene 340 4.18 (15200) 460 120
hexaned − − − −
BTDShiny acetonitrilec 403 4.11 (13000) 552 149
dichloromethane 407 4.03 (10800) 543 135
methanol 407 4.36 (23400) 566 159
tetrahydrofuran 412 4.29 (19800) 534 122
acetone 407 4.38 (24000) 545 138
ethanol 409 4.19 (15600) 556 147
toluene 412 4.35 (22400) 526 114
hexane 409 4.19 (15500) 511 102
aΦf = 0.48; bΦf = 0.05; cΦf = 0.85; dthe salt precipitates avoiding the measurement.
Figure 5. UV-Vis absorption wavelengths in different solvents for BTDPyMe, BTDPy and BTDShiny. Dye concentrations are 10 mmol L-1 in all solvents.
Theoretical calculations
In the first step of calculations, conformational analyses of all compounds (BTDPyMe, BTDPy and BTDShiny) were performed to determine the most stable conformers. Potential energy curves (PECs) were obtained performing a relaxed scan of dihedral angles (BTD ring and substituents) at B3LYP/6-31G(d) level. After obtaining the relaxed PEC scan, the located energy minima for
ground state (S0) of BTDPy and BTDPyMe structures
were also fully optimized in solution using the Beck three-parameter hybrid exchange-correlation functional
(B3LYP) in combination with 6-311+G(2d,p)/LANL2DZ basis set (i.e., LANL2DZ pseudo potential for Br and the 6-311+G(2d,p) split-valence basis set for all other atoms). In the meantime, BTDShiny was fully optimized with the second-order Møller-Plesset perturbation theory (MP2) using the 6-31G(d) basis set without any symmetry constraint. All first excited state (S1) structures were
optimized at TD-B3LYP/6-311+G(2d,p)/LANL2DZ level of calculation. The optimized geometries of S0 and S1 were
basis set. Absorption spectra are in close agreement with experimental data and have been obtained using the TD-PBE1PBE/6-311+G(2d,p) level.33 Table 3 and
Figures 8 and 9 summarize theoretical calculated data obtained for the new dyes.
All calculations were performed considering the solvent effect (water) as a prelude to future cellular experiments. Figures 8 and 9 show the optimized geometries of the three dyes (BTDPy, BTDPyMe and BTDShiny) and the electronic map in both the ground and excited states for all fluorophores. HOMO and LUMO displayed typical behavior for such molecules in the ground and excited states. The LUMO electronic map is normally seen in the BTD nuclei, whereas HOMO is distributed in the substituents, mostly in PhOMe rings.
A very important feature is depicted in Figures 8 and 9. It is seen that in the excited state, the pyridine substituent becomes coplanar with the BTD ring for BTDPy and BTDShiny, most probably with two intramolecular new hydrogen bonds. These structural arrangements allow better stabilization in the excited state; yet sustaining a higher level of planarity. For BTDShiny, an intramolecular distance of 2.15 Å (BTD nitrogen and C–H of the pyridine ring) and 2.32 Å (Py nitrogen and C–H of the BTD moiety) are calculated with very similar distances for BTDPy, that are 2.15 and 2.31 Å, respectively. For BTDPyMe, however, the steric hindrance
caused by the methyl group avoids the coplanarity between the BTD ring and the pyridinium substituent. Thus, in the excited state, there is still a large torsion angle between both rings (Table 3). As a consequence, the fluorescence intensity was very low, as experimentally observed.
Of great importance is the BTDShiny behavior in the excited state (Figure 9). Both isomers (syn and anti
atropisomers) showed the same optimized geometries (also the HOMO and LUMO electronic maps) in the excited state, meaning that both structures convert to the same situation under light irradiation. Moreover, the excited structure is the same for both atropisomers, in this way, this similarity seems to explain only one observed emission (Table 2) since the fluorescence process takes place from the very same excited structure. As noted, the optimized geometries are the same, independently if it is arriving from syn or anti
atropisomer. Therefore, the intramolecular hydrogen bond distances are those described before (2.15 and 2.32 Å).
Cell-imaging experiments and molecular architecture
We have very recently shown that monosubstituted BTD derivatives, which undergo excited state intramolecular proton transfer (ESIPT), are capable of selecting only mitochondria inside different mammalian cell models.19
In that case, however, the ESIPT process stabilizes the Figure 6. Fluorescence emissions in different solvents for BTDPyMe, BTDPy and BTDShiny. Dyes concentrations are 10 mmol L-1 in all solvents.
Figure 8. Optimized geometries and molecular orbitals (HOMO and LUMO) of BTDPy and BTDPYMe for both the ground and first excited states. All calculations were performed considering the solvent effect (simulated in water).
Figure 9. Optimized geometries and molecular orbitals (HOMO and LUMO) of BTDShiny for both the ground and first excited states. All calculations were performed considering the solvent effect (simulated in water).
molecules in the excited state and favors the fluorescence intensity. In the current case, two of the three derivatives are monosubstituted (BTDPy and BTDPyMe) and the
π-extended rings are twisted from the BTD plane. Thus, a situation in which the fluorescence intensity is not
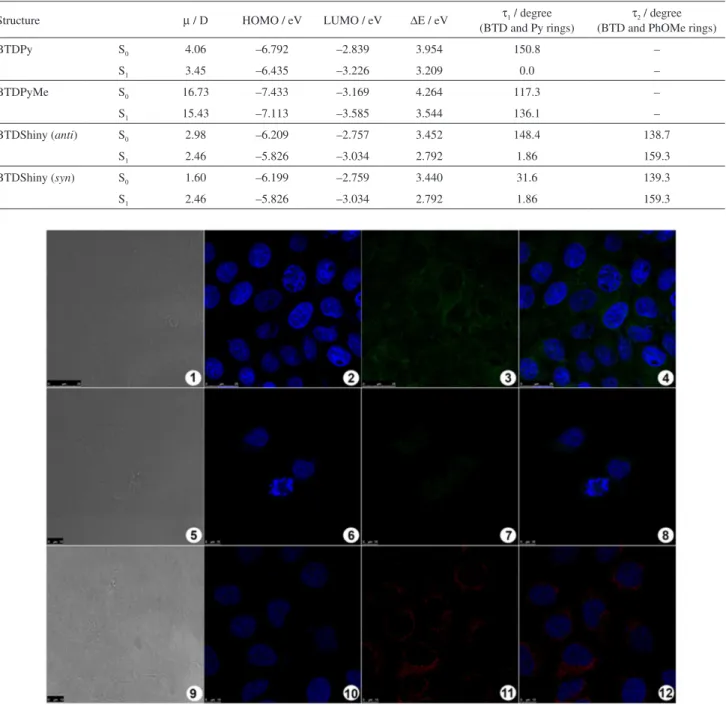
Table 3. Selected theoretical calculated data for BTDPy, BTDPyMe and BTDShiny in their ground and first excited states. All calculations were performed considering the solvent effect (simulated in water)
Structure µ / D HOMO / eV LUMO / eV ∆E / eV τ1 / degree
(BTD and Py rings)
τ2 / degree
(BTD and PhOMe rings)
BTDPy S0 4.06 –6.792 –2.839 3.954 150.8 –
S1 3.45 –6.435 –3.226 3.209 0.0 –
BTDPyMe S0 16.73 –7.433 –3.169 4.264 117.3 –
S1 15.43 –7.113 –3.585 3.544 136.1 –
BTDShiny (anti) S0 2.98 –6.209 –2.757 3.452 148.4 138.7
S1 2.46 –5.826 –3.034 2.792 1.86 159.3
BTDShiny (syn) S0 1.60 –6.199 –2.759 3.440 31.6 139.3
S1 2.46 –5.826 –3.034 2.792 1.86 159.3
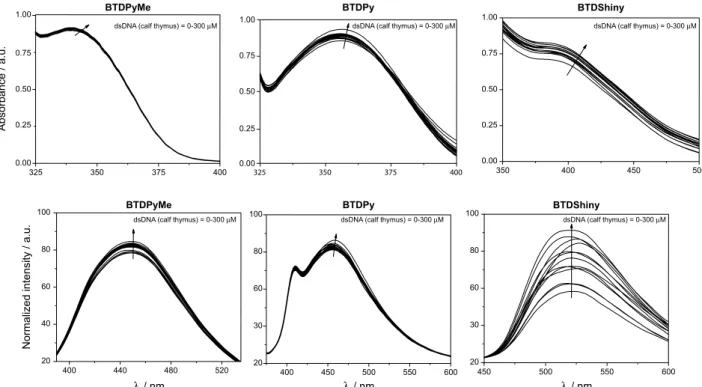
Fortunately, BTDPy is found to selectively stain mitochondria in cell-imaging experiments. But despite its high selectivity, the fluorescence signal was less intense than expected for an effective dye. It is noteworthy, however, that no fluorescence signal at all was observed for other cell organelles, including the nuclei, which could be further stained with commercially available DAPI (a blue staining). The cellular text carried out with BTDPyMe showed worse
Figure 10. MCF-7 cancer cell staining. (1, 5, 9). Phase contrast image of the cells. (2, 6, 10) Cell nuclei stained with DAPI (blue). (3) Fluorescence signal from cells incubated with compound BTDPy (green). (7) Fluorescence signal from cells incubated with compound BTDPyMe (green). (11) Fluorescence signal from cells incubated with compound MitoTracker® Red (red). Note that no nucleus was stained by using BTDPy or BTDPyMe. Overlay of all
fluorescence signals (4, 8, 12).
Figure 11. Typical spectral behavior for the spectrophotometric (top) and spectrofluorimetric (bottom) titrations of BTDPyMe, BTDPy and BTDShiny
with dsDNA. Dyes concentrations: 10.0 mmol L-1 for spectrophotometric titration and 1.0 mmol L-1 for spectrofluorimetric titration.
positive charge from the fluorophore and the phosphate backbone of the biomolecule.34,35 This enhanced interaction
usually results in a “light up” effect as a consequence of a molecular motion decrease. Unfortunately, this effect was not observed for BTDPyMe inside the cell most probably due to a very low affinity for dsDNA.
To be sure about the very low affinity of BTD derivatives with dsDNA, all dyes were assayed by both spectrophotometric and spectrofluorimetric titrations (Figure 11) against dsDNA (calf thymus).
The binding with the biomolecule should result in a different spectrum during the titrations, commonly observed through the formation of isosbestic point(s). The use of dilute solutions of the dyes (necessary for this kind of experiment) failed to reveal significant changes in the spectra, clearly showing that the three tested molecules have no significant interaction with dsDNA. BTDShiny showed only a weak interaction, as noticed in the spectrofluorimetric titrations. However, it is far worse than the fluorophores described for dsDNA detection and quantification, which normally can show a 1000-fold increase in the fluorescence intensity upon interaction.36-38
Despite the results from cell-imaging and titrations, the experiments are apparently frustrating, they clearly opened up new possibilities towards a rational design with BTD derivatives. If it is true, the first π-extension is responsible for the mitochondrial selection. Then, it is more than reasonable to envisage that the second π-extension would
result in a “light up” effect due to a large π-extension of conjugation and the possibility of intramolecular charge-transfer (ICT) process, thus increasing the fluorescence intensity and “illuminate” the selected organelle. With this idea in mind, BTDShiny was synthesized through a direct Suzuki coupling from BTDPy, as shown before (Scheme 1). The second substituent chosen was 4-MeOPh because this group allows an efficient ICT when directly attached to the BTD moiety, as proven before.39,40
To verify this hypothesis, BTDShiny was submitted to cell-imaging experiments against MCF-7 cancer cell lines (breast cancer cells) and compared with the commercially available MitoTracker® Red (Figure 12).
Figure 12. MCF-7 cancer cell staining. Cell nuclei stained with DAPI (blue). (1) Fluorescence signal from cells incubated with compound BTDShiny (green). (2) Fluorescence signal from cells incubated with compound MitoTracker® Red (red). Note that no nucleus was stained by
Very fortunately, the efficiency of BTDShiny to stain only mitochondria in the cells was outstanding. The use of BTDShiny is also quite advantageous in comparison with MitoTracker® Red, which is highly unstable, and as so must
be stored frozen (−20 °C). Moreover, the manufacture states that freezing and thawing are not options due to the high instability of this commercial marker. On the contrary, the new dye herein described (BTDShiny) is highly stable and can be stored at room temperature as a pure solid or in solution (readily available to use).
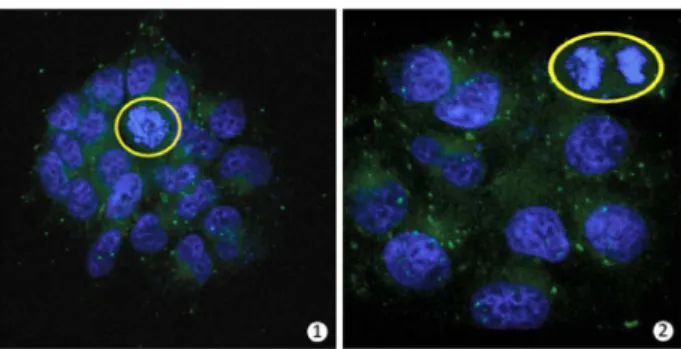
Finally, BTDShiny was tested to monitor a key cellular process (cell division cycle) to verify the possibility of studying other complex processes in which mitochondria are involved (Figure 13).
As Figure 13 shows, the cell division cycle of the MCF-7 cancer cells is clearly visualized using a combination of DAPI and the novel mitochondria marker (BTDShiny), thus allowing future studies of cancer cell death and their processes that are highly associated with mitochondrial stability. Cell death studies are crucial for
in vitro and in vivo anticancer screening tests of drug candidates. Furthermore, the use of BTDShiny also allowed the observation of mitochondrial behavior and distribution during the cell cycle (mitosis). Since there was no interaction between the new fluorophores and dsDNA, it seems reasonable to suggest that the staining occurs in the
Figure 13. MCF-7 cancer cell staining. Cell nuclei stained with DAPI (blue) and mitochondria stained with BTDShiny (green). (1) Cell division in the prometaphase step and (2) cell division in the telophase step. Note that the use of BTDShiny allows the visualization of the mitochondria during all cell division cycle.
intermembrane space rather than the mitochondrial matrix, where the dsDNA is located in the mitochondrion structure. Scheme 2 proposes a molecular architecture that explains the selectivity of BTDShiny for mitochondria.
The first π-extension is, therefore, responsible for staining only mitochondria inside the cells, despite its low fluorescence intensity. The second π-extension, however, greatly increases the fluorescence intensity and allows a stabilizing ICT process. Based on this molecular architecture, two substitutions are necessary in the di-brominated BTD intermediate in order to form outstanding mitochondrial markers.
Conclusions
The syntheses and application of rationally designed BTD derivatives based on a unique molecular architecture have been described. The photophysical properties of these new markers were investigated showing high stability of these molecules in the ground and excited states. Theoretical calculations were found to be in accordance with the expected stability of these compounds allowing better understanding of the behavior of such compounds in the excited state. Of all tested dyes, BTDShiny showed outstanding efficiency and selectivity for mitochondrial staining. A systematic study indicated that the first π-extension was responsible for that mitochondrial selection, whereas the second π-extension promotes the light up effect, thus “illuminating” the selected organelle. A cell division cycle (mitosis) was efficiently monitored by using the novel fluorophore BTDShiny, permitting the observation of the cell division steps and the mitochondrial behavior and distribution. The synthesis and successful application of BTDShiny open up a new and challenging avenue towards more efficient cell markers. The results described herein provided a baseline methodology for cellular process studies with BTD fluorophores while expanding the limits of state-of-the-art for the designing of highly selective cellular markers.
Acknowledgments
This work was partially supported by Conselho Nacional de Desenvolvimento Científico e Tecnológico (CNPq), Coordenação de Aperfeiçoamento de Pessoal de Nível Superior (CAPES), Fundação de Apoio à Pesquisa do Distrito Federal (FAPDF), INCT-Catalysis, Brasília Fundação de Empreendimentos Científicos e Tecnológicos (Finatec), Fundação de Apoio à Pesquisa do Estado de São Paulo (FAPESP), Petrobras and DPP-UnB. We are in debit with QuiCSI Team and LMC (IQ-UnB) for all support and help. Prof. Dr. Angelo H. L. Machado (DQO-IQ-UnB) is also acknowledged for insightful contributions.
Supplementary Information
Supplementary material including tables and NMR spectra is available free of charge at http://jbcs.sbq.org.br as PDF file.
References
1. Fernandez-Moreira, V.; Thorp-Greenwood, F. L.; Coogan, M. P.;
Chem. Commun.2010, 46, 186.
2. Xu, Z. C.; Baek, K. H.; Kim, H. N.; Cui, J. N.; Qian, X. H.; Spring, D. R.; Shin, I.; Yoon, J.; J. Am. Chem. Soc.2010, 132, 601. 3. Law, G. L.; Man, C.; Parker, D.; Walton, J. W.; Chem. Commun.
2010, 46, 2391.
4. Cottet-Rousselle, C.; Ronot, X.; Leverve, X.; Mayol, J. F.;
Cytometry Part A2011, 79A, 405.
5. Masanta, G.; Lim, C. S.; Kim, H. J.; Han, J. H.; Kim, H. M.; Cho, B. R.; J. Am. Chem. Soc.2011, 133, 5698.
6. Guo, D. L.; Chen, T.; Ye, D. J.; Xu, J. Y.; Jiang, H. L.; Chen, K. X.; Wang, H.; Liu, H.; Org. Lett.2011, 13, 2884.
7. Lee, S.; Chen, X. Y.; Chembiochem2011, 12, 2120.
8. Lim, C. S.; Masanta, G.; Kim, H. J.; Han, J. H.; Kim, H. M.; Cho, B. R.; J. Am. Chem. Soc.2011, 133, 11132.
9. Wang, Y. C.; Huang, J.; Zhou, H.; Ma, G. H.; Qian, S. X.; Zhu, X. H.; Dyes Pigm.2012, 92, 573.
10. Habuchi, S.; Fujita, H.; Michinobu, T.; Vacha, M.; J. Phys. Chem. B2011, 115, 14404.
11. Ellinger, S.; Graham, K. R.; Shi, P. J.; Farley, R. T.; Steckler, T. T.; Brookins, R. N.; Taranekar, P.; Mei, J. G.; Padilha, L. A.; Ensley, T. R.; Hu, H. H.; Webster, S.; Hagan, D. J.; Van Stryland, E. W.; Schanze, K. S.; Reynolds, J. R.; Chem. Mater.2011, 23, 3805.
12. Sakurai, H.; Ritonga, M. T. S.; Shibatani, H.; Hirao, T.; J. Org. Chem.2005, 70, 2754.
13. Watanabe, M.; Goto, K.; Shibahara, M.; Shinmyozu, T.; J. Org. Chem.2010, 75, 6104.
14. Haussler, M.; King, S. P.; Eng, M. P.; Haque, S. A.; Bilic, A.; Watkins, S. E.; Wilson, G. J.; Chen, M.; Scully, A. D.;
J. Photochem. Photobiol., A2011, 220, 102.
15. Neto, B. A. D.; Lapis, A. A. M.; Mancilha, F. S.; Vasconcelos, I. B.; Thum, C.; Basso, L. A.; Santos, D. S.; Dupont, J.; Org. Lett.2007, 9, 4001.
16. Chi, C. Y.; Mikhailovsky, A.; Bazan, G. C.; J. Am. Chem. Soc.
2007, 129, 11134.
17. Oliveira, F. F. D.; Santos, D.; Lapis, A. A. M.; Correa, J. R.; Gomes, A. F.; Gozzo, F. C.; Moreira, P. F.; de Oliveira, V. C.; Quina, F. H.; Neto, B. A. D.; Bioorg. Med. Chem. Lett.2010,
20, 6001.
18. Tian, Y. Q.; Wu, W. C.; Chen, C. Y.; Jang, S. H.; Zhang, M.; Strovas, T.; Anderson, J.; Cookson, B.; Li, Y. Z.; Meldrum, D.; Chen, W. C.; Jeni, A. K. Y.; J. Biomed. Mater. Res., Part A2010,
93A, 1068.
19. Neto, B. A. D.; Carvalho, P. H. P. R.; Santos, D. C. B. D.; Gatto, C. C.; Ramos, L. M.; de Vasconcelos, N. M.; Corrêa, J. R.; Costa, M. B.; de Oliveira, H. C. B.; Silva, R. G.; RSC Adv.
2012, 2, 1524.
20. Cao, H.; Cheng, J.; Chen, Q.; He, J.; He, Q.; CN101550234,
2009.
22. Shanan-Atidi, H.; Bar-Eli, K. H.; J. Phys. Chem.1970, 74, 961. 23. Ravi, M.; Soujanya, T.; Samanta, A.; Radhakrishnan, T. P.;
J. Chem. Soc., Faraday Trans.1995, 91, 2739. 24. Reichardt, C.; Chem. Rev.1994, 94, 2319.
25. Guerin, J.; Aronica, C.; Boeuf, G.; Chauvin, J.; Moreau, J.; Lemercier, G.; J. Lumin.2011, 131, 2668.
26. Manning, S. J.; Bogen, W.; Kelly, L. A.; J. Org. Chem.2011,
76, 6007.
27. Lekha, P. K.; Prasad, E.; Chem. Eur. J.2011, 17, 8609. 28. Erten-Ela, S.; Ozcelik, S.; Eren, E.; J. Fluoresc.2011, 21, 1565. 29. Ooyama, Y.; Ito, G.; Kushimoto, K.; Komaguchi, K.; Imae, I.;
Harima, Y.; Org. Biomol. Chem.2010, 8, 2756.
30. Fang, Q.; Tanimoto, A.; Yamamoto, T.; Synth. Met.2005, 150, 73.
31. Ding, P.; Chu, C. C.; Zou, Y. P.; Xiao, D. Q.; Pan, C. Y.; Hsu, C. S.; J. Appl. Polym. Sci.2012, 123, 99.
32. Neto, B. A. D.; Lopes, A. S.; Wust, M.; Costa, V. E. U.; Ebeling, G.; Dupont, J.; Tetrahedron Lett.2005, 46, 6843.
33. Fonseca, T. L.; de Oliveira, H. C. B.; Castro, M. A.; Chem. Phys. Lett.2008, 457, 119.
34. Granzhan, A.; Ihmels, H.; Org. Lett.2005, 7, 5119.
35. Wilhelmsson, L. M.; Kingi, N.; Bergman, J.; J. Med. Chem.
2008, 51, 7744.
36. Granzhan, A.; Ihmels, H.; Viola, G.; J. Am. Chem. Soc.2007,
129, 1254.
37. Ihmels, H.; Otto, D.; Top. Curr. Chem.2005, 258, 161. 38. Neto, B. A. D.; Lapis, A. A. M.; Molecules2009, 14, 1725. 39. Neto, B. A. D.; Lopes, A. S. A.; Ebeling, G.; Goncalves, R. S.;
Costa, V. E. U.; Quina, F. H.; Dupont, J.; Tetrahedron2005, 61, 10975.
40. Mancilha, F. S.; Neto, B. A. D.; Lopes, A. S.; Moreira, P. F.; Quina, F. H.; Goncalves, R. S.; Dupont, J.; Eur. J. Org. Chem.
2006, 4924.
Submitted: February 1, 2012 Published online: April 3, 2012