Copyright
© ABE&M todos os dir
eitos r
eser
vados.
Correspondence to: Cesar Luiz Boguszewski Departamento de Medicina Interna, Serviço de Endocrinologia e Metabologia, Hospital de Clínicas, UFPR
Av. Agostinho Leão Junior, 285 80030-110 – Curitiba, PR, Brasil [email protected]
Received on July/8/2009 Accepted on Aug/3/2009
Decrease in leptin production by the
adipose tissue in obesity associated
with severe metabolic syndrome
Diminuição da produção de leptina pelo tecido adiposo na obesidade associada à síndrome metabólica severa
Gilberto Jorge da Paz-Filho1, Alexei Volaco1, Henrique Lacerda Suplicy1, Rosana Bento Radominski1, Cesar Luiz Boguszewski1
ABSTRACT
Objective: To evaluate the associations between leptinemia and the components of metabolic syndrome (MetS). Methods: Fifty-one obese adults (9 men; 36.7 ± 10.0 years; body mass index (BMI) 46.2 ± 10.0 kg/m²) were submitted to clinical examination, determinations of body fat mass (BF, bioimpedance) and resting energy expenditure (REE, indirect calorimetry), and to hormonal and biochemical analysis. Patients were categorized into three groups, according to the number of criteria for MetS: Group I: none or 1; Group II: 2; and Group III: 3 or 4 crite-ria. Results: Absolute leptinemia (LepA; 37.5 ± 16.9 ng/mL) was directly correlated with BMI (r = 0.48; p = 0.0004), waist circumference (r = 0.31; p = 0.028) and BF (r = 0.52; p = 0.0001). Lep-tinemia adjusted for BF (LepBF) was inversely correlated with weight (r = -0.41; p=0.027), REE (r = -0.34; p = 0.01) and number of MetS criteria (r = -0.32; p = 0.02). There was no difference in LepA among the groups. LepBF in Group III (0.58 ± 0.27 ng/mL/kg) was significantly lower com-pared to Group I (0.81 ± 0.22 ng/mL/kg; p = 0.03) and Group II (0.79 ± 0.30 ng/mL/kg; p = 0.02).
Conclusions: Leptin production by the adipose tissue is decreased in obese subjects fulfilling three or more criteria of MetS, suggesting a state of relative leptin deficiency in obesity associ-ated with advanced stages of MetS. Arq Bras Endocrinol Metab. 2009;53(9):1088-95
Keywords
Leptin; adipokines; obesity; metabolic syndrome; leptinemia
RESUMO
Objetivo: Avaliar as associações entre leptinemia e os componentes da síndrome metabólica (MetS). Métodos: Cinquenta e um adultos obesos (9 homens, 36,7 ± 10,0 anos, índice de mas-sa corpórea, IMC, 46,2 ± 10,0 kg/m²) foram submetidos à avaliação clínica, a determinações da massa adiposa (BF, bioimpedância) e do gasto energético basal (REE, calorimetria indireta) e a análises hormonais e bioquímicas. Os pacientes foram divididos em três grupos, de acordo com o numero de critérios para MetS: Grupo I, nenhum ou 1; Grupo II: 2; e Grupo III: 3 ou 4 critérios.
Resultados: A leptinemia absoluta (LepA; 37,5 ± 16,9 ng/mL) se correlacionou diretamente a IMC (r = 0,48; p = 0,0004), circunferência abdominal (r = 0,31; p = 0,028) e BF (r = 0,52; p = 0,0001). A leptinemia ajustada por BF (LepBF) se correlacionou inversamente ao peso (r = -0,41; p = 0,027), ao REE (r = -0,34; p = 0,01) e ao número de critérios para MetS (r = -0,32; p = 0,02). Não houve diferença de LepA entre os grupos. LepBF no Grupo III (0,58 ± 0,27 ng/mL/kg) foi significativa-mente menor que no Grupo I (0,81 ± 0,22 ng/mL/kg; p = 0,03) e II (0,79 ± 0,30 ng/mL/kg; p = 0,02).
Conclusões: A produção de leptina pelo tecido adiposo está diminuída em pacientes obesos que preenchem três ou mais critérios para MetS, sugerindo um estado de deficiência relativa de lep-tina na obesidade associada a estágios avançados de MetS. Arq Bras Endocrinol Metab. 2009;53(9):1088-95
Descritores
Leptina; adipocinas; obesidade; síndrome metabólica; leptinemia 1 Serviço de Endocrinologia e
Copyright
© ABE&M todos os dir
eitos r
eser
vados.
INTRODUCTION
O
besity is a chronic disease that has reached epi-demic proportions worldwide. According to the World Health Organization (WHO), over a billion adults are overweight, and at least 300 million are obese – defined as body mass index (BMI) over 30 kg/m² (1). Among Brazilians above age 20, 40.6% are overweight and 11% are obese (2).The increasing prevalence of obesity leads to the de-velopment of common metabolic disturbances, such as atherogenic dyslipidemia, elevated arterial blood pres-sure, insulin resistance or hyperglycemia, inflammation and prothrombotic states. The association of these dis-turbances with visceral obesity is defined as metabolic syndrome (MetS) (3).
Leptin, the product of the OB gene, plays an
impor-tant role in this homeostatic system. Among other ac-tions, leptin regulates food intake stimulating hypotha-lamic anorexigenic pathways and inhibiting orexigenic ones (4,5). In addition, leptin has been associated with MetS in completely leptin-deficient animals and humans (6-11), as well as in partially-deficient models (12).
In the periphery, leptin attenuates the lipogenic and oxidative actions of insulin, increases β-oxidation of nonesterified fatty acid (NEFA) and decreases its este-rification into triacylglycerol (13). Taken together, pe-ripheral actions of leptin decrease lipogenesis and pro-tect against tissue lipotoxicity (14,15). Thus, decreased leptin production by adipose tissue might potentially contribute to the development of MetS.
Leptin has been implicated in inflammation, throm-bogenesis and fibrinolysis (16-18), but it is yet unclear whether leptin is merely a biomarker of MetS and cardio-vascular disease (16,19), or whether it is directly invol-ved in the pathogenesis of those conditions (16,20-24). In this study, we aimed to evaluate whether leptine-mia is associated with the components of MetS and its severity. To achieve that objective, we evaluated both ab-solute leptin levels (LepA) and leptin levels adjusted for body fat (LepBF) in obese subjects who fulfilled 0-1, 2 or 3-4 of the International Diabetes Federation (IDF) cri-teria for MetS (25), and correlated the values with their anthropometric, metabolic and hormonal parameters.
PATIENTS AND METHODS
Patients
This was a cross-sectional study of a consecutive co-hort of adult obese patients followed-up in the Obesity
Outpatient Clinic of the Hospital de Clínicas of Universi-dade Federal do Paraná (UFPR), Curitiba, Brazil. From June to December 2006, a total of 225 medical records from patients with BMI > 30 kg/m2 was reviewed for
the selection of patients eligible for the study. Only adult obese patients whose weight had been stable in the pre-vious three months and who agreed to participate were included. We excluded pregnant women, patients with severe comorbidities or chronic diseases, with evidence of secondary obesity due to genetic, endocrine, metabolic or neurologic disorders, and patients who received du-ring the past 12 months corticosteroids, antidiabetic the-rapy, antiobesity drugs or any other pharmacologic agent known to influence body weight or serum leptin levels.
Methods
Clinical examination and anthropometric measurements were performed by the same investigator in the mor-ning, while subjects were fasting for 12 hours. Starting from the day before measurements, patients were advi-sed not to take any drugs, not to engage into physical activity and to drink at least 2 L of water over 24 hours.
Arterial blood pressure was measured twice, while patients were sitting, with a 10-minute interval. The average of the two measurements was used for the analy-sis. Patients were weighed while wearing light street clo-thes on a digital scale with 0.01-kg increments (PL-180 LED, Filizola Balanças Industriais, São Paulo, SP, Bra-zil). Heights were measured using a stadiometer atta-ched to the same scale, with 0.5-cm increments. Waist circumference (WC) was measured with a flexible mea-suring tape with 0.1-cm increments, by placing the tape on the widest abdominal perimeter between the last rib and the iliac crest, parallel to the floor, while standing.
Body fat mass (BF, in kg) was measured by bio-electric impedanciometry (BIA 310 bioimpedan-ce analyzer, Biodynamics Corporation, Seattle, WA, USA). The Lohman equation for obese individuals was used to determine BF. Resting energy expenditure (REE) was assessed by indirect calorimetry (Deltatrac II, SensorMedics, Anaheim, CA, USA). Briefly, REE was estimated from oxygen consumption (VO2) and carbon dioxide production (VCO2) measured during 30 minutes, and extrapolated to 24 hours.
lipo-Copyright
© ABE&M todos os dir
eitos r
eser
vados.
protein (LDL) cholesterol values were obtained from Friedewald equation: LDL = TC - (HDL+TGC/5). Aliquots of blood sample were used for determination of TSH (chemiluminescence, DPC, Los Angeles, CA, normal range 0.4-4.0 µUI/mL, limit of detection 0.03 µUI/mL, CV 3.8-12.5%), free T4 (chemiluminescen-ce, DPC, Los Angeles, CA, normal range 0.8-1.8 ng/ dL, CV 4.4-9.0%), insulin (chemiluminescence, DPC, Los Angeles, CA, normal range 6-27 µUI/mL, limit of detection 2 µUI/mL, CV 3.9-4.9%), and leptin (ra-dioimmunoassay, HL-81HK, Linco Research Inc., St. Charles, MO, USA, limit of detection 0.5 ng/mL, CV 3.4-8.3%). Samples for leptin were assayed in duplicate, and the mean CV was 5.55 ± 4.68%. Leptin levels were expressed as absolute leptinemia (ng/mL; LepA) and as leptinemia adjusted for BF (ng/mL/kg; LepBF). The homeostatic model assessment of insulin resistance in-dex (HOMA-IR) was calculated according to the equa-tion: fasting glucose (mmol/L) x fasting insulin (µU/ mL) / 22.5.
Based on the clinical, anthropometric and labo-ratory data, we categorized the patients into three groups, using the IDF criteria for diagnosis of MetS (25). Those criteria require the presence of central obe-sity (defined as increased WC, adjusted for gender and different ethnic groups) associated with two or more of the following criteria:
1. elevated triglycerides (≥ 150 mg/dL) or specific treatment for hypertriglyceridemia;
2. reduced HDL cholesterol (< 50 mg/dL in fema-les and < 40 mg/dL in mafema-les) or specific treatment for this lipid abnormality;
3. elevated blood pressure (systolic ≥ 130 mmHg or diastolic ≥ 85 mmHg) or treatment for previously diagnosed hypertension;
4. elevated fasting plasma glucose (≥ 100 mg/dL) or previously diagnosed type 2 diabetes mellitus (T2DM) (25).
Patients were categorized into one of the three groups: Group I (patients with central obesity who fulfill 0 or 1 criterion for MetS), Group II (patients with central obesity who fulfill 2 criteria for MetS) and Group III (patients with central obesity who fulfill 3 or 4 criteria for MetS). Since all patients had BMI > 30 kg/m² all of them were assumed to have central obesity according to the IDF recommendations.
The study was approved by the Ethics Committee for Research in Human Beings of Hospital de Clínicas of UFPR, and a written Informed Consent was given by all subjects.
Statistical analysis was performed using the Stat-graphics Plus for Windows 3.0 (Manugistics, Inc., Ro-ckville, MD, USA) and STATISTICA 7.0 (Statsoft, Inc, Tulsa, OK, USA). Data were reported as means ± stan-dard deviation (SD), and p < 0.05 was considered to be significant. Measures of central tendency and variability were calculated for continuous variables. Synthetic ta-bles of frequency were elaborated for qualitative varia-bles. Distribution was determined by the Kolmogorov-Smirnov and Lilliefors tests. Parametric tests (ANOVA) were used when distribution was normal, whereas the Kruskal-Wallis test was used when distribution was asymmetric. Pearson’s or Spearman’s correlation coeffi-cients were used to determine the correlation between variables, according to the type of distribution.
RESULTS
The study group consisted of 51 obese participants. Six patients had obesity class I (BMI = 30-34.9 kg/m2), 11
had obesity class II (BMI = 35-39.9 kg/m2) and 34 had
obesity class III (BMI > 40 kg/m2). Table 1 shows the
main characteristics of all patients and of the subgroups according to the number of risk factors for MetS.
Weight, BMI, WC and BF were significantly higher in patients of Group III in comparison with patients of Group I (all p < 0.001). In addition, Group III had higher systolic (SBP, 131.8 ± 9.5 mmHg versus 120.6
± 11.9 mmHg; p < 0.05) and diastolic blood pressure (DBP, 84.1 ± 7.1 mmHg versus 77.7 ± 4.4; p < 0.05)
in comparison with Group I. Patients of Group I had REE of 1,560.0 ± 201.9 kcal/day – a value significan-tly lower than those observed in Group II (1,975.7 ± 325.6 kcal/day; p < 0.05) and III (2,267.1 ± 487.7 kcal/day; p < 0.001).
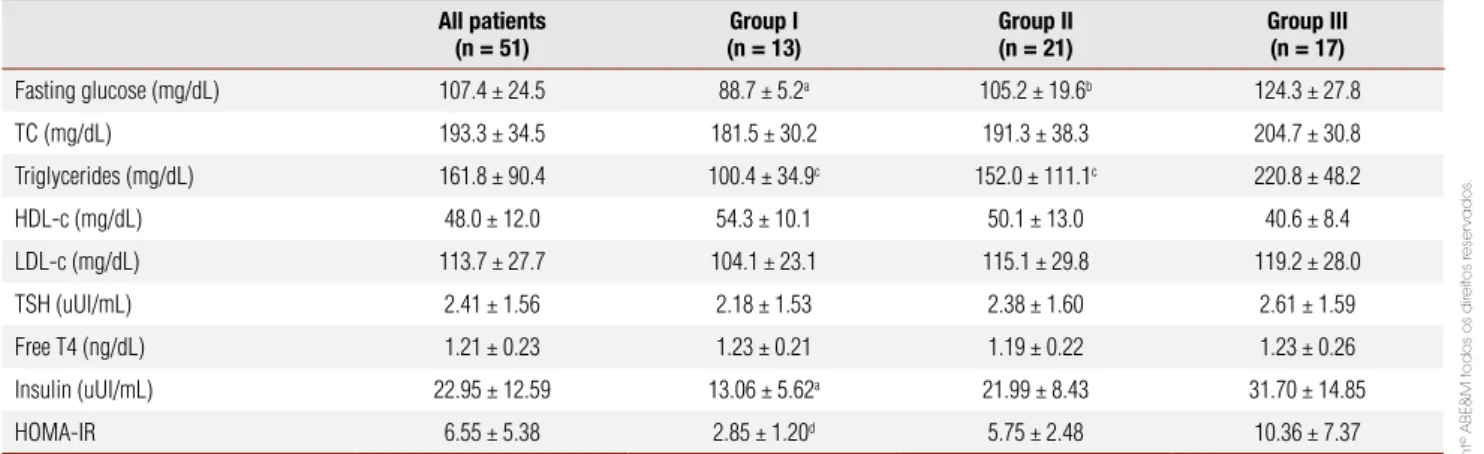
Patients in Group I had lower levels of fasting glucose (p < 0.05), triglycerides (p < 0.001), insulin (p < 0.05) and HOMA-IR (p < 0.001) in comparison with the other two groups. Fasting glucose (p < 0.05) and triglycerides levels (p < 0.001) were also lower in Group II compared to Group III. Table 2 summarizes the biochemical and hormonal findings.
Copyright
© ABE&M todos os dir
eitos r
eser
vados.
p < 0.05) and REE (r = -0.34; p = 0.01). The num-ber of risk factors for MetS did not correlate with LepA (r = -0.02; p = 0.9), but it showed a significant negative correlation with LepBF (r = -0.32; p = 0.02) (Figure 1).
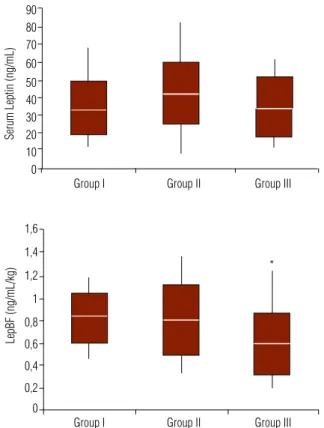
LepA did not differ among the groups (Group I: 33.59 ± 14.79 ng/mL; Group II: 42.42 ± 17.59 ng/ mL; Group III: 34.48 ± 17.01 ng/mL), regardless of significant differences in weight, BMI, WC and BF (Ta-ble 3). However, LepBF was 0.58 ± 0.27 ng/mL/kg in patients of Group III, a value significantly lower than those observed in patients of Group I (0.81 ± 0.22 ng/ mL/kg, p = 0.03) and Group II (0.79 ± 0.30 ng/mL/ kg, p = 0.02) (Figure 2). There was no clear cut-off va-lue for LepA or LepBF that could distinguish obese pa-tients according to the number of risk factors for MetS.
We have performed analysis of the LepA and LepBF for each risk factor associated with MetS separately (Ta-ble 3). In patients with hypertriglyceridemia (triglyce-rides levels ≥ 150 mg/dL, n = 26), LepBF was signi-ficantly higher than in those 25 patients with normal triglycerides levels (0.83 ± 0.26 ng/mL/kg versus 0.63
± 0.28 ng/mL/kg; p = 0.01). As shown in Table 3, LepBF tended to be lower in patients with abnormal blood pressure (0.70 ± 0.31 ng/mL/kg versus 0.78
± 0.23 ng/mL/kg), hyperglycemia (0.68 ± 0.32 ng/ mL/kg versus 0.79 ± 0.24 ng/mL/kg) and low
HDL-cholesterol (0.69 ± 0.26 ng/mL/kg versus 0.77 ± 0.32
ng/mL/kg), but none of these values reached statisti-cal significance. In contrast, LepA did not differ in the presence or absence of the risk factors.
Table 1. Characteristics of the whole cohort of patients and in each study group divided according to the number of risk factors for metabolic syndrome: Group I (0 or 1), Group II (2), and Group III (3 or 4)
All patients (n = 51)
Group I (n = 13)
Group II (n = 21)
Group III (n = 17)
Age (years) 36.7 ± 10.0 37.7 ± 8.6 35.8 ±12.1 36.9 ± 8.5
Weight (kg) 119.0 ± 28.1 97.0 ± 22.1 119.1 ± 21.8 135.2 ± 29.0a
Sex (females:males) 46:5 12:1 19:2 11:6
Race (Caucasians:Afro-Brazilians) 46:5 13:0 19:2 14:3
Weight (kg) 119 ± 28.1 97.0 ± 22.1 119.1 ± 21.8 135.2 ± 29.0a
BMI (kg/m²) 46.2 ± 10.0 39.3 ± 8.6 46.8 ± 10.2 50.6 ± 8.2a
WC (cm) 125.1 ± 18.5 114.9 ± 19.1 124.0 ± 16.7 134.3 ± 16.4b
SBP (mmHg) 127.0 ± 12.2 120.6 ± 11.9 127.1 ± 13.1 131.8 ± 9.5b
DBP (mmHg) 82.4 ± 6.5 77.7 ± 4.4 83.8 ± 5.9 84.1 ± 7.1b
BF (kg) 52.8 ± 16.5 41.3 ± 16.1 53.9 ± 14.6 60.2 ± 14.9c
REE (kcal/d) 1,967.1 ± 449.3 1,560.0 ± 201.9d 1,975.7 ± 325.6 2,267.1 ± 487.7
BMI: body mass index; WC: waist circumference; SBP: systolic blood pressure; DBP: diastolic blood pressure; BF: body fat; REE: resting energy expenditure.
a p < 0.001 versus Group I; b p < 0.05 versus Group I; c p < 0.01 versus Group I; d p < 0.05 versus Group II and p < 0.001 versus Group III.
Table 2. Biochemical and hormonal parameters of the whole cohort of patients and in each study group divided according to number of risk factors for metabolic syndrome: Group I (0 or 1), Group II (2), and Group III (3 or 4)
All patients (n = 51)
Group I (n = 13)
Group II (n = 21)
Group III (n = 17)
Fasting glucose (mg/dL) 107.4 ± 24.5 88.7 ± 5.2a 105.2 ± 19.6b 124.3 ± 27.8
TC (mg/dL) 193.3 ± 34.5 181.5 ± 30.2 191.3 ± 38.3 204.7 ± 30.8
Triglycerides (mg/dL) 161.8 ± 90.4 100.4 ± 34.9c 152.0 ± 111.1c 220.8 ± 48.2
HDL-c (mg/dL) 48.0 ± 12.0 54.3 ± 10.1 50.1 ± 13.0 40.6 ± 8.4
LDL-c (mg/dL) 113.7 ± 27.7 104.1 ± 23.1 115.1 ± 29.8 119.2 ± 28.0
TSH (uUI/mL) 2.41 ± 1.56 2.18 ± 1.53 2.38 ± 1.60 2.61 ± 1.59
Free T4 (ng/dL) 1.21 ± 0.23 1.23 ± 0.21 1.19 ± 0.22 1.23 ± 0.26
Insulin (uUI/mL) 22.95 ± 12.59 13.06 ± 5.62a 21.99 ± 8.43 31.70 ± 14.85
HOMA-IR 6.55 ± 5.38 2.85 ± 1.20d 5.75 ± 2.48 10.36 ± 7.37
TC: total cholesterol; HOMA-IR: homeostatic model assessment of insulin resistance index.
Copyright
© ABE&M todos os dir
eitos r
eser
vados.
Table 3. Absolute serum levels of leptin (LepA) and leptinemia adjusted for BF (LepBF) according to the presence or absence of risk factors for metabolic syndrome
Blood pressure Fasting glucose Triglycerides HDL-c
Normal (n = 15)
High (n = 36)
Normal (n = 24)
High (n = 27)
Normal (n = 26)
High (n = 25)
Normal (n = 24)
Low (n = 27)
LepA (ng/mL) 40.2 (16.3) 36.4 (17.3) 35.3 (13.5) 39.5 (19.5) 40.4 (16.5) 34.8 (17.2) 36.6 (18.6) 38.3 (15.6)
LepBF (ng/mL/kg) 0.78 (0.23) 0.70 (0.31) 0.79 (0.24) 0.68 (0.32) 0.83 (0.26) 0.63 (0.28)* 0.77 (0.32) 0.69 (0.26)
Data shown as mean (SD).
* p = 0.01 versus normal triglycerides.
Figure 1. Correlations between absolute serum leptin levels (LepA; ng/mL) and leptinemia adjusted for body fat (LepBF; ng/mL/kg) with the number of risk factors for MetS.
Figure 2. Serum levels of leptin (ng/mL) and leptinemia adjusted for body fat (LepBF; ng/mL/kg) in the study groups divided according to number of risk factors for metabolic syndrome: Group I (0 or 1), Group II (2), and Group III (3 or 4). Asterisk denotes p value of 0.03 versus Group I and 0.02 versus Group II.
DISCUSSION
In our cohort of obese individuals, although LepA was positively correlated with weight, BMI, WC and BF as expected, no associations were found between LepA and any component of MetS. In addition, LepA was not associated with severity of MetS since its levels were similar among patients with different degrees of MetS. However, we did observe that leptin levels adjusted for body fat mass (LepBF) were significantly decreased in obese patients with at least three risk factors for MetS. The fact that LepBF was negatively correlated with the number of risk factors provides further evidence that LepBF may be associated with the severity of MetS.
There have been reports showing positive correla-tion between leptinemia and risk factors associated with MetS, such as hypertension (26,27), DM (28), hyper-triglyceridemia and low HDL-cholesterol (29). Howe-ver, several studies have been unable to replicate the-se findings (30-37). It is likely that the contradictions among the studies arise from the fact that leptinemia is not adjusted for the amount of BF in most studies. By adjusting leptinemia we could, for the first time, identi-fy correlations between leptin and MetS. In agreement with our results, another study has clearly demonstrated that high leptin levels have protective actions against the development of diabetes in obesity (38).
LepA (ng/mL)
LepBF (ng/mL/kg)
r= -0.32 p= 0.02 r= -0.02 p= 0.9 (NS)
0 1 2 3 4
Risk factors for MetS (n) 1,6
1,4
1,2 1 0,8
0,6 0,4
0,2 0 90 80 70 60 50 40 30 20 10 0
Serum Leptin (ng/mL)
LepBF (ng/mL/kg)
Group I Group II
*
Group III 1,6
1,4
1,2
1
0,8
0,6
0,4
0,2 0 90 80 70 60 50 40 30 20 10 0
Copyright
© ABE&M todos os dir
eitos r
eser
vados.
In this study, we showed that obese patients with three or more criteria for MetS have lower levels of lep-tin adjusted to fat body mass (LepBF), when compared to their obese counterparts with less than three criteria. This observation was not true when LepA was consi-dered. Moreover, we could not establish cut-off values of leptinemia in order to predict the number of criteria fulfilled for MetS. Several studies showed positive cor-relations between leptinemia and the criteria for MetS, such as hypertension, DM, hypertriglyceridemia and low HDL-c. However, other studies did not replicate those findings. It is possible that these contradictions are attributed to the fact that some of these studies did not adjust leptinemia to the parameters of obesity (wei-ght, BMI and BF) (39). However, when leptinemia is adjusted to those parameters, high leptin levels may have protective action against the development of dia-betes in obese patients, in concordance to our findings. Although the correlation between leptinemia and body weight is unquestionable, we (40) and other in-vestigators (34,41-43) have documented high variabili-ty of leptin levels among patients with similar BMI and BF, particularly in obesity. As a consequence, not all obese patients with BMI greater than 40 kg/m2
pre-sent with extremely high levels of leptin, as it would be expected. This is true even in the monogenic syndrome of obesity caused by mutations in the leptin receptor, where circulating levels of leptin are highly variable among affected individuals and not disproportionately elevated (44). In our series, 34 out of 51 subjects had severe obesity with BMI above 40 kg/m2. Within this
subgroup, leptin levels varied 7-fold (from 11.6 ng/mL to 81.9 ng/mL; data not shown). Although common obesity is mostly related to leptin-resistance, a subgroup of subjects with severe obesity and inappropriately low circulating levels of leptin was identified in our study by using LepBF instead of LepA in the analysis. In this sub-group of patients, disproportionately low production of leptin by the adipose tissue, and not leptin-resistance, is the possible mechanism to explain their excessive body weight and metabolic abnormalities. In agreement with that observation, mice partially deficient in leptin under high-fat feeding show an increased risk of obesity, he-patic steatosis, glucose intolerance, and hyperlipidemia (45). Moreover, humans heterozygous for mutations of the OB gene with partial leptin deficiency have an
incre-ased prevalence of overweight and obesity (12).
In our study, LepBF was inversely correlated with weight and REE. These findings support the evidence
that more obese patients – and, therefore, with higher REE, have disproportionately lower leptin levels adjus-ted for their fat mass. Moreover, the analysis of indivi-dual components of the MetS showed a significant as-sociation of low LepBF and hypertriglyceridemia. This finding might be explained by the antilipogenic and pro-lipolytic effects of leptin on the metabolism of fat-ty acids (33,35,46,47). In addition, we observed that LepBF tended to be lower in patients with abnormal blood pressure, hyperglycemia and low HDL-choleste-rol, although the values did not reach significance.
Peripheral effects of leptin decreases lipogenesis and protects against excessive weight gain, both acutely and chronically. Accordingly, reduced peripheral actions of leptin would lead to increased lipogenesis and accumu-lation of lipids in sites other than the adipose tissue – a phenomenon known as lipotoxicity (14,15). There is strong evidence that lipotoxicity takes part in the de-velopment of several components of the MetS, such as hepatic steatosis, insulin resistance, dyslipidemia, beta cell failure and T2DM (48,49). When comparing equal masses of visceral and subcutaneous adipose tissue, both secrete similar amounts of lipids to the bloodstre-am, whereas visceral fat secretes less leptin. In our pa-tients who presented with three or four risk factors for MetS, low leptin levels might reflect the lack of balance between lipid and leptin secretion by visceral and sub-cutaneous adipose tissue (50). Consequently, less leptin might be available to the peripheral tissues, which may predispose to lipotoxicity and the development of co-morbidities associated with MetS in these individuals. However, there was no clear cut-off value of LepBF to identify obese patients with high risk for MetS.
Copyright
© ABE&M todos os dir
eitos r
eser
vados.
more homogeneous study group for the analysis, avoi-ding various confounavoi-ding factors that might influence body weight, LepA and LepBF.
In conclusion, we have found that obese patients with three or more risk factors for MetS, especially tho-se with hypertriglyceridemia, have lower levels of Le-pBF when compared to their obese counterparts with less than three risk factors and normal triglycerides. Considering that our patients with three or more risk factors were heavier and had more elevated triglycerides in comparison with the other groups, and that LepA did not differ among the study groups, our LepBF fin-dings suggest a state of relative leptin deficiency in obe-sity associated with more advanced stages of MetS. If this hypothesis proves to be true in future studies thera-py with leptin or some agonists will be useful in selected obese patients to prevent or to ameliorate some com-ponents of MetS, as already reported in various forms of relative leptin deficiency, such as anorexia nervosa, milder forms of hypothalamic amenorrhea, and conge-nital or acquired lipodystrophy (52).
Disclosure: no potential conflict of interest relevant to this article was reported.
REFERENCES
1. Obesity: preventing and managing the global epidemic.
Re-port of a WHO consultation. World Health Organ Tech Rep Ser. 2000;894:i-xii,1-253.
2. IBGE [Internet]. Pesquisa de Orçamentos Familiares - 2002-2003. Comunicação Social [cited 2009 Mar 10]; Available from: http:// www.ibge.gov.br/home/presidencia/noticias/noticia_impres-sao.php?id_noticia=278.
3. Eckel RH, Grundy SM, Zimmet PZ. The metabolic syndrome. Lan-cet. 2005;365(9468):1415-28.
4. Morton GJ, Cummings DE, Baskin DG, Barsh GS, Schwartz MW. Central nervous system control of food intake and body weight. Nature. 2006;443(7109):289-95.
5. Woods SC, D’Alessio DA. Central control of body weight and appetite. J Clin Endocrinol Metab. 2008;93(11 Suppl 1):S37-50.
6. Farooqi IS, Jebb SA, Langmack G, Lawrence E, Cheetham CH,
Pren-tice AM, et al. Effects of recombinant leptin therapy in a child with congenital leptin deficiency. N Engl J Med. 1999;341(12):879-84.
7. Farooqi IS, Matarese G, Lord GM, Keogh JM, Lawrence E, Agwu
C, et al. Beneficial effects of leptin on obesity, T cell hyporespon-siveness, and neuroendocrine/metabolic dysfunction of human congenital leptin deficiency. J Clin Invest. 2002;110(8):1093-103. 8. Gibson WT, Farooqi IS, Moreau M, DePaoli AM, Lawrence E,
O’Rahilly S, et al. Congenital leptin deficiency due to homozygo-sity for the Delta133G mutation: report of another case and eva-luation of response to four years of leptin therapy. J Clin Endocri-nol Metab. 2004;89(10):4821-6.
9. Licinio J, Caglayan S, Ozata M, Yildiz BO, de Miranda PB, O’Kirwan F, et al. Phenotypic effects of leptin replacement on morbid obe-sity, diabetes mellitus, hypogonadism, and behavior in leptin-deficient adults. Proc Natl Acad Sci U S A. 2004;101(13):4531-6.
10. Montague CT, Farooqi IS, Whitehead JP, Soos MA, Rau H, Wa-reham NJ, et al. Congenital leptin deficiency is associated with se-vere early-onset obesity in humans. Nature. 1997;387(6636):903-8. 11. Ozata M, Ozdemir IC, Licinio J. Human leptin deficiency caused
by a missense mutation: multiple endocrine defects, decreased sympathetic tone, and immune system dysfunction indicate new targets for leptin action, greater central than peripheral resistan-ce to the effects of leptin, and spontaneous correction of leptin-mediated defects. J Clin Endocrinol Metab. 1999;84(10):3686-95. 12. Farooqi IS, Keogh JM, Kamath S, Jones S, Gibson WT, Trussell
R, et al. Partial leptin deficiency and human adiposity. Nature. 2001;414(6859):34-5.
13. Muoio DM, Lynis Dohm G. Peripheral metabolic actions of leptin. Best Pract Res Clin Endocrinol Metab. 2002;16(4):653-66. 14. Muoio DM, Dohm GL, Fiedorek FT Jr, Tapscott EB, Coleman RA.
Leptin directly alters lipid partitioning in skeletal muscle. Diabe-tes. 1997;46(8):1360-3.
15. Muoio DM, Dohm GL, Tapscott EB, Coleman RA. Leptin opposes insulin’s effects on fatty acid partitioning in muscles isolated from obese ob/ob mice. Am J Physiol. 1999;276(5 Pt 1):E913-21. 16. Beltowski J. Leptin and atherosclerosis. Atherosclerosis.
2006;189(1):47-60.
17. Eriksson M, Johnson O, Boman K, Hallmans G, Hellsten G, Nils-son TK, et al. Improved fibrinolytic activity during exercise may be an effect of the adipocyte-derived hormones leptin and adipo-nectin. Thromb Res. 2008;122(5):701-8.
18. Paz-Filho GJ, Andrews D, Esposito K, Erol HK, Delibasi T, Wong ML, et al. Effects of leptin replacement on risk factors for car-diovascular disease in genetically leptin-deficient subjects. Horm Metab Res. 2009;41(2):164-7.
19. van Dielen FM, van’t Veer C, Schols AM, Soeters PB, Buurman WA, Greve JW. Increased leptin concentrations correlate with increa-sed concentrations of inflammatory markers in morbidly obese individuals. Int J Obes Relat Metab Disord. 2001;25(12):1759-66. 20. Brennan AM, Li TY, Kelesidis I, Gavrila A, Hu FB, Mantzoros CS.
Circulating leptin levels are not associated with cardiovascular morbidity and mortality in women with diabetes: a prospective cohort study. Diabetologia. 2007;50(6):1178-85.
21. Lawlor DA, Smith GD, Kelly A, Sattar N, Ebrahim S. Leptin and coronary heart disease risk: prospective case control study of Bri-tish women. Obesity (Silver Spring). 2007;15(7):1694-701. 22. Piemonti L, Calori G, Mercalli A, Lattuada G, Monti P,
Garanci-ni MP, et al. Fasting plasma leptin, tumor necrosis factor-alpha receptor 2, and monocyte chemoattracting protein 1 concentra-tion in a populaconcentra-tion of glucose-tolerant and glucose-intolerant women: impact on cardiovascular mortality. Diabetes Care. 2003;26(10):2883-9.
23. Söderberg S, Ahren B, Jansson JH, Johnson O, Hallmans G, As-plund K, et al. Leptin is associated with increased risk of myocar-dial infarction. J Intern Med. 1999;246(4):409-18.
24. Wallace AM, McMahon AD, Packard CJ, Kelly A, Shepherd J, Gaw A, et al. Plasma leptin and the risk of cardiovascular disease in the west of Scotland coronary prevention study (WOSCOPS). Circula-tion. 2001;104(25):3052-6.
25. Alberti KG, Zimmet P, Shaw J. Metabolic syndrome – a new world-wide definition. A Consensus Statement from the Interna-tional Diabetes Federation. Diabet Med. 2006;23(5):469-80. 26. Agata J, Masuda A, Takada M, Higashiura K, Murakami H,
Miya-zaki Y, et al. High plasma immunoreactive leptin level in essential hypertension. Am J Hypertens. 1997;10(10 Pt 1):1171-4.
Copyright
© ABE&M todos os dir
eitos r
eser
vados.
28. McNeely MJ, Boyko EJ, Weigle DS, Shofer JB, Chessler SD, Leon-netti DL, et al. Association between baseline plasma leptin levels and subsequent development of diabetes in Japanese Ameri-cans. Diabetes Care. 1999;22(1):65-70.
29. Valle M, Gascon F, Martos R, Bermudo F, Ceballos P, Suanes A. Relationship between high plasma leptin concentrations and me-tabolic syndrome in obese pre-pubertal children. Int J Obes Relat Metab Disord. 2003;27(1):13-8.
30. Seck T, Englaro P, Blum WF, Scheidt-Nave C, Rascher W, Ziegler R, et al. Leptin concentrations in serum from a randomly recruited sample of 50- to 80-year-old men and women: positive associa-tion with plasma insulin-like growth factors (IGFs) and IGF-bin-ding protein-3 in lean, but not in obese, individuals. Eur J Endo-crinol. 1998;138(1):70-5.
31. Wang G, Tang J, Chen M. [Association of serum leptin con-centrations with blood pressure]. Zhonghua Yi Xue Za Zhi. 1999;79(9):664-7.
32. Abdelgadir M, Elbagir M, Eltom M, Berne C, Ahren B. Reduced leptin concentrations in subjects with type 2 diabetes mellitus in Sudan. Metabolism. 2002;51(3):304-6.
33. Haluzik M, Fiedler J, Nedvidkova J, Ceska R. Serum leptin levels in patients with hyperlipidemias. Nutrition. 2000;16(6):429-33. 34. Liuzzi A, Savia G, Tagliaferri M, Lucantoni R, Berselli ME,
Petro-ni ML, et al. Serum leptin concentration in moderate and severe obesity: relationship with clinical, anthropometric and metabolic factors. Int J Obes Relat Metab Disord. 1999;23(10):1066-73. 35. Marinari GM, Scopinaro N, Adami GF. Leptin and
HDL-cho-lesterol in non-diabetic normotensive subjects. Obes Surg. 2001;11(3):252-3.
36. Marita AR, Sarkar JA, Rane S. Type 2 diabetes in non-obese In-dian subjects is associated with reduced leptin levels: study from Mumbai, Western India. Mol Cell Biochem. 2005;275(1-2):143-51. 37. Sayeed MA, Azad Khan AK, Mahtab H, Ahsan KA, Banu A,
Kha-nam PA, et al. Leptin is reduced in lean subjects with type 2 dia-betes in bangladesh. Diadia-betes. Care. 2003;26(2):547.
38. Schmidt MI, Duncan BB, Vigo A, Pankow JS, Couper D, Ballantyne CM, et al. Leptin and incident type 2 diabetes: risk or protection? Diabetologia. 2006;49(9):2086-96.
39. Hu FB, Chen C, Wang B, Stampfer MJ, Xu X. Leptin concentra-tions in relation to overall adiposity, fat distribution, and blood pressure in a rural Chinese population. Int J Obes Relat Metab Disord. 2001;25(1):121-5.
40. Rodrigues AM, Radominski RB, Suplicy Hde L, De Almeida SM, Niclewicz PA, Boguszewski CL. The cerebrospinal fluid/serum lep-tin ratio during pharmacological therapy for obesity. J Clin Endo-crinol Metab. 2002;87(4):1621-6.
41. Considine RV, Sinha MK, Heiman ML, Kriauciunas A, Stephens TW, Nyce MR, et al. Serum immunoreactive-leptin concen-trations in normal-weight and obese humans. N Engl J Med. 1996;334(5):292-5.
42. Havel PJ, Kasim-Karakas S, Mueller W, Johnson PR, Gingerich RL, Stern JS. Relationship of plasma leptin to plasma insulin and adi-posity in normal weight and overweight women: effects of dieta-ry fat content and sustained weight loss. J Clin Endocrinol Metab. 1996;81(12):4406-13.
43. Ostlund RE Jr, Yang JW, Klein S, Gingerich R. Relation between plasma leptin concentration and body fat, gender, diet, age, and metabolic covariates. J Clin Endocrinol Metab. 1996;81(11):3909-13. 44. Farooqi IS, Bullmore E, Keogh J, Gillard J, O’Rahilly S, Fletcher
PC. Leptin regulates striatal regions and human eating behavior. Science. 2007;317(5843):1355.
45. Begriche K, Letteron P, Abbey-Toby A, Vadrot N, Robin MA, Bado A, et al. Partial leptin deficiency favors diet-induced obesity and related metabolic disorders in mice. Am J Physiol Endocrinol Me-tab. 2008;294(5):E939-51.
46. Dyck DJ, Heigenhauser GJ, Bruce CR. The role of adipokines as regulators of skeletal muscle fatty acid metabolism and insulin sensitivity. Acta Physiol (Oxf). 2006;186(1):5-16.
47. Paz-Filho GJ, Ayala A, Esposito K, Erol HK, Delibasi T, Hurwitz BE, et al. Effects of leptin on lipid metabolism. Horm Metab Res. 2008;40(8):572-4.
48. Shulman GI. Cellular mechanisms of insulin resistance. J Clin In-vest. 2000;106(2):171-6.
49. Unger RH. Minireview: weapons of lean body mass destruction: the role of ectopic lipids in the metabolic syndrome. Endocrinolo-gy. 2003;144(12):5159-65.
50. Unger RH. Lipid overload and overflow: metabolic trauma and the metabolic syndrome. Trends Endocrinol Metab. 2003;14(9):398-403. 51. Caro JF, Kolaczynski JW, Nyce MR, Ohannesian JP, Opentanova
I, Goldman WH, et al. Decreased cerebrospinal-fluid/serum leptin ratio in obesity: a possible mechanism for leptin resistance. Lan-cet. 1996;348(9021):159-61.