Nota Técnica
*e-mail: [email protected]
DETERMINATION OF LEVODOPA IN HUMAN PLASMA BY HIGH PERFORMANCE LIQUID CHROMATOGRAPHY–TANDEM MASS SPECTROMETRY (HPLC–MS/MS): APPLICATION TO A BIOEQUIVALENCE STUDY
Heliana F. Martins, Douglas P. Pinto e Viviane de A. Nascimento
Laboratório de Farmacocinética, Fundação Oswaldo Cruz, Av. Brasil, 4365, 21040-900 Rio de Janeiro – RJ, Brasil
Marlice A. S. Marques
Departamento de Química Analítica, Instituto de Química, Universidade Federal do Rio de Janeiro, Av. Athos da Silveira Ramos, 149, 21949-900 Rio de Janeiro – RJ, Brasil
Fábio C. Amendoeira*
Instituto Nacional de Controle de Qualidade em Saúde, Fundação Oswaldo Cruz, Av. Brasil, 4365, 21040-900 Rio de Janeiro – RJ, Brasil
Recebido em 26/3/12; aceito em 17/7/12; publicado na web em 7/12/12
A sensitive, accurate and simple method using HPLC-MS/MS was developed and validated for levodopa quantitation in human plasma. Analysis was achieved on a pursuit® C18 analytical column (5 µm; 150 x 4.6 mm i.d.) using a mobile phase (methanol and water , 90:10, v/v) containing formic acid 0.5% v/v, after extracting the samples using a simple protein plasma precipitation with perchloric acid. The developed method was validated in accordance with ANVISA guidelines and was successfully applied to a bioequivalence study in 60 healthy volunteers demonstrating the feasibility and reliability of the proposed method.
Keywords: levodopa; HPLC-ESI-MS/MS; bioequivalence.
INTRODUCTION
Parkinson’s disease (PD) is a neurodegenerative disorder whose pathological feature is basically related to abnormalities of cerebral dopaminergic pathways and progressive degradation of dopamine (DA) production in substantia nigra.1,2 The motor features, such as bradykinesia, resting tremor, rigidity, gait and postural changes, are the major features of PD.3
Levodopa (LVP) provides rapid and effective control of motor symptoms in virtually all PD patients and since its introduction has dramatically improved survival and quality of life for people with PD and is considered the gold standard of PD pharmacotherapy.4
LVP, is the precursor of dopamine and crosses the blood-brain barrier, unlike DA.5 LVP is principally metabolized by an aromatic amino acid decarboxylase (AADC) to its active metabolite, DA, and by catechol O-methyltransferase (COMT) into 3-O-methyldopa (3OMD).6
Combination therapy of LVP with peripheral AADC inhibitors, such as benserazide, reduces peripheral decarboxylation of LVP in DA, increasing the availability of LVP to the brain and thereby potentially prolongs motor beneit from individual doses of LVP and reduces DA-related peripheral side effects such as nausea, or vomiting.4,7,8
Measurements of LVP and its metabolites in blood have been crucial for development of these strategies by clarifying the role of systemic pharmacokinetics in clinical response.1
Several methods have been developed to determine LVP and its major metabolite 3-O-methyl dopa in biological luids. However, most methods of LVP and 3OMD quantitation were carried out by using high-performance liquid chromatography with electrochemical detection (HPLC–EC).6,9 Other methods including luorimetric and ultraviolet detection and high performance liquid chromatography coupled to diode array detector (HPLC-DAD) have also been
developed.10-12 Recently, the literature reports a large number of studies performed using high performance liquid chromatography coupled to tandem mass spectrometry (HPLC–MS/MS) for the de-termination of drugs in biological luids.13-15 However, few methods for determining LVP in plasma using HPLC-MS/MS have been developed and validated.12 Therefore, further studies are necessary to further improve quantitation techniques allowing the measurement of low concentrations of LVP and 3OMD in human plasma with high selectivity and sensitivity.9
Some points to be considered when developing a method for quantiication of these analytes is the extraction procedure to be adopted, since both analytes are highly polarized and unstable due to oxidation. This makes the analytes dificult to extract by solid-phase extraction (SPE) or liquid-liquid extraction with high recoveries and it has proved challenging to develop a sensitive and rapid method using HPLC-MS/MS.15-17
In this work, a new simple, accurate and stable method using HPLC–ESI-MS/MS for the quantitation of LVP in human plasma was developed and validated and was successful applied to a bio-equivalence study in healthy volunteers.
EXPERIMENTAL
Chemicals and reagents
Liquid chromatography
Chromatographic separation was carried out on a Varian system (Walnut Creek, California, USA), equipped with two analytical pumps. A Varian 212-LC. HTS CTC Analytics auto-injector was used.
The chromatographic analysis was performed on a pursuit® C18 analytical column (5 µm, 150 x 4.6 mm i.d.), which was maintained at 25 oC. The mobile phase consisted of 0.5% formic acid in water and methanol (90:10, v/v), at a low rate of 1 mL/min, with low divider split 1:1. The run time was 6.0 min, and the injection volume was 10 µL at 7 C autosampler temperature.
Mass spectrometry
The analysis was performed using a Varian 1200 L quadrupole HPLC-MS/MS system (Walnut Creek, California, USA) equipped with an electrospray ion source and operated in the positive ioniza-tion mode. The ion spray voltage and source temperature were 5500 V and 400 oC, respectively. The other parameters for the gas source were set as follows: drying gas (N2): 25 psi, nebulizer gas (N2): 50 psi, collision-induced dissociation (Argon) 2.25 mTorr. Mass spectro-metric detection was performed using multiple reaction monitoring (MRM) of the fragmentation transitions m/z 198.1 ® 181.0 for levo-dopa (Figure 1a) and 227.1 ® 181.0 for carbilevo-dopa (Figure 1b). The collision energy for the levodopa and carbidopa were 8.5 and 11.5 V, respectively. The voltage capillary applied was 35 V for analyte and internal standard. Data acquisition and analysis were achieved using Varian MS Workstation software (version 6.6, Walnut Creek, USA).
Preparation of stock and working solutions
Standard stock solutions of levodopa and carbidopa (IS) were prepared by dissolving the analytical standard in methanol contain-ing 0.04% v/v of perchloric acid at a concentration of 1 mg/mL. Both solutions were treated in an ultrasonic bath (Branson 2210 ultrasonic cleaner, Bransonic Ultrasonic Corporation, Darbury, CO, USA) for 5 min.
The standard working solutions of levodopa at the concentrations of 40, 30, 15, 10, 5, 2, 1 and 0.5 µg/mL were obtained by serial dilut-ing the stock solution with methanol/water (1:1 v/v).
Quality control (QC) working solutions with concentrations of 0.5, 1, 15 and 30 µg/mL were prepared as the standard working solution. The working internal standard solution containing 4 µg/mL of carbidopa was also prepared in methanol and water 50% (v/v) by diluting the stock solution. All solutions were stored at −25 oC in amber glass bottles when not in use.
Plasma sample preparation
The IS solution (50 µL, 4 µg/mL of carbidopa in methanol /water 1/1 – v/v) was added to 200 µL of plasma sample which was stored in a 2 mL polypropylene tube. After that, the protein precipitation was performed by adding 240 µL and 0.4 M of perchloric acid. The mixture was stirred with a vortex for approximately 1 min followed by centrifugation at 20093 g for 15 min, at -5 oC. Subsequently, the full supernatant was transferred to an autosampler vial containing 100 µL of water and was mixed with the vortex for 20 s. Aliquots (20 µL) from the inal extract were injected into the HPLC–MS/MS system.
Calibration curves and quality control (QC) samples
An eight-point standard curve (each concentration prepared in duplicate) of peak areas versus plasma concentrations for levodopa,
covering each of the ranges from 25 to 2000 ng/mL, was established daily by using a weighted [1/x2] least-squares linear regression
analysis method.
Calibration standards were prepared by spiking 950 µL drug-free human plasma with 50 µL of levodopa standard working solutions. A volume of 200 µL of spiked plasma was then transferred to a 2 mL vial and processed as per the plasma samples described above.
The QC samples were prepared according to the same procedure described for the calibration standards using blank plasma, fortiied at 25, 50, 750, 1500 ng/mL of levodopa and 1000 ng/mLof IS. The calibration curves and QC samples were freshly prepared and ana-lyzed with each batch of human plasma.
Method validation
The validation process was carried out according to the guidelines for the Industry – Bioanalytical Method Validation, recommended by US Food Drug Administration and according to resolution 899 of May 23, 2003 by ANVISA, Brazil.18
Specificity and carryover
The speciicity of the method was evaluated by analyzing blank plasma samples from 6 different sources, including one lipemic, one hemolysate and 4 normal plasmas from different sources. The chroma-tograms were compared with those obtained from the analysis of the mobile phase fortiied with levodopa (25 ng/mL) and carbidopa (1000 ng/mL) to ensure no interference in the analyte analysis occurred. The carryover was measured by comparing the peak areas of drug-free plasma injected after the sampling of levodopa (1500 ng/mL) three consecutive times. The endogenous interference of the anticoagulant (heparin) in plasma samples was also evaluated.
Linearity and lower limit of quantification (LLOQ)
The linearity of the method was assessed by analyzing calibra-tion standard plasma samples containing levodopa at 8 different concentrations of 25, 50, 100, 250, 500, 750, 1500 and 2000 ng/mL. The calibration curve was constructed by plotting peak-area ratios of levodopa to the IS against spiked concentration, using weighted (1/x2) least squares linear regression.
The LLOQ was deined as the lowest concentration on the calibra-tion curve, and was established by analysis of 8 replicates of plasma samples spiked with analyte at a concentration of 25 and 1000 ng/mL of carbidopa. Furthermore, to accept the LLOQ value, the peak of the analyte at this concentration had to be at least 5 times the baseline noise. In addition, each LLOQ sample should be obtained with an acceptable accuracy (RE) within ± 20% and a precision (RSD) not exceeding 20%.18
Precision and accuracy
Intra-batch, inter-batch precision and accuracy were determined by eight replicate analyses (n = 8) of QC samples at three different concentrations (50, 750 and 1500 ng/mL) on 3 consecutive days. The concentration of each sample was determined using freshly prepared calibration standards. Precision was expressed as RSD and accuracy as RE, with an acceptable accuracy and precision within ± 15%.18
Recovery
prepared according to the method at 3 different QC concentrations (50, 750 and 1500 ng/mL), with those observed from the analysis of spiking deproteinized blank plasma samples at the same amounts of analyte. The recovery of IS was determined in a similar way, at the working concentration (1000 ng/mL of carbidopa).
Stability
All of the assays used for stability testing of levodopa were eva-luated by analysis of QC samples at 2 concentrations of 50 and 1500 ng/mLin 8 replicates. The autosampler’s stability was also determined by analyzing extracted QC samples kept under autosampler conditions (7 oC) for 125 h. Room temperature stability and long-term stability were assessed using untreated QC samples kept at room temperature for 7 h and stored at -70 oC for 570 days, respectively. After 5 free-zing/thaw cycles (-70 oC/room temperature) on consecutive days, QC samples were processed and analyzed to determine the freeze-thaw stability. Samples were considered to be stable if their assay values were within the range of 15% of the nominal values.18
Bioequivalence study
The validated method was applied to a single-dose, randomized with 2-periods, crossover study of two formulations of test and reference of levodopa + benserazide (200 + 50 mg) in 60 healthy volunteers.
The clinical study was conducted by a collaborative laboratory and the clinical protocol was approved by the institutional Ethics Committee (license: 892/2008, Unicamp, Campinas - São Paulo, Brazil). All subjects involved in the clinical study provided informed consent. After an overnight fast, all participating volunteers took a single oral dose of a test or reference levodopa + benserazide tablet (200 + 50 mg) along with 200 mL of water per period. The washout time between two periods was 9 days (216 h). The blood samples were collected into amber tubes, using heparin as anticoagulant at pre-dose, 0.25, 0.5, 0.75, 1, 1.25, 1.5, 1.75, 2, 2.33, 2.66, 3, 3.5, 4, 5, 6, 8 and 10 h post-dosing. Samples were centrifuged at 4884 g for 10 min at 4 oC and the plasma separated and stored at -70 oC until analysis.
Pharmacokinetic parameters were calculated using the WinNonlinTM program (version 5.3, Microsoft Excel, 2003). The maximum plasma concentrations (Cmax) and the time to reach these (Tmax) were obtained directly from the experimental data. The ter-minal elimination rate constant (Ke) was calculated from the plot of logarithms of plasma concentration against time using least square regression.
RESULTS AND DISCUSSION
Chromatography and mass spectrum
Tandem mass parameters were optimized for best response by directly infusing standard solutions of levodopa and carbidopa at a low rate of 20 µL/min through a syringe pump. MS scanning was carried out in positive ion mode. From the product ion scan (MS2), it could be identiied that the signal of fragment ions with m/z 181.0 for levodopa and m/z 181.0 for carbidopa (IS) were the most abundant. Therefore, the transitions m/z 198.1→181.0 for levodopa (Figure 1S,
supplementary material) and 227.1→181.0 for carbidopa (Figure 2S,
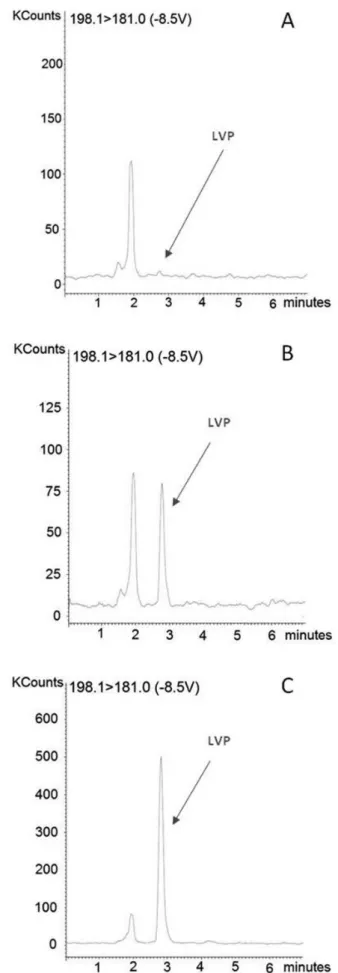
supplementary material) were selected for determination. The results obtained from the analysis of spiked plasma samples demonstrated that the signal-to-noise ratio of the ion selected for levodopa was greater than 5:1 at the LLOQ (Figure 1b), which conirmed the higher speciicity of the ion selected.
In order to select the optimum mobile phase composition that provides the most rapid and best overall separation of the analyte and IS from the matrix interference, the mobile phase containing acetonitrile and/or methanol and water were mixed at different ratios with and without adding modiiers or buffers (ammonium acetate, ammonium formate or formic acid). The best conditions revealed from these experiments were achieved using a mixture of water/methanol/formic acid at a ratio of 90:10:0.5% (v/v/v). This acidic mobile phase is an important factor for signiicant reduction of the matrix effect. In addition, the short retention time and good resolution of the analyte and internal standard under HPLC-MS/MS conditions have the advantage of high-throughput in the analysis compared to recent studies in the literature using a similar extrac-tion method.1,6,9,19,20 The extraction method used was considered satisfactory since higher peak symmetry and sharper signals by acid amount added were achieved and short analysis time, without decreasing the signal intensity of levodopa (Figure 1b) or of the internal standard carbidopa (Figure 2b).
Different types of columns (Pursuit® C18, OmniSpher C18, monoChrom 5 u MS) were tested and the Pursuit® C18 column was chosen because it presented the best chromatographic separation from endogenous compounds under our speciic conditions. The pH of the plasma samples treated with perchloric acid in the extraction step, contributed to the choice of a Pursuit® C18 column.21 In this method, no additive was used for pH adjustment (neutralization) or for the precipitation of perchlorate in the extraction stage, in contrast to indings in the literature.1,11 Therefore, the choice of the column was based on its strength, according to the analytical chromatographic method used and the ability to tolerate the injection of samples pro-cessed with perchloric acid.
Selection of IS
As is known, the use of an internal standard whose chemical pro-perties are very similar to those of the analyte can minimize variations that may occur during the analytical process. In this study, methyldopa and carbidopa were evaluated as internal standards (IS). Firstly, due to their structural similarity with levodopa and also because they had been used in the literature for this purpose.9 Under the selected chromatographic conditions, carbidopa was chosen as the IS given its high sensitivity, similar chromatographic and mass spectrometric behavior in relation to the analyte. The levodopa and carbidopa were eluted and well resolved chromatographically at retention times of 2.61 and 5.05 min, respectively (Figures 1b and 2b).
Pretreatment of plasma samples
Many precipitation extraction methods have been reported using extraction solvents such as perchloric acid or methanol at different molar ratios or with addition of buffer or modiiers.1,11,19-22 Protein precipitation with perchloric acid 0.4 M was applied to prepare plasma samples because it was simple to perform, fast, easily reproducible and provides a high recovery of the analyte under our experimental conditions (Table 2).
Method validation
The speciicity was examined by analyzing 6 different human blank plasma samples (one hemolysate, one lipemic and 4 normal). No interfering peaks from endogenous compounds were observed at the retention time of the analyte or IS (Figures 1a and 2a). The reten-tion times of levodopa and carbidopa were about 2.61 min and 5.05 min, respectively, and total run time was 7 min, which represents a
reduction in running time when compared to most analytical methods described in the literature.1,9,11,19,22
A calibration curve was tested during the method validation and was shown to be linear over the concentration range 25-2000 ng/mL with a weight factor of 1/x2, which was able to cover all clinical con-centrations of levodopa in this study (Table 1). The linear equations of the calibration curves showed r > 0.993403.
The lower limit of quantiication (LLOQ) was deined as the lowest concentration of levodopa in human plasma detected in the calibration curve (25 ng/mL). The LLOQ observed in this study is one of the lowest reported in the literature that reports lower limits of quantiication of around 50 ng/mL.9,11,19,20,22 The mean precision and accuracy at LLOQ was 3.11 and 103.54%, respectively (Table 2). With the LLOQ (25 ng/mL), this method was suficiently sensitive to determine the concentration of levodopa in human plasma 10 h after a single oral administration of levodopa (200 mg) + benzerazide (50 mg) in this bioequivalence study. Representative chromatograms of a blank plasma (Figures 1a and 2a), plasma spiked with levodopa (25 ng/mL; Figure 1b) or carbidopa (1000 ng/mL; Figure 2b) and plasma obtained from the human volunteers 2 h after administration of 200 mg of levodopa (Figure 1c) and 50 mg of benserazide (Figure 2c), presented peak symmetry values of between 2.61 and 5.05, assuring the separation and effectiveness of the quantitation.
Intra-batch, inter-batch precision and accuracy were evaluated by analyzing eight replicate quality control samples at four different con-centration levels of 25, 50, 750 and 1500 ng/mL over three validation
days. Full results are shown in Table 2, where it can be seen that the intra-batch precision measured by the coeficient of variation, CV, was 3.11, 4.24, 3.94 and 4.96%, respectively. The sample concentrations used in the precision and accuracy studies were in accordance with the Brazilian regulatory guidelines18 (Low-concentration quality control samples: 50 ng/mL, Middle-concentration quality control samples: 750 ng/mL and High-concentration quality control samples: 1500 ng/mL) and the precision at each concentration level did not exceed a CV of 15% for quality controls and 20% for LLOQ (25 ng/mL). The accuracy was within the range established (i.e. 85-115%) for each concentration level tested and for LLOQ of 80-120%. The mean extraction recoveries of levodopa (n = 8) were 100.60, 100.15 and 94.58% at concentrations of 50, 750 and 1500 ng/mL, respectively (Table 2). The carryover was examined by analyzing the peak areas of drug-free plasma after injecting levodopa sample (1500 ng/mL) three times consecutively.
The stability of levodopa under different storage and handling conditions were fully evaluated by analyzing Quality Control samples. Levodopa proved to be stable in plasma samples for at least 7 h at room temperature (short-term) and also after 5 freeze thaw cycles, demonstrating that human plasma samples could be thawed and refrozen without compromising the integrity of the samples. Plasma samples were stable for at least 274 days at –70 ºC (long-term). The results demonstrated that extracted samples could be analyzed after being kept in the autosampler for at least 125 h with acceptable preci-sion and accuracy (Table 3).
Application to a bioequivalence study
The validated method was successfully applied to a bioequi-valence study of two levodopa + benzerazide formulations. The Table 1. Precision and accuracy data of back calculated concentrations of
calibration samples for levodopa in plasma (2 replicates per batch)
Analyte Nominal concentration (ng/mL) Observed concentration (ng/mL, mean ± SD)
Precision (%RSD)
Accuracy (%)
Levodopa 25.0 25.4 ± 1.4 5.6 101.6 50.0 47.7 ± 0.3 0.6 95.5 100.0 101.8 ± 0.0 0.0 101.8 250.0 251.8 ± 9.2 3.7 100.7 500.0 515.8 ± 12.7 2.5 103.1 750.0 773.6 ± 13.1 1.7 103.1 1500.0 1492.3 ± 4.9 0.3 99.5 2000.0 1896.4 ± 1.6 0.1 94.8 SD = standard deviation; RSD = relative standard deviation.
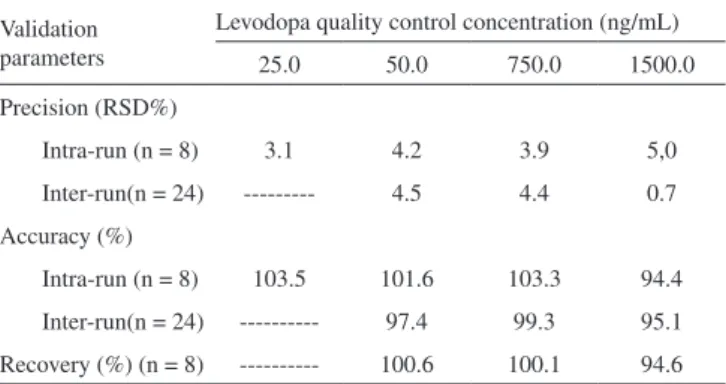
Table 2. Precision, accuracy and recovery data for levodopa quantiication by HPLC–MS/MS
Validation parameters
Levodopa quality control concentration (ng/mL) 25.0 50.0 750.0 1500.0 Precision (RSD%)
Intra-run (n = 8) 3.1 4.2 3.9 5,0 Inter-run(n = 24) --- 4.5 4.4 0.7 Accuracy (%)
Intra-run (n = 8) 103.5 101.6 103.3 94.4 Inter-run(n = 24) --- 97.4 99.3 95.1 Recovery (%) (n = 8) --- 100.6 100.1 94.6
Table 3. Stability of human plasma samples of levodopa under various storage conditions (n = 8)
Stability
Measured concentration
(ng.mL-1)
Mean fresh samples RSD(%) Mean stability samples RSD(%) Assay values (%) Post-preparative stability (125 h, 7 ºC) 50.0 51.1 5.9 50.7a 4.7 -0.7
1500.0 1543.7 5.1 1581.7a 2.7 2.5
Long-term stability (274 days, -20 ºC, %) 50.0 51.3 2.7 53.5 c 3.5 4.3
1500.0 1449.3 3.4 1521.6c 2.7 5.0
Freeze-thaw stability (5 cycles – 137 h, -70 ºC) 50.0 52.1 4.5 51.4b 4.1 -1.4
1500.0 1575.3 10.5 1502.3b 3.2 -4.6
Short-term stability (7 h, room temperature) 50.0 51.3 2.7 53.5 c 3.5 4.3
1500.0 1449.3 3.4 1521.6c 2.7 5.0
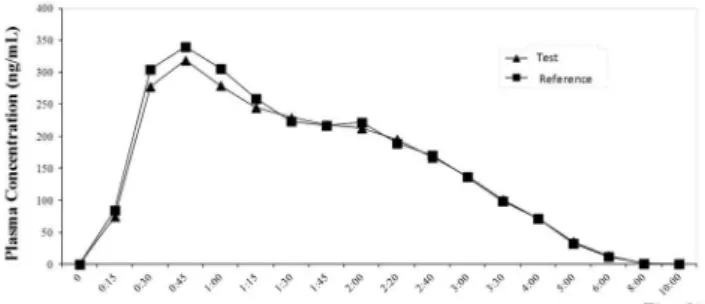
mean concentration versus time curves in plasma from 60 healthy volunteers after administration, reference and test preparations are shown in Figure 3.
The results demonstrated that the two levodopa + benzerazide preparations were bioequivalent in terms of their rate and extent of absorption.
CONCLUSION
A new sensitive and simple method using HPLC-MS/MS for the determination of levodopa in human plasma was developed and validated and can be a useful tool for pharmacokinetics studies of several drugs.
The described method showed good speciicity, precision, ac-curacy and linearity over the 25-2000 ng/mL range. This method afforded simple sample preparation using protein precipitation with perchloric acid. The established LLOQ of 25 ng/mL is one of the lowest reported in the literature and it was eficient for determination of the levodopa concentrations in human plasma up to 10 h after oral administration of levodopa + benzerazide. No signiicant interfer-ences from endogenous compounds were observed. The method was successfully applied to demonstrate the bioequivalence of test and reference formulations.
SUPPLEMENTARY MATERIAL
Available at http://quimicanova.sbq.org.br, as PDF ile, with free access.
ACKNOWLEDGEMENTS
The authors gratefully acknowledge all volunteers, laboratory analysts, and technicians who participated in this study.
Figure 3. Plasma concentration–time curve of levodopa after the oral ad-ministration of a single dose of reference and test formulations (levodopa 200 mg + carbidopa 50 mg) in 60 healthy volunteers
REFERENCES
1. Karimi, M.; Carl, J. L.; Loftin, S.; Perlmutter, J. S.; J. Chromatogr., B: Anal. Technol. Biomed. Life Sci. 2006, 836, 120.
2. Kim, T. H.; Cho, K. H.; Jung, W. S.; Lee, M. S.; PLoS ONE 2012, 7, e35695.
3. Massano, J.; Garrett, C.; Frontiers in Neurology 2012, 3, 1.
4. Keller, G. A.; Czerniuk, P.; Bertuola, R.; Spatz, J. G.; Assei, A. R.; Girolamo, G. D.; Clinical Therapeutics 2011, 33, 500.
5. Poulopoulos, M.; Waters, C.; Core Evidence 2010, 5, 1.
6. Saxer, C.; Niina, M.; Nakashima, A.; Nagae, Y.; Masuda, N.; J. Chro-matogr., B: Anal. Technol. Biomed. Life Sci. 2004, 802, 299.
7. Jonkers, N.; Sarre, S.; Ebinger, G.; Michotte, Y.; J. Neural. Transm. 2001, 108, 559.
8. Souza Silva, M. A.; Mattern, C.; Hcker, R.; Tomaz, C.; Huston, J. P.; Schwarting, R. K. W.; Synapse 1997, 27, 294.
9. Cesar, I. C.; Bastos, L. F.; Godin, A. M.; Coelho, M. M.; Araujo, D. P.; Fatima, A.; Guidine, P. A.; Pianetti, G. A.; J. Mass. Spectrom. 2011, 46, 1125.
10. Li, S. F.; Wu, H. L.; Yu, Y. J.; Li, Y. N.; Nie, J. F.; Fu, H. Y.; Yu, R. Q.; Talanta 2010, 81, 805.
11. Muzzi, C.; Bertocci, E.; Terzuoli, L.; Porcelli, B.; Ciari, I.; Pagani, R.; Guerranti, R.; Biomed. Pharmacother. 2008, 62, 253.
12. Cesar, I. C.; Byrro, R. M. D.; Cardoso, F. F. S. S.; Mundim, I. M.; Teixeira, L. S.; Gomes, S. A.; Bonim, R. R.; Pianetti, G. A.; J. Mass. Spectrom. 2011, 46, 943.
13. Bedor, D. C. G.; Souza Filho, J. H. ; Ramos, V. L. S.; Gonçalves, T. M.; Sousa, C. E. M. ; Santana, D. P. ; Quim. Nova 2011, 34, 6.
14. Dalmora, S. L.; Sangoi, M. da S.; Nogueira, D. R.; D’Avila, F. B.; Mo-reno, R. A.; Sverdloff, C. E.; de Oliveira, R. A.; Borges, N. C.; Quim. Nova 2010, 33, 124.
15. Igarashi, K.; Hotta, K.; Kasuya, F.; Abe, K.; Sakoda, S.; J . Chromatogr., B: Anal. Technol. Biomed. Life Sci. 2003, 792, 55.
16. Kumarathasan, P.; Vincent, R.; J . Chromatogr., A 2003, 987, 349. 17. Koivisto, P.; Tornkvist, A.; Helctin, E.; Markictes, K. E.;
Chromato-graphia 2002, 55, 39.
18. Brasil, Agência Nacional de Vigilância Sanitária (ANVISA); RE 899 Guia para Validação de Métodos Analíticos e Bioanalíticos, ANVISA: Brasília, 2003.
19. Lv, L.; Jiang, W.; Zhou, S.; Huang, X.; Shi, X.; Lv, C.; Wu, L.; Xu, C.; Chromatographia 2010, 72, 239.
20. Pan, L.; Guo, Y.; Li, Z.; Chen, J.; Jiang, T.; Yu, Y.; Chromatographia 2010, 72, 627.
21. Tolokan, A.; Klebovich, I.; Balogh-Nemes, K.; Horvai, G.; J. Chro-matogr., B: Anal. Technol. Biomed. Life Sci. 1997, 698, 201.
Supplementary Material
*e-mail: [email protected]
DETERMINATION OF LEVODOPA IN HUMAN PLASMA BY HIGH PERFORMANCE LIQUID CHROMATOGRAPHY–TANDEM MASS SPECTROMETRY (HPLC–MS/MS): APPLICATION TO A BIOEQUIVALENCE STUDY
Heliana F. Martins, Douglas P. Pinto e Viviane de A. Nascimento
Laboratório de Farmacocinética, Fundação Oswaldo Cruz, Av. Brasil, 4365, 21040-900 Rio de Janeiro – RJ, Brasil
Marlice A. S. Marques
Departamento de Química Analítica, Instituto de Química, Universidade Federal do Rio de Janeiro, Av. Athos da Silveira Ramos, 149, 21949-900 Rio de Janeiro – RJ, Brasil
Fábio C. Amendoeira*
Instituto Nacional de Controle de Qualidade em Saúde, Fundação Oswaldo Cruz, Av. Brasil, 4365, 21040-900 Rio de Janeiro – RJ, Brasil