Article
0103 - 5053 $6.00+0.00*e-mail: [email protected]
Study of the Degradation of the Herbicide Clomazone in Distilled and in Irrigated
Rice Field Waters using HPLC-DAD and GC-MS
Renato Zanella,*
,aEdnei G. Primel,
bFábio F. Gonçalves,
aManoel L. Martins,
aMartha B. Adaime,
aEnio Marchesan
cand Sérgio L. O. Machado
caDepartamento de Química, Universidade Federal de Santa Maria (UFSM), 97105-900 Santa Maria-RS, Brazil
bDepartamento de Química, Fundação Universidade Federal do Rio Grande (FURG), 96201-900 Rio Grande-RS, Brazil
cCentro de Ciências Rurais, UFSM, 97105-900 Santa Maria-RS, Brazil
Este estudo avaliou a degradação do herbicida clomazone em água destilada e de campos de arroz irrigado, através de irradiação UV e sob condições naturais. Após a etapa de pré-concentração por extração em fase sólida (SPE), a concentração remanescente foi determinada por cromatografia líquida de alta eficiência com detecção por arranjo de diodos (HPLC-DAD) e a identificação dos produtos de degradação foi efetuada por cromatografia gasosa com espectrometria de massas (GC-MS). Sob irradiação UV, o clomazone foi degradado mais rapidamente na água destilada que na água de superfície. Na água de irrigação, sob luz solar, o clomazone apresentou tempo de meia-vida médio de 3,2 dias em três safras consecutivas, e após a aplicação a concentração na água permaneceu acima de 0,1 µg L-1 por cerca de 20 dias. Diversos subprodutos, tais como 2-clorobenzaldeído e 2-clorobenzeno metanol, foram identificados por GC-MS, evidenciando que a concentração dos intermediários aumentou no início e então eles também sofreram degradação.
This study evaluated the degradation of the herbicide clomazone in distilled water and from irrigated rice fields, through UV irradiation and under natural conditions. After a solid phase ex-traction (SPE) as preconcentration step, the remained concentration of clomazone was determined by high performance liquid chromatography with diode array detection (HPLC-DAD) and the identification of the degradation products was achieved by gas chromatography-mass spectrometry (GC-MS). Under UV irradiation, the clomazone was degraded faster in distilled water than in surface water. In irrigated rice water, under sunlight irradiation, clomazone presented a half-life time average of 3.2 days in three consecutive harvests, and after application the concentration in water remained higher than 0.1 µg L-1 for 20 days. Several by-products, like 2-chlorobenzaldehyde and 2-chlorobenzene methanol, were identified by GC-MS, which evidenced that the concentration of intermediates at the begining increase and then they also undergo degradation.
Keywords: clomazone, degradation, HPLC-DAD, GC-MS, water
Introduction
Environmental water pollution by pesticides is a problem with widespread ecological consequences.1 Herbicides are potential contaminants of environmental water because they are directly applied to the soil or irrigating water. Thus, they can be leached to the surface water and transported into the groundwater.2,3 According to specialized literature,2,4 a pesticide can pollute the aquatic environmental if its solubility in water is higher than 30 mg L-1; its K
oc, organic
carbon partition coefficient is less than 300-500; its KH, Henry’s Law constant is less than 10-2Pa m3mol-1, its soil half-life is longer than 2-3 weeks and its water half-life is longer than 25 weeks.
sunlight is > 30 days in an aqueous solution and 30-135 days in soil. It is highly soluble in water (1100 mg L-1) and has a Kocof 150-562 mL g-1 and a K
H value of 4.19 r 10-3 Pa m3 mol-1.6 These properties of clomazone indicate its potential for aquatic environmental pollution. In this study we selected clomazone because it is an important herbicide that has been detected in the majority of the water samples collected from rivers located close to irrigated rice fields in the South of Brazil.3
The major sources of pesticide pollution are wastewater from agricultural industries and pesticide formulating or manufacturing plants, and their removal from the aquatic environment has become a very important task and different methods are used including carbon adsorption, ozonization, microbial degradation, photodegradation, etc. Hydrolysis, photolysis, using natural sunlight or xenon arc lamps, aquatic metabolism and field dissipation can also contribute to degradation.7,8 In practice, the evaluation of degradation products is possible through identification by GC-MS.9
Therefore, today, the removal of organic harmful pollutants present in water supplies is investigated through a variety of chemical procedures. Among them, oxidation by several agents besides chlorine, such as ozone, UV radiation and Fenton’s reagent, have been extensively and successfully used.9 The Advanced Oxidation Processes (AOPs), which are constituted by the combination of several oxidants, are characterized by the generation of very reactive and oxidizing free radicals in aqueous solutions, such as the hydroxyl radicals, which have a great destructive power.10 Many of them are currently employed in the elimination of pesticides,11,12 however no study has been published about procedures to degrade clomazone.
Photochemical reactions are especially important as a technique to remove harmful chemicals from the waste effluents. Photochemical decomposition of pesticides represents an important transformation pathway that can occur in surface waters.13Photochemical AOPs are light induced reactions, mainly oxidations that rely on the generation of hydroxyl radicals through combination with added oxidants (e.g. H2O2, Fe3+).
For the determination of herbicides in water samples the high performance liquid chromatography with diode array detection (HPLC-DAD), after a solid phase extraction (SPE) as preconcentration step, is frequently employed.14
The objectives of this work were i) to compare the kinetic degradation of clomazone in distilled and surface water by using a high-pressure mercury lamp; ii) to investigate the pH influence on photodegradation; iii) to identify the photodegradation products and iv) to follow the degradation in the field under natural conditions. The concentration of clomazone was determined by
HPLC-DAD as described in Zanella et al.5 and the identification of the photodegradation products was obtained by GC-MS.
Experimental
Instrumentation
The HPLC-DAD analyses were performed with a Varian (Palo Alto, USA) 9002 pump, a Rheodyne (Cotati, CA, USA) 7125 six-port valve with 20 ML loop, and a Varian ProStar 335 diode array detector. The separation was performed on a 250 r 4.6 mm i.d., 5 Mm particle, Bondesil C18 analytical column from Varian, operated at room temperature. The mobile phase was methanol-water 65:35 (v/v) adjusted to pH 4.0 with phosphoric acid. It was prepared from separated measured volumes of methanol and water and was degassed for 15 min in an ultrasonic bath before use. The flow-rate was set at 1.0 mL min-1 and quantification was performed by detection at 220 nm.
A Varian 3800 CX gas chromatograph with autosampler 8400 and Saturn 2000 mass spectrometer detector equipped with a CP-Sil 8CB-MS column of 30 m length, 0.25 mm i.d. and 0.25 Mm film thickness was used to identify the products of transformation. The following chromatographic conditions were used: injector temperature of 250 °C, column oven temperature program of 45 °C, held for 1.5 min, then a gradient of 10 °C min-1 up to 260 °C, maintained for more 4 min. Helium was used as a carrier gas at a constant pressure of 10 psi, resulting in a flow-rate of 1 ml min-1. The temperatures of the ion source and the interface were set at 250 and 290 °C, respectively. The MS was operated in electron impact mode with a potential ionization of 70 eV and the spectra were obtained at a scan range from m/z 50 to 650 (full scan mode). The scan time was 0.90 seconds and 1.0ML injections were made.
Chemicals
alkalinity 8.7 mg L-1 of CaCO
3; total solids 110 mg L -1. The
extraction tubes were Bakerbond SPE octadecyl C18 (3 mL, 200 mg) from J. T. Baker (Phillipsburg, NJ, USA).
Photodegradation experiments and SPE preconcentration step
The employed homemade reactor apparatus consisted of a tank reactor with a capacity of 2 L and equipped with magnetic stirring, a system for measuring and controlling the reaction temperature, and a high-pressure mercury lamp of 125 W. All photodegradation experiments were carried out at room temperature (25 °C) in the reactor containing 1.5 L of water spiked at 5 mg L-1 of clomazone level using a commercial formulation. Different pH values (3.0 and 6.0) and different water matrices (distilled and surface water) were tested.
After the treatment, an aliquot of the water sample (50 mL) was removed from the reactor and preconcentrated in a solid phase extraction (SPE) system. The SPE column was conditioned by the consecutive passage of 3 mL methanol, 3 mL Milli-Q water, 3 mL Milli-Q water at pH 3.0 (adjusted with phosphoric acid 1:1, v/v). The samples were passed through the SPE column under vacuum at 5 mL min-1. Immediately after that, the column was washed with 3 mL Milli-Q water, the eluate was discarded, and the adsorbent bed was dried under vacuum for 2 min. After drying, the analyte was eluted with 1 mL (2 r 500 ML) methanol and analyzed by HPLC-DAD and GC-MS.
Study of the degradation of herbicides in irrigated rice farming water
The samples of farming water were collected from four experimental fields, with 4 r 4 m each, of rice crops of the Crop Science Department at the Campus of the Federal University of Santa Maria (UFSM). The commercial product Gamit 500 EC was used for the application of clomazone at 500 g ha-1 level, resulting, with a water level of 10 cm, in an initial concentration of 500 µg L-1. The samples were collected on days 1, 2, 3, 5, 7, 10, 14, 21, 28, 35 and 45 after the application of the herbicide in the period between November and March of 2000-2001, 2001-2002 and 2002-2003. The calculation of the degradation was performed using the first-order rate equation:7
-ln [Ct]/[Co] = k × t (1)
where Ct represents the concentration at time t; Co represents the initial concentration; and k is the degradation constant, obtained by the slope of the straight line. When
the concentration is reduced to 50% of the initial amount, the half-life time (t1/2) can be determined by:
t1/2= 0.693 / k (2)
Results and Discussion
Photodegradation of clomazone
For all collected samples, an increase in the degradation of clomazone and of the products were observed in the systems HPLC-DAD and GC-MS, respectively. From the results of the degradation in different water types after UV irradiation (Table 1), it was observed that in distilled water a larger degradation of the herbicide occurs when compared with surface water using an irradiation time up to 120 min. That probably occurs due to the turbidity of the surface water samples, which reduces the penetration of the UV radiation. It was also observed that in distilled water there is not a great influence of the pH on the degradation rate. However, the surface water samples at pH 3.0 present a larger degradation than at pH 6.0. This can be explained by the occurrence, at pH 3.0, of the Photo-Fenton process to some degree, being that the surface water presents a concentration of iron to the order of 1 mg L-1. The dissolved organic substances present in surface water can induce a reduction of the degradation rate. 15
Figure 1 shows the HPLC-DAD chromatograms obtained from fortified distilled and surface water samples adjusted to pH 3.0 after exposure to UV radiation for 0, 30 and 60 min.
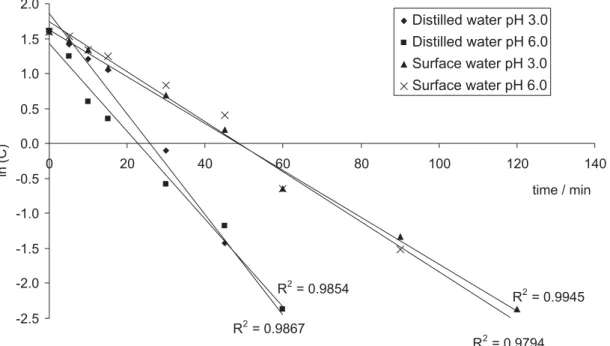
Table 2 shows the results obtained for the kinetics of the photodegradation of clomazone at different pH values (3.0 and 6.0) for distilled and surface water.
The degradation constant k was obtained from the slope of the curve ln (C) versus time (Figure 2). The Table 1. Remaining clomazone concentration (mg L-1) in distilled and
surface water at pH 3.0 and 6.0 after different irradiation time*
Irradiation time / (min)
Distilled water Surface water
pH 3.0 pH 6.0 pH 3.0 pH 6.0
0 4.98 4.98 4.95 4.96
5 4.13 3.49 4.34 4.64
10 3.36 1.82 3.80 3.81
15 2.88 1.43 2.95 3.49
30 0.90 0.56 2.00 2.29
45 0.24 0.31 1.22 1.50
60 0.08 0.09 0.53 0.52
90 0.26 0.22
120 0.09
photodegradation for surface water at pH 3.0 was more efficient when compared to the sample at pH 6.0, both presenting kinetics of degradation of the first order. The coefficients r2 are in general high indicating that the degradation curves fit the data. The results obtained allowed us to conclude that the photodegradation process, proposed for the clomazone herbicide in water samples, is simple and efficient.
Degradation of herbicides in irrigated rice farming water
Figure 3 shows that after the first week of application the clomazone concentration remains high (198 µg L-1 in the 2000-01 harvests; 292 µg L-1 in the 2001-02 harvests, and 86 µg L-1 in the 2002-03 harvests), residues being found up to the fourth week (1.3; 0.75 and 7.8 µg L-1 in the 2000-01; 2001-02 and 2002-03 harvests, respectively). Thus, the results indicate that the water should be maintained in the irrigation fields for at least 28 days, before being released to the environment. This is very important, since studies conducted with fishes had demonstrated short-term effects of exposure to environmentally relevant concentrations of clomazone on AChE activity in brain and muscle tissue.16,17
Clomazone presented a half-life time, obtained using equation 2, of 3.1, 3.4 and 3.2 days in the field experiment, in the 2000-01; 2001-02 and 2002-03’s harvests, respectively. Analyzing the results obtained from the samples of farming water, it can be concluded that the clomazone herbicide Figure 1. HPLC-DAD chromatograms obtained from fortified (5 mg L-1)
distilled and surface water at pH 3.0 after exposure to UV radiation for: A) 0; B) 30 and C) 60 min. tR clomazone = 18.7 min.
Table 2. Kinetics of photodegradation of clomazone in water*
Water samples Reaction order
k / (min-1) t 1/2/ (min)
Distilled water pH 3.0 1 0.0720o 0.002 9.7o 0.28 pH 6.0 1 0.0629o 0.002 11.0o 0.33 Surface water pH 3.0 1 0.0336o 0.0009 20.7o 0.57 pH 6.0 1 0.0358o 0.0007 19.4o 0.37 * Number of replicates, for each degradation experiment, n= 3.
Figure 2. First order rate plots for degradation of water samples, containing 5.0 mg clomazone L-1, irradiated up to 60 min for distilled water, and up to
is quite persistent, because its half-life time average is 3.2 days.
Degradation products identified by GC-MS
In order to investigate the disappearance of clomazone observed by HPLC-DAD analysis, the SPE extracts of samples of distilled water adjusted to pH 3.0, spiked at 5 mg L-1 using a commercial formulation of clomazone and irradiated by UV light at the same conditions of the test were analyzed by GC-MS. The profile of this disappearance is very similar to that obtained by HPLC-DAD, however with GC-MS the total disappearance of the clomazone signal is observed only at 120 min. The GC-MS data confirm the experimental results obtained by HPLC-DAD, that is to say, a fast degradation of the clomazone by UV radiation, presenting a kinetic reaction described by an equation of the first order.
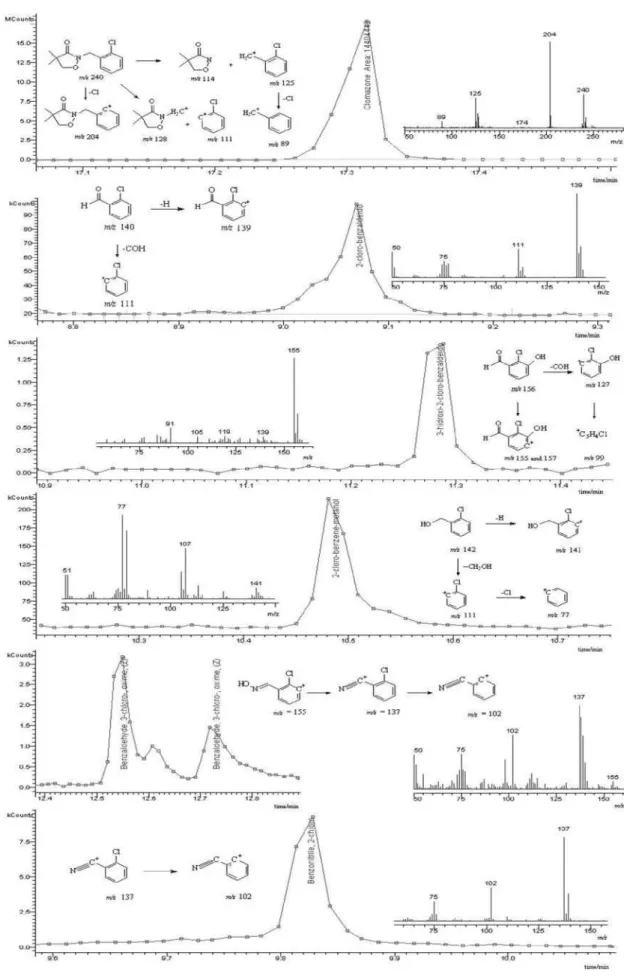
The preconcentration of 50 times allowed the identification of the formed products, especially of the most polar compounds that only produce signals in GC-MS at high concentrations. The use of a silanized liner, a column of low polarity and an SPI injector allowed the observation of some more polar compounds that presented well resolved chromatographic signals. The degradation profiles for the main by-products (2-chlorobenzaldehyde and 2-chlorobenzene methanol), as well as for clomazone, are demonstrated in Figure 4, and both exhibit a regular increase followed by a decrease as expected for the first major degradation products.
Figure 5 presents GC-MS chromatographic signals, data points, spectra, masses and fragmentation suggested for clomazone and identified by-products. The used mass spectrometer, with a scan rate of 5600 m/z by second, allowed to obtain enough data points by signal. Each data point represents the average of three acquisitions of the spectra of masses of 50 to 650 m/z providing improved spectral quality.
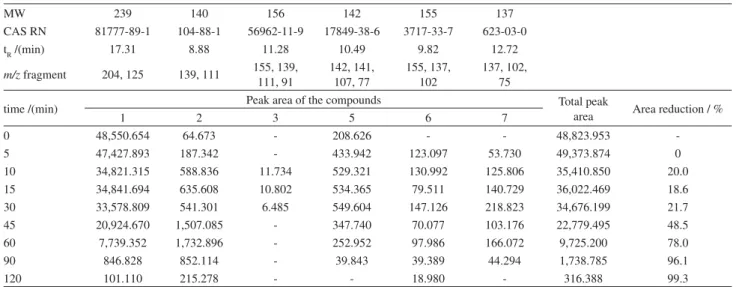
Identification of the compounds
Table 3 presents the data of the detected and confirmed compounds by the GC-MS technique. The evolution, represented by the respective peak area, of clomazone and intermediates formed during the photodegradation treatment indicate a progressive disappearance of clomazone. For the degradation products an initial concentration increase occurred and then they are also degraded.
Clomazone
The fragments of larger intensity are the m/z 240 (molecular ion) this only being observed due to a high injected concentration. The ion m/z204 formed by the loss of the atom of chlorine and the m/z125, that according to the suggested fragmentation outline is formed by the breakage of the molecule of clomazone at the carbon bound with nitrogen, and the consequent loss of the -C5H8NO2 of m/z
Figure 4. Possible degradation pathways proposed for clomazone. For the compounds 1 to 6 identified by GC-MS the observed molecular weight was shown. For the others, the calculated mass (considering the most common isotope) was shown.
formulation and the preparation of the sample involved an extraction stage in C18 cartridges, we presented the interpretation of the spectrum of clomazone to demonstrate the capacity of the equipment and of the analytical process of producing the characteristic spectrum for the compound in the conditions of the experiment.
2-Chlorobenzaldehyde
It is formed in the degradation process by the cleavage of the C-N bond of the carbon of the methyl
Table 3. Evolution of clomazone and intermediates formed during the photodegradation
MW 239 140 156 142 155 137
CAS RN 81777-89-1 104-88-1 56962-11-9 17849-38-6 3717-33-7 623-03-0
tR /(min) 17.31 8.88 11.28 10.49 9.82 12.72
m/z fragment 204, 125 139, 111 155, 139, 111, 91
142, 141, 107, 77
155, 137, 102
137, 102, 75
time /(min) Peak area of the compounds Total peak
area Area reduction / %
1 2 3 5 6 7
0 48,550.654 64.673 - 208.626 - - 48,823.953
-5 47,427.893 187.342 - 433.942 123.097 53.730 49,373.874 0
10 34,821.315 588.836 11.734 529.321 130.992 125.806 35,410.850 20.0
15 34,841.694 635.608 10.802 534.365 79.511 140.729 36,022.469 18.6
30 33,578.809 541.301 6.485 549.604 147.126 218.823 34,676.199 21.7
45 20,924.670 1,507.085 - 347.740 70.077 103.176 22,779.495 48.5
60 7,739.352 1,732.896 - 252.952 97.986 166.072 9,725.200 78.0
90 846.828 852.114 - 39.843 39.389 44.294 1,738.785 96.1
120 101.110 215.278 - - 18.980 - 316.388 99.3
1 = clomazone; 2 = 2-chloro-benzaldehyde; 3 = 3-hidroxy-2-chloro-benzaldehyde; 5 = 2-chloro-benzene-methanol; 6 = benzaldehyde, 3-chloro-oxime and 7 = benzonitrile-4-chloro.
3-Hydroxy-2-chloro-benzaldehyde
It is formed by the hydroxylation of 2-chloro-benzaldehyde. The main formed fragments presented m/z
ratios of 155, 157, 127 and 99. The fragments m/z 155 and
m/z 157 correspond to the molecular ion, and the fragment ofm/z 157 comes with an intensity corresponding to 32.8% of the fragment of m/z 155 due to the natural isotopic abundance of the chlorine atom present in the molecule. The fragment of m/z 127 is formed by the loss of the group -COH. The fragment of m/z 99 is formed by the loss of one more carbon and one oxygen atom. In comparison to the library NIST98 these compounds presented spectral fit greater than 70% with the spectrum regarding 3-hydroxy-2-chloro-benzaldehyde (CAS 56962-10-8). In spite of the small areas in relation to those observed in other compositions, it is important to observe that the formation of this composition indicates the attack by the hydroxyl radical formed by the effect of irradiation with UV light.
2-Chloro-benzene-methanol
It can be formed by the reduction of the 2-chloro-benzaldehyde or by attack of the hydroxyl radical in the moment of the breakage of the C-N bond. In the fragmentation of the 2-chloro-benzene-methanol the fragments of m/z 142 and 141 are observed, respectively the molecular ion and the molecular ion less one H atom. The ion with m/z 111 is formed by the loss of the -CH2OH, resulting in the protonated fragment formed by the aromatic ring linked to the chlorine. The loss of the atom of chlorine for this fragment generates the ion with m/z 77 also observed
in the mass spectrum. In comparison with the library NIST98 this compound presented spectral fit greater than 85% with 2-chloro-benzenemethanol (CAS 17849-38-6).
Benzaldehyde, 2-chloro-oxime
Forming the fragments of m/z 155, 137 and 102. The fragmentm/z 155 corresponds to the molecular ion, and the 157 indicates the presence of a chlorine atom. The fragment of m/z 137 corresponds to the loss of the hydroxyl by the benzaldehyde, 3-chloro-oxime, also being observed a signal with m/z of 138, 139, 140 and 141 formed by the presence of N and Cl in the structure. It is also observed a peak with m/z 102 indicating the loss of the chlorine from the previous fragment. Comparing with the library NIST98, this compound presented spectral fit greater than 90% with the benzaldeyhde-3-chloro-oxime (CAS 4006-79-5). In the chromatogram two close signals were observed with tR between 12.5 and 12.6 min presenting this same characteristic spectrum, which should correspond to the isomer compounds Z and E. In the conditions used in the experiment, the identification by GC-MS doesn’t allow to distinguish between the isomeric position, like benzaldehyde, 3-chloro-oxime and benzaldehyde, 2-chloro-oxime, that present the same mass spectrum.
Benzonitrile-2-chloro
comparison with the library NIST98 this compound presented a spectral fit greater than 95% with the 2-chloro-benzonitrile (CAS 873-32-5).
The acquisition of the data was performed using a scan range from m/z 50 to 650 in order to see if it would not form by-products with larger molecular weight than clomazone for mono- or dihydroxylation or aggregate formation18,19 and to verify other pollutants that could be introduced in the samples in the irradiation processes and extraction.
Using only irradiation the hydroxylation reaction in clomazone does not occur, but rather the breakage of the molecule. Since the products formed in the reaction also disappeared, we believe that the mechanism followed the path of formation of carboxylic acids, which is quite important since this follows the natural path for biological metabolization of organic compounds. A suggestion of the reaction pathway from an environmental perspective is presented in Figure 4.
Conclusion
The obtained information allows a better understanding of the behavior of the herbicide clomazone in distilled and surface waters. The proposed photodegradation process enables an efficient degradation of clomazone in water. The reversed-phase HPLC with DAD detection has proven to be efficient to show the decrease of clomazone during the treatments at the field and in the laboratory. Application of GC-MS for identification and confirmation of clomazone and intermediates formed during the photodegradation treatment increases the reliability of the chromatographic follow up. The evolution of clomazone and intermediates indicate a progressive disappearance of clomazone. For the degradation products an initial increase occurred and then they were degraded. The GC-MS results permit to suggest a degradation pathway for clomazone from an environmental perspective.
Acknowledgments
The authors would like to thank Brazilian agencies FAPERGS, CNPq and CAPES for financial support and fellowships.
References
1. Chiron, S.; Fernandez-Alba, A.; Rodriguez, A.; Garcia-Calvo, E.;Water Res.2000,34, 366.
2. Hatrík, S.; Tekel, J.; J. Chromatogr. A1996,733, 217.
3. Zanella, R.; Primel, E. G.; Machado, S. L. O.; Gonçalves, F. F.;
Marchezan, E.; Chromatographia2002,55, 573.
4. Dores, E. F. G. C.; De-Lamonica-Freire, E. M.; Quim. Nova
2001,24, 27.
5. Zanella, R.; Primel, E. G.; Gonçalves, F. F.; Martins, A. F.; J.
Chromatogr. A 2000,904, 257.
6. Tomlin, C. D. S.; The e-Pesticide Manual, 13th ed. CDROM
version 3.0, The British Crop Protection Councill: Farnham, UK, 2003.
7. Penuela, G. A.; Barceló, D.; J. Chromatogr. A1998,823, 81.
8. Penuela, G. A.; Barceló, D.; J. Chromatogr. A1998,795, 93.
9. Aguera, A.; Fernandez-Alba, A. R.; Analusis1998, 26,
M123.
10. Chiron, S.; Rodriguez, A.; Fernandez-Alba, A. R.; J.
Chromatogr. A1998,823, 97.
11. Lanyi, K.; Dinya, Z.; Microchem. J.2005,80, 79.
12. Baird, C.; Environmental Chemistry, 2nd ed., Freeman and
Company: New York, 1999.
13. Bachman, J.; Patterson, H. H.; Environ. Sci. Technol.1999,33,
874.
14. Tran, A. T. K.; Hyne, R. V.; Pablo, F.; Day, W. R.; Doble, P.;
Talanta2007,71, 1268.
15. Sakkas, V. A.; Lampropoulou, D. A.; Albanis, T. A.;
Chemosphere2002,48, 939.
16. Crestani, M.; Menezes, C.; Glusczak, L.; Miron D. S.; Spanevello, R.; Silveira, A.; Gonçalves, F. F.; Zanella, R.; Loro,
V. L.;Chemosphere2007,67, 2305.
17. Miron, D. S.; Crestani, M.; Shettinger, R. M; Morsch, V. M.; Baldisserotto, B.; Tierno, M. A.; Moraes, G.; Vieira, V. L.;
Ecotoxicol. Environ. Saf.2005,61, 398.
18. Sims, G. K.; Mervosh, T. L.; Stoller, E. W.; J. Agric. Food
Chem.1995,43, 537.
19. Rosazza, J. P. N.; Yu Liu, S.; Shocken, M.; J. Agric. Food Chem.
1996,44, 313.
Received: July 30, 2007