Article
0103 - 5053 $6.00+0.00*e-mail: [email protected]
Determination of Picloram in Waters by Sequential Injection
Chromatography with UV Detection
Luciana B. O. dos Santos,a Carlos M. C. Infanteb and Jorge C. Masinib,*
aDepartamento de Ciências Exatas e da Terra, Universidade do Estado da Bahia,
Estrada das Barreiras, s/n, 41195-001 Salvador-BA, Brazil
bInstituto de Química, Universidade de São Paulo, CP 26077, 05513-970 São Paulo-SP, Brazil
Este trabalho descreve um procedimento de cromatograia por injeção seqüencial para a determinação de picloram em águas explorando a baixa pressão de uma coluna monolítica C18 de 2,5 cm de comprimento. A separação do analito da matriz foi obtida em menos de 60 s usando como fase móvel uma mistura de acetonitrila e H3PO4 5,0 mmol L-1 na proporção 20:80 (v v-1) e
vazão de 30 µL s-1. Detecção foi feita a 223 nm com uma cela de 40 mm de caminho óptico. O
limite de detecção do método é adequado para monitorar o nível de concentração máximo permitido para picloram em água potável (500 µg L-1). A frequência de amostragem é de 60 análises por
hora, consumindo 300 µL de acetonitrila por análise. A metodologia foi aplicada a águas de rio fortiicadas, não sendo observadas diferenças estatisticamente signiicativas em comparação com a metodologia convencional de HPLC-UV.
This paper describes a sequential injection chromatography procedure for determination of picloram in waters exploring the low backpressure of a 2.5 cm long monolithic C18 column. Separation of the analyte from the matrix was achieved in less than 60 s using a mobile phase composed by 20:80 (v v-1) acetonitrile:5.0 mmol L-1 H
3PO4 and low rate of 30 µL s
-1. Detection was
made at 223 nm with a 40 mm optical path length cell. The limits of detection and quantiication were 33 and 137 µg L-1, respectively. The proposed method is sensitive enough to monitor the
maximum concentration level for picloram in drinking water (500 µg L-1). The sampling frequency
is 60 analyses per hour, consuming only 300 µL of acetonitrile per analysis. The proposed methodology was applied to spiked river water samples and no statistically signiicant differences were observed in comparison to a conventional HPLC-UV method.
Keywords: sequential injection chromatography, monolithic column, picloram, waters
Introduction
The presence of pesticides in surface and ground waters is a consequence of the extensive use of these chemicals in agriculture and their runoff down through the soil proile.1
Picloram (4-amino-3,5,6-trichloro-2-pyridinecarboxilic acid) is a herbicide widely used to control weeds in crops of sugar cane (pre-emergency), rice, pasture and wheat (pos-emergency).2 This herbicide can stay active in soil
for long time, depending on the type of soil, soil moisture and temperature. It may exist at toxic levels to plants for more than one year after application at normal rates.2,3
It is chemically adsorbed onto clay particles and natural organic matter occurring in soils. If the soil is poor in clay
or organic matter contents, the herbicide may be easily leached to surface and ground waters.3-6
Determination of picloram is usually made by gas-liquid chromatography with electron capture detector or mass spectrometry detectors,7 although several high performance
liquid chromatography methods have already been proposed using either UV absorption or mass spectrometry detection modes.8-11 These methods are very sensitive,
but require the use of large sample volumes, besides to extensive extraction steps, derivatization reactions and expensive instrumentation, so that new sensitive methods that reduce the time of analysis and the use of organic solvents are needed. Electroanalytical methods are known to attend the demand for minimal sample treatment and low consumption of organic solvents,12,13 but these
of the electrode surface by naturally occurring organic matter, besides to interference from any other electroactive substances with E1/2 close to that one of the analyte.
Sequential injection chromatography (SIC) is a relatively new liquid chromatography technique14 that
explores the potentialities of sequential injection analysis for low programming15 and the low backpressures provided
by C18 monolithic stationary phases. This technique uses low cost instrumentation and has been applied especially in the determination of components of pharmaceutical products,16 although determinations of herbicides and
pesticides17,18 and amino acids19 have been described. The
present paper shows that the SIC capabilities for separation of simple mixtures can be explored for monitoring the maximum concentration levels of picloram in natural waters.20 To achieve this goal a SIC method was developed
and applied for determination of the herbicide in spiked natural waters collected in the São Paulo State, Brazil.
Experimental
Apparatus and reagents
A SIChromTM - accelerated liquid chromatography
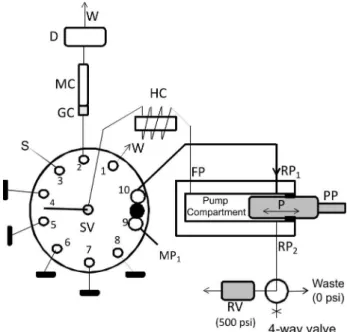
system was provided by FIAlab® Instruments (Bellevue, WA, USA) and schematized in Figure 1, where PP is a piston pump model S17 PDP from Sapphire Engineering™ (Pocasset, MA, USA) with capacity of 4.0 mL, built in ULTEM®, having a ceramic piston (P) for solution propelling and aspiration. The frontal port (FP) of PP is connected to the central port of a rotary selection valve (SV) by the holding coil (HC), which is made of 2 m of 0.8 mm i.d. Telon tubing (capacity of 1.0 mL). The rear port (RP1) of PP is connected to the main solvent reservoir (MP1) through ports 9 and 10 of SV (Figure 1). An additional port in the pump body (RP2) is connected through a 4-way valve to a relief valve (RV) from Up-Church Scientiic (Oak Harbor, WA, USA) that opens to waste at pressure > 500 psi. A Cheminert® Valco10-port multi-position valve (SV) model C25 stream selector C25-3180 EMH (Valco Instruments, Houston, TX, USA) was used to select and drive sample and mobile phase solutions though the system. Port 2 of SV is connected to a 5 mm long guard column coupled to a 25 mm reverse phase C18 Chromolith Flash monolithic column, both from Merck KGaA (Darmstadt, Germany). Detection was made by molecular absorbance spectrophotometry using an USB 4000 spectrometer (Ocean Optics, Dunedin, FL, USA) coupled to an SMA-Z-40 µvol PEEK low cell (FIAlab Instruments, Bellevue, WA, USA) with 40 mm of optical path length and 10 µL of internal volume.
A DH 2000 Deuterium Tungsten Halogen lamp (Mikropack GmbH, Germany) was used as light source. Two 600 µm diameter optical ibers (20 inches long) were used to transmit radiation from the source to the low cell and to the spectrometer. Connections of port 2 of SV to the pre-column and from the pre-column outlet to low cell are made, respectively, with 40 and 18 cm long 0.25 mm i.d. PEEK (polyetheretherketone polymer) tubing. Connection of the MP1 reservoir to SV (port 9) is made with 1/8 o.d. Telon tubing. Connection of SV (port 10) to RP of PP is made with 1.0 mm i.d. PEEK tubing. Port 3 of SV is connected to the sample reservoir (S), and, to minimize the sample consumption, this connection is made with 15 cm of 0.25 mm i.d. PEEK tubing (7.4 µL). Ports 4 to 8 were not used in the proposed methodology and were kept blocked with solid Telon tubing. The system is controlled by the FIAlab for Windows software.
An LC 9A Shimadzu high performance liquid chromatograph (HPLC), equipped with a SPD 6 AV UV detector and the LC Workstation Class-LC 10 software was used in comparison studies. An SBC18 Zorbax-HP column (3.5 µm, 150 mm × 4.6 mm) connected to a C18 Phenomenex guard column was used. Sample injection was made with a rotary Rheodyne valve using a 20 µL sample loop.
Figure 1. SIC manifold to perform determination of picloram in river waters. PP = piston pump, P = piston; RP 1 = rear port 1, RP2 = rear port 2, RV = relief valve, HC = holding coil (2 m of 0.8 mm i.d. PTFE tubing), W = waste, SV = 10 port selection valve, GC = 5 mm C18 monolithic guard column, MC = 25 mm C18 monolithic column, D = UV-Vis detector (223 nm), S = sample/standard solution, MP1 = mobile phase for isocratic elution composed by 20:80 ACN: 5.0 mmol L-1 H
3PO4. The selection valve
Acetonitrile (ACN) of HPLC grade was supplied by J.T. Baker (Phillipsburg, NJ, USA). Water used in all experiments was distilled and deionized using the Simplicity 185 system from Millipore (Billerica, MA, USA) coupled to an UV lamp. Mobile phases were iltered through 0.45 µm LCR-PTFE membranes prior to use. In all experiments a helium stream was used to remove dissolved air from the mobile phases. All other reagents used in this work were of analytical grade from Merck, Sigma or Aldrich. A stock 1000 µg L-1 solution
of picloram was prepared by dissolving the solid standard (Riedel-de Haën, purity > 97.4%, molar mass 241.46 g mol-1)
in ethanol. Working solutions were prepared by diluting these stock solutions in distilled deionized water.
Analysis of picloram
First, the pump compartment of PP, as well as HC, and the low cell are illed with the mobile phase MP1 composed by (20:80) ACN: 5.0 mmol L-1 phosphoric acid. Column
conditioning was made by performing three cycles of aspiration of 4.0 mL of MP1 inside the pump compartment at a low rate of 100 µL s-1, followed by emptying the pump
through port 2 of SV, which is connected to GC, MC and D (Figure 1), at a low rate of 30 µL s-1. Cleansing of the
sampling line is made by aspirating 50 µL of sample or standard to the holding coil, followed by discarding 300 µL (sample plus mobile phase) through port 1 of the selection valve. For calibration and analysis 1500 µL of MP1 are aspirated inside the pump compartment through ports 9 and 10 of SV (Figure 1), followed by aspiration of 100 µL of sample/standard solution inside HC through port 3 of SV (100 µL s-1). Next, the pump is emptied through port 2
at a low rate of 30 µL s-1, performing the sample injection
and analyte elution simultaneously to the acquisition data from the UV-Vis detector. Ports 4 to 8 of SV are blocked.
HPLC analyses of picloram were made by isocratic elution with a mobile phase constituted by (50:50) acetonitrile : 0.10% (m/v) phosphoric acid. The analyses were made at a low rate of 1.0 mL min−1 and injecting a
sample volume of 20 µL. The UV detector monitored the absorbance at 223 nm.
Samples
Water samples were collected in two reservoirs located in the metropolitan area of São Paulo (Brazil) used as water supplies for São Paulo City. Other samples were collected in reservoirs of Atibaia River, near to the municipality of Americana (São Paulo State), in an agricultural area dominated by sugar cane cultivation, where herbicides are extensively used. A tap water sample collected at the
laboratory was also analyzed. Water samples were iltered through a 0.45 µm cellulose acetate membrane and stored in glass bottles at 4 °C. Quantiication was performed by external calibration, preparing the standards in deionized water. Blank in all experiments was deionized water. Recovery experiments were performed by spiking the samples with 0.50 mg L−1 of picloram, adopting a delay
time of 24 h between the spike and the analysis.
Results and Discussion
Method development
The composition of the mobile phase was studied by varying the content of ACN from 10 to 30% (v/v) in relation to the 5.0 mmol L-1 H
3PO4 aqueous phase. The 30:90 ACN:
5.0 mmol L-1 H
3PO4 did not provide suitable separation
between picloram and the unretained peak. Mobile phase constituted by 20:80 ACN:5.0 mmol L-1 H
3PO4 provided the
best compromise between separation of picloram from the matrix and the length of the chromatographic runs, which were unnecessarily increased at lower ACN concentrations (10:90 ACN:5.0 mmol L-1 H
3PO4).
The influence of sample volume was studied by injecting 25 to 200 µL of a 5.0 mg L-1 picloram solution.
Peak areas increased linearly with the sample volume (S
v)
up to 100 µL, obeying the equation Area = (0.0223 ± 0.002) Sv + (0.01 ± 0.02), r = 0.9998, but for larger volumes the signals leveled off and carryover between subsequent injections was observed, so that 100 µL was used in the application of the method. Flow rates between 10 and 60 µL s-1 were studied. Although at 60 µL s-1 the analysis
could be made in about 30 s, implying in a sampling throughput of 120 analyses per hour, the low rate of 30 µL s-1 was used in the next studies to avoid leaking
problems through the relief valve (RV, Figure 1), reaching a sampling throughput of 60 analyses per hour. Flow rate of 30 µL s-1 is not applicable with conventional syringe
pumps conventionally used in SIA systems because of phase mobile leaking through the two way syringe valve .16
Figures of merit
The repeatability of the method was evaluated at two concentration levels, 0.25 and 5.0 mg L-1, resulting in
variation coeficients of 4.4 and 1.0%, respectively. Figure 2 shows the chromatograms of a typical calibration curve for picloram concentrations between 0.25 and 5.0 mg L-1,
obtained by injecting a sample volume of 100 µL and eluting the column at a low rate of 30 µL s-1. Peak area (Y) versus
Y = (0.397 ± 0.001)C – (0.002 ± 0.001) with r = 0.9998. The limits of detection (LOD) and quantiication (LOQ) were 33 and 137 µg L-1, respectively. These parameters
were computed as LOD = 3σ/ S and LOQ = 10σ/ S, where
σis the standard deviation of ten peak area measurements corresponding to the 0.25 mg L-1 solution and S is the slope
of the analytical curve.21 The Environmental Protection
Agency (EPA) deines the maximum contaminant level (MCL) for picloram in drinking water as 0.50 mg L-1,20
so that the proposed method, even using the short 25 mm column, is sensitive enough for monitoring picloram.
Selectivity
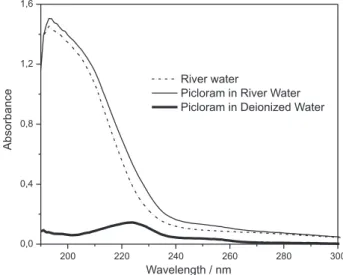
Figure 3 shows the ultraviolet absorption of picloram superposed to typical river water and spiked river water spectra, showing that the chromatographic separation is needed because natural organic matter (humic substances, polysaccharides etc) and inorganic ions such as nitrate and nitrite strongly absorb radiation in the ultraviolet region. On the other hand, these substances are polar and do not interact with the C18 stationary phase, being eluted from the column together with the unretained peak of the sample solvent (Figure 4). Chromatograms of spiked river water sample (Figure 4) shows that the mobile phase composed by 20:80 ACN:5.0 mmol L-1 H
3PO4 conferred adequate
selectivity toward the sample matrix. Additionally, because picloram is used in the agriculture in combination with other herbicides such as glyphosate, 2,4 D and paraquat, the potential interference of these compounds was studied at a concentration ratio of 1:20 for each compound (0.50 mg L-1
picloram plus 10 mg L-1 of the foreigner herbicide). No
signiicant interference was observed because glyphosate and paraquat are not retained in the stationary phase and 2,4 D elutes at distinct retention time in relation to picloram. Interference of triazine herbicides such as simazine, atrazine and propazine is not expected because these compounds require mobile phase containing higher volumetric ratio of acetonitrile (35:65),17 so that their t
R
would be longer than that of picloram using the 20:80 (v:v-1)
ACN:5.0 mmol L-1 H
3PO4 mobile phase. However, the
presence of these triazines would require column cleaning to avoid crossover interference between analyses. Cleaning could be made by increasing either the elution time or the proportion of ACN in the mobile phase. The latter approach would require column reconditioning, which could be made by the stepwise elution approach.19
Figure 2. Sequential Injection Chromatograms for calibration of the SIC system obtained by injecting 100 µL of standard at low rate of 30 µL s-1
in a mobile phase composed by 20:80 ACN: 5.0 mmol L-1 H
3PO4 Picloram
concentrations of the calibration solutions were: (a) blank, (b) 0.25, (c) 0.50, (d) 1.0, (e) 2.0, (f) 5.0 e (g) 10 mg L-1. The inset shows the linear
correlation between peak area and picloram concentration.
Figure 3. Absorption spectrum of a 0.50 mg L-1 picloram solution in
deionized water superposed to the spectra of a river water sample and river water spiked with 0.50 mg L-1 of picloram.
Figure 4. Sequential injection chromatograms of a picloram free river water superposed to a chromatogram of the same sample spiked with 0.50 mg L-1 of picloram, exhibiting the absence of interference peaks
Application to spiked waters
Five river water samples free of detectable amounts of picloram were spiked with 0.50 mg L-1 of the herbicide,
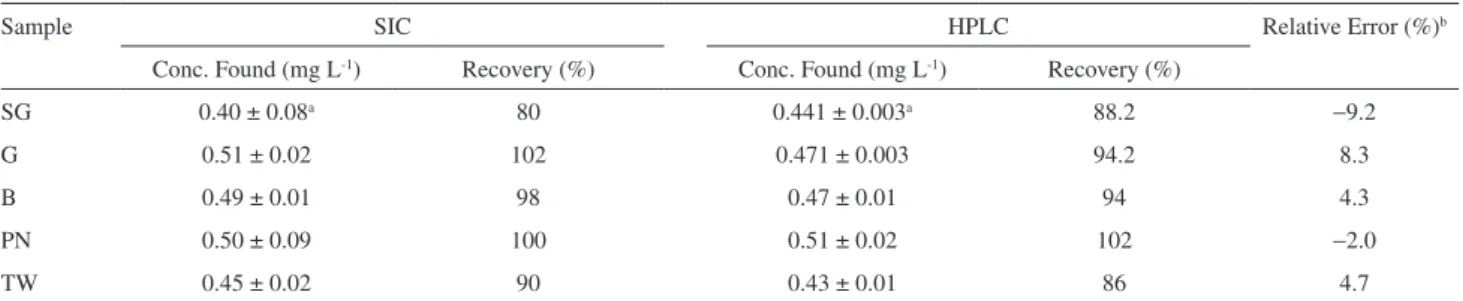
and let to stand for 24 h before analyses. Recoveries between 80 and 102% were found (Table 1). From the F test, no evidence of statistically signiicant differences was observed in the precision of the two methods at the 95% conidence level. Relative errors of −9.2 to +8.3% were observed by comparing the results obtained by SIC with those ones obtained by HPLC.10 The t test at 95%
conidence level for comparison of mean results for each sample did not show evidences of statistically signiicant differences between the two methods.
The main drawback of the SIC system is the short life time of the guard columns (up to about 100-150 injections), which are often clogged, even iltering sample and mobile phases. The clogging increases the pressure needed for mobile phase pumping, leading to leakage through either the relief valve or through the rotary selection valve, altering the retention times of the analyte. Instrumental improvements are still needed for this relatively new and promising liquid chromatography technique to enhance its robustness. For instance, to overcome leakage problems, the change of the low pressure Cheminert® Valco10-port multi-position valve by another one capable to work at pressures up to 5000 psi is recommended.
Conclusion
Sequential injection chromatography with UV detection was feasible to determine picloram concentrations in natural spiked waters at concentrations > 137 µg L-1 at a sampling
frequency of about 60 analyses per hour. Consumption of ACN is 300 µL per analysis, which is a signiicant advantage over conventional HPLC itted to conventional 5 µm packed particle column. This is an interesting feature,
attending the demand for clean analytical methods that consume less reagents and solvents.22
Acknowledgments
The authors express their gratitude to Fundação de Amparo à Pesquisa do Estado de São Paulo (FAPESP) and Conselho Nacional de Desenvolvimento Cientíico e Tecnológico (CNPq) for the financial support and fellowships.
References
1. Cardoso, L. P.; Celis, R.; Cornejo, J.; Valim, J. B.; J. Agric. Food Chem.2006, 54, 5968.
2. Groover, R.; Cessna, A. J.; Environmental Chemistry of Herbicides, Volume I, CRC Press: Boca Raton, Florida, USA, 1991. 3. Close, M. E.; Pang, L.; Watt, J. P. C.; Vincent, K. W.; Geoderma
1998, 84, 45.
4. Cerdeira, A. L.; dos Santos, N. A. G.; Pessoa, M. C. P. Y.; Gomes, M. A. F.; Lanchote, V. L.; J. Environ. Sci. Health, Part B2005, 40, 159.
5. Palma, G.; Sanchez, A.; Olave, Y.; Encina, F.; Palma, R.; Barra, R.; Chemosphere2004, 8, 763.
6. Pinho, A. P.; Matos, A. T.; Morris, L. A.; Costa, L. M.; Planta Daninha2007, 25, 125.
7. Edgell, K. W.; Erb, E. J.; Wesselman, R. J.; Longbottom, J. E.; J. AOAC Int.1993, 76, 1098.
8. Wells, M. J. M.; Michael, J. L.; Anal. Chem.1987, 59, 1739. 9. Wells, M. J. M.; Michael, J. L.; Neary, D. G.; Arch. Environ.
Contamin. Toxicol. 1984, 13, 231.
10. Palma, G.; Sanchez, A.; Olave, Y.; Encina, F.; Palma, R.; Barra, R.; Chemosphere 2004, 57, 763.
11. Capiello, A.; Famiglini, G.; Berloni, A.; J. Chromatogr., A 1997, 768, 215.
12. Massaropi, M. R. C.; Machado, S. A. S.; Avaca, L. A.; J. Braz. Chem. Soc. 2003, 14, 113.
Table 1. Picloram recoveries obtained by the proposed SIC method and conventional HPLC-UV method with a packed particle C18 column for 0.50 mg L-1
picloram spiked waters collected at the Salto Grande (SG), Guarapiranga (G), Billings (B), Praia dos Namorados reservoirs and a Tap Water (TW) sample collected at the laboratory
Sample SIC HPLC Relative Error (%)b
Conc. Found (mg L-1) Recovery (%) Conc. Found (mg L-1) Recovery (%)
SG 0.40 ± 0.08a 80 0.441 ± 0.003a 88.2 −9.2
G 0.51 ± 0.02 102 0.471 ± 0.003 94.2 8.3
B 0.49 ± 0.01 98 0.47 ± 0.01 94 4.3
PN 0.50 ± 0.09 100 0.51 ± 0.02 102 −2.0
TW 0.45 ± 0.02 90 0.43 ± 0.01 86 4.7
SIC
conc. – HPLCconc. a Standard deviation of 3 measurements; b Relative error computed as ( ————————)×100.
13. dos Santos, L. B. O.; Masini, J. C.; Talanta2007, 72, 1023. 14. Huclova, J.; Satinsky, D.; Karlicec, R.; Anal. Chim. Acta2003,
494, 133.
15. Ruzicka, J.; Marshall, G. D.; Anal. Chim. Acta 1990, 237, 329. 16. Chocholous, P.; Solich, P.; Satinsky, D.; Anal. Chim. Acta2007,
600, 129.
17. dos Santos, L. B. O.; Infante, C. M. C.; Masini, J. C.; J. Sep. Sci.2009, 32, 494.
18. Chocholous, P.; Satinsky, D.; Sladkovsky, R.; Pospisilova, M.; Solich, P.; Talanta2008, 77, 566.
19. Rigobello-Masini, M.; Penteado, J. C. P.; Liria, C. W.; Miranda, M. T. M.; Masini, J. C.; Anal. Chim. Acta2008, 628, 123.
20. http://www.epa.gov/safewater/contaminants/basicinformation/ picloram.html#ive, accessed in December 2009.
21. Thompson, M.; Ellison, S. L. R.; Wood, R.; Pure Appl. Chem. 2002, 74, 835.
22. Armenta, S.; Garrigues, S.; de la Guardia, M.; TrAC, Trends Anal. Chem.2008, 27, 497.
Received: February 4, 2010
Web Release Date: April 27, 2010