0103 - 5053 $6.00+0.00
R
e
v
ie
w
e-mail: [email protected]Electrochemical Energy Conversion – Methanol Fuel Cell as Example
Wolf Vielstich
Instituto de Quimica de São Carlos, Universidade de São Paulo, CP 780, 13566-590 São Carlos - SP, Brazil
Apresentamos aqui as limitações termodinâmicas e cinéticas da energia de conversão eletroquímica para o caso da cela de combustível metanol/oxigênio. A detecção de produtos e intermediários é demonstrada usando espectroscopia FTIR in situ e espectrometria de massas on line. A catálise bifuncional da oxidação do metanol pelas superfícies do tipo PtRu é explicada. Discutimos a formação de HCOOH e HCHO através de passos paralelos reacionais. Um exemplo da tecnologia do sistema DMFC é apresentado.
Thermodynamic and kinetic limitations of the electrochemical energy conversion are presented for the case of a methanol/oxygen fuel cell. The detection of intermediates and products is demonstrated using insitu FTIR spectroscopy and online mass spectrometry. The bifunctional catalysis of methanol oxydation by PtRu model surfaces is explained. The formation of HCOOH and HCHO via parallel reaction pathways is discussed. An example of DMFC system technology is presented.
Keywords: energy conversion, electrocatalysis, fuel cell system, methanol oxidation, reaction pathways
1. Introduction
One of the most interesting developments in Electrochemistry of the last decade is the conversion of chemical energy into electricity via fuel cells. The surprising progress in the field was only possible on the basis of intensive studies on the processes at the fuel anode and the oxygen cathode. This will be shown for a characteristic example, the direct oxidation of methanol. But a review on the development of methanol electrocatalysts is not at all the aim of this article.
The high energy content of the chemical reaction of methanol and oxygen can deliver for the electrochemical pathway under ideal conditions as much as 6 kWh per kg of methanol. In opposition to the electrochemical reaction of hydrogen, the oxidation of methanol requires special attention due to the difficulty in splitting the molecule, adsorbed at the catalyst surface, and the complication of several parallel reaction pathways.
The detection of intermediates and products as well as the reaction model in the form of parallel pathways is demonstrated. The simultaneous application of experimental methods such as Cyclic Voltammetry, Infrared Spectroscopy, on-line Mass Spectrometry and Scanning Tunneling Spectroscopy was determining for the progress
made. In addition to the outline of Electrocatalysis, the kind of problems which have to be solved are discussed, in order to build not only a single cell but a complete fuel cell system. The development in the technology of one example of a Direct Methanol Fuel Cell (DMFC) will be shown.
2. Thermodynamic of Energy Conversion
1,23. Electrochemical Reactions at Anode and
Cathode of a Fuel Cell
1,3Let’s come back to the reactions in a fuel cell. As an example, we apply a methanol/water mixture as fuel and air as oxidant (Figure 2). The total chemical reaction follows
CH3OH + 3/2 O2→ CO
2 + 2 H2O (1)
and is split into two steps at two different places. At the anode we have
CH3OH + H2O → CO 2 + 6H
+ + 6e- (2)
and at a stationary mode, part of this water has to be introduced at the fuel compartment again. In addition, after the operating temperature is obtained, the heat formed (compare Figure 1) has to leave the cell via a cooling device. From Figure 2, it is clear that a closed methanol/air fuel cell system has to have an automatic control device, for circulating methanol, water, air, CO2 and heat.
The standard free energy of reaction (1) is ∆G = -692.2 kJmol-1. From this follows for a 6 electron charge transfer a
standard cell voltage of 1.21V and an energy density of 6 kWh/kg methanol.
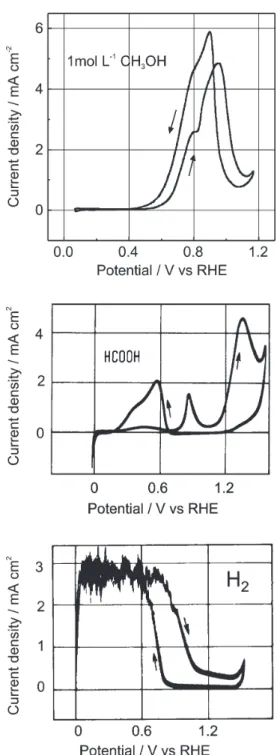
A first view about the reaction kinetics can be obtained via cyclic voltammograms (CV), using elected electrode materials. Figure 3 presents the well known CV’s’ for methanol and its soluble intermediate products, formaldehyde and formic acid, for the case of a platinum electrode in sulfuric acid. The CV for hydrogen is given for comparison.3 Three important informations are: (i) the
oxidation does not start at the thermodynamic data near the hydrogen potential in the same electrolyte, (ii) the observed maxima have nothing to do with the Matsuda curves, determined by charge transfer and diffusion,1 (iii)
on the cathodic scan the maxima occur at more negative potentials. For more information, we now apply FTIR and MS analysis, and we study the influence of electrode material and surface structure.
4. Intermediates
via
FTIR and MS Analysis
It is more than a decade that Kunimatsu did find by analysis of insitu IR spectra, in CH3OH/H2SO4 solution on platinum surfaces at 400 mV RHE, bands for linearly bonded CO.4 In both cases in Figure 4, saturated solution
of CO and methanol solution, one has a total coverage of 0.86. But the IR signal is smaller for methanol, suggesting that other particles than CO from the splitting of the methanol molecule must be adsorbed also. Improving the IR technique, Iwasita et al.5 obtained spectra with bands of
bridge bonded and multi bonded CO, with bands of COH
and HCOOCH3. An example shows Figure 5.
Figure 2. Flow of reactants, water, CO2 and heat for a Direct
Metha-nol Fuel Cell (DMFC).
Figure 1. Dependence of cell voltage E of a fuel cell, with reaction
entropy ∆S<0, on the current load, i. E0 thermodynamic cell
volta-ge, E0 = - ∆G/nF, E0
H = - ∆H/nF, E* cell voltage at current i*, RE
HCOOCH3 is a product of the solution reaction of HCOOH with methanol. The formation as function of potential is presented in Figure 6, a combination of a current/potential scan and an online MS analysis (DEMS).6
Using a porous catalyst layer, supported by a porous
membrane, as a window to the MS, formation and
consumption of volatile species can be followed. The current/potential scan in the upper part of Figure 6 is taken at a porous PtRu surface in contact with methanol solution.
Figure 3. Cyclic voltammograms of methanol and formic acid
oxida-tion on smooth polycrystalline Pt, hydrogen oxidaoxida-tion for compari-son, 0.5 mol L-1 H
2SO4, 50 mV/s, 20 °C. Adapted from reference 3.
Figure 5. Insitu FTIR spectra for Pt(111) in 0.5 mol L-1 CH
3OH/
0.1 mol L-1 HClO
4, with reference spectra at 0.1V RHE. Adapted
from reference 5.
Here, the current peak is due to the oxidation of split H atoms. Below 300 mV, no CO2 is formed as stated by the mass signal m/e = 44 (lower part of Figure 6). Above 300 mV
Figure 4. Polarisation modulated IR spectra of linear bonded CO
from CO saturated solution and from CH3OH/0.1 mol L-1 H 2SO4.
5. Bifunctional Catalysis by PtRu Model
Electrode Surfaces
Already in 1964 Bockris and Wroblowa8 and in 1970
Sandstede et al.9 did demonstrate that at a given oxidation
potential, one observes an increase in the rate of methanol oxidation if platinum is replaced by PtRu alloys. Due to the above observation that CO is an adsorbed intermediate, and due to the fact that the oxidation of CO requires a second oxygen atom, and Ru is splitting water at low potentials easier than Pt, Watanabe10 assumed the following
bifunctional mechanism:
Ru-H2O → Ru-OH + H+ + e- (4)
Pt-CO + Ru-OH → Pt + Ru + CO
2 + H
+ + e- (5)
From this model for the mechanism it is expected that the distribution of Ru and Pt sites in the surface of the catalyst must be a sensible factor for catalyst activity. One example would be the formation of small Ru islands on a
Figure 6. First current/potential (above) and mass
intensity/poten-tial (below) scan for a porous PtRu(3:1) electrode in 1 mol L-1
CH3OH/0.5 mol L-1 H
2SO4, starting at 50 mV RHE, v = 10 mV/s,
m/e = 44 for CO2 and m/e = 60 for HCOOCH3. Adapted from refe-rence 7.
current density after 20 min of a potential step to 500 mV RHE, is arbitrarily chosen.
With the alloys, we obviously have the optimum geometric positions, and under the present experimental conditions of methanol concentration and operating
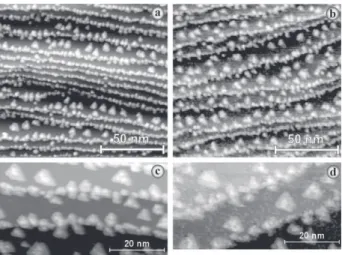
Figure 7. (a) Ru islands grown in UHV on Pt(111) at room
temperature, the highest, almost constant activity is obtained between 15 and 40% ruthenium.
Interestingly, for all smooth samples (smooth alloys and Pt(111)), one observes a current decrease with time. Figure 9 shows that this is not due to a change in surface structure.12 The topography of the Pt(111)/Ru surface
remains unchanged after 50 min of current load at 500 mV. The origin of the decay in current has still to be discovered. More important for the application in fuel cells is the respective behavior of porous catalyst surfaces. The electrode, used in the experiment of Figure 10, was prepared on a gold substrate with electrodeposition out of a 20 mmol L-1 H
2PtCl6 + 2 mmol L -1 RuCl
3 solution at
100 mV RHE for 15 min.11 According to EDXS
measurements the composition was Pt:Ru = 81:19. The constant current response is comparable with results of other authors.13,14 The two little steps in current near 4 and
14 min of time are caused by the formation of CO2 bubbles.
6. Parallel Pathways of Methanol Oxidation
Studying the different pathways of methanol oxidation on platinum in acid media via CO, COH and HCOOH, one important fact is certainly the formation of formaldehyde. Here, the determination of small amounts is difficult. Using IR reflection spectra one obtains only very weak signals. Characteristic signals in mass spectrometry are also absent. An interesting contribution is presented by Ota,15 using PtPt
electrodes and standard analytical methods (Figure 11). Following the rate of CO2 formation and the concentrations of HCHO and HCOOH in solution with time, these data of at least three different parallel pathways become constant only after about 20 h. After this time, obviously the rates of formation for the two soluble intermediates become equal to the rates of consumption at the electrode.
It is to be expected that the contribution of different pathways not only change with time but that it is also sensible to electrode material and structure. Indeed, this has been proved recently by comparing faradaic currents and the rate of CO2 formation for two different PtRu alloys.16
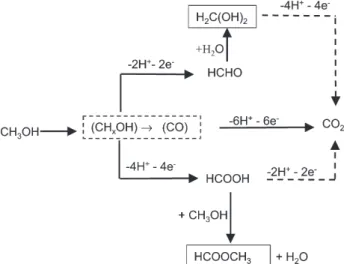
For a simplified description of methanol pathways, we can use the diagram of Figure 12. For more detailed informations see Iwasita.17
7. A 40 watt Methanol/Air Fuel Cell System as
Example of Present Technology
The oxidation of methanol in acid electrolyte, as in the DMFC of Figure 2, has the advantage that according to equation (1) two molecules of water are formed per molecule of methanol. This fact supports the closed system operation where sufficient water has to be introduced in the fuel compartment, together with methanol. The 40 watt unit of Figure 13 is using its electronic device for
Figure 8. Activity of smooth PtRu surfaces for methanol oxidation,
data after 20 min of current/time transient at 500 mV as measure for activity. Data of different PtRu surfaces as function of Ru content. Adapted from reference 11.
Figure 9. Surface topography of a PtRu electrode, before (a, c) and
after (b, d) of 50 min current load at 500 mV.12
Figure 10. Current/time behavior of a PtRu(81:19) deposit at 500 mV
in 2 mol L-1 CH
3OH/0.1 mol L -1 HClO
4, 20 °C. Adapted from
Figure 11. Parallel pathways for methanol oxidation, load 25 mA at 25 °C, 5cm2 Pt/Pt (RF 690), 1 mol L-1 CH
3OH/1 mol L -1 H
2SO4; (A)
change in potential, (B) formation of CO2 (via gas chromatogra-phy), (C) concentration of HCHO (via colorimetry) and HCOOH (via iodometric titration). Adapted from reference 15.
Figure 12. Simplified pathways for methanol oxidation.
controlling the flow of methanol and air, for the circulating of water and for the adjustment of the operation temperature at e.g. 60 °C, including respective heat balance regulations.18 In addition, the control device takes care for
the exhaust of the final product CO2. An example of the remarkable long time performance is given in Figure 14.
8. Closing Remarks
Catalysts with increasing reactivity for methanol oxidation could be the basis of DMFC system applications not only for low power stand by uses like in the example of Figure 13, but for power devices in mobile units also. At present, the study of new type catalysts like PtRuMo or PtRuSn is been done in many laboratories. If new catalysts are able to break C-C bonds in a sufficient manner, even the use of ethanol as fuel would be possible.
References
1. Hamann, C.H.; Hamnett, A.; Vielstich, W.; Electrochemmistry,
Wiley-VCH: Weinheim, 1997.
Figure 13. The 40 watt PEM DMFC fuel cell system from
Smartfuelcells, Brunnthal/Germany, working at ambient air, 200 mA/cm2 at 400 mV cell voltage, 12 volt stabelized, 60 °C,
1 mg/cm2 PtRu(50:50), 1 Wh/cm3 methanol.19
Figure 14. Life time performance of Smartfuelcell electrodes in
0.4 mol L-1 CH
3OH at 200 mA/cm2 and 110 °C, degradation rate
2. Vielstich, W. In Handbook of Fuel Cells; Vielstich, W.; Lamm, A.; Gasteiger, H. eds., Wiley: Chichester, 2003, vol. 1, pp. 26-30.
3. Vielstich, W.; Fuel Cells, Wiley: New York, 1970.
4. Kunimatsu, K; Ber. Bunsenges. Phys. Chem. 1990, 94, 1026. 5. Iwasita, T.; Xia, X.H.; Liess, H.D.; Vielstich, W.; J. Phys. Chem.
B 1997, 101, 7542.
6. Bittins, B.; Cattaneo, E.; Königshoven, P.; W. Vielstich, W. In
Electroanalytical Chemistry; Bard, A. ed., Marcel Dekker: New York, 1991, vol.17, pp. 182-219.
7. Krausa, M.; Vielstich, W.; J. Electroanal. Chem. 1994, 379, 307.
8. Bockris, JO’M.; Wroblowa, H.; J. Electroanal. Chem. 1964,
7, 428.
9. Binder, H.; Köhling, A.; Sandstede, G. In From Electrocatalysis
to Fuel Cells; Sandstede, G. ed., Univ. of Washington Press: Seattle, 1972, pp. 43-79.
10. Watanabe, M.; Motoo, S.; J. Electroanal. Chem. 1976, 69, 429.
11. Hoster, H.; Iwasita, T.; Baumgärtner, H.; Vielstich, W.; Phys.Chem.Chem.Phys.2001, 3, 337.
12. Hoster, H.; PhD Thesis, Uni-Bw München, Germany, 2001. 13. Chu, D.; Gilman, S.; J. Electrochem. Soc. 1996, 143, 1685. 14. Aramata, A.; Matsuda, M.; J. Electrochem. Soc.1991, 138,
1949.
15. Ota, K.I.; Nakagawa, Y.; Takahashi, M.; J. Electroanal. Chem.
1984, 179, 179.
16. Batista, E.; Hoster, H.; Iwasita, T.; J. Electroanal. Chem., in press.
17. Iwasita, T. In Handbook of Fuel Cells; Vielstich, W.; Lamm, A.; Gasteiger, H. eds.; Wiley: Chichester, 2003, vol. 2, pp. 603-624.
18. Müller, J.; Frank, G.; Colbow, K.; Wilkinson, D. In Handbook of Fuel Cells; Vielstich, W.; Lamm, A.; Gasteiger, H. eds.; Wiley: Chichester, 2003, vol. 4, pp. 847-855.
19. Müller, J.; private communication, 2002.
Received: February 5, 2003
Published on the web: August 14, 2003