Bioinformatics of the sugarcane EST project
Guilherme P. Telles*, Marília D.V. Braga, Zanoni Dias, Tzy-Li Lin, José A.A. Quitzau,
Felipe R. da Silva and João Meidanis
Abstract
The Sugarcane EST project (SUCEST) produced 291,904 expressed sequence tags (ESTs) in a consortium that involved 74 sequencing and data mining laboratories. We created a web site for this project that served as a ‘meeting point’ for receiving, processing, analyzing, and providing services to help explore the sequence data. In this paper we describe the information pathway that we implemented to support this project and a brief explanation of the clustering procedure, which resulted in 43,141 clusters.
INTRODUCTION
The application of expressed sequence tag (EST) technology has proven to be an effective tool for gene dis-covery (Adamset al., 1991), gene mapping (Schuler, 1997) and the generation of gene expression profiles (Boguski and Schuler, 1995).
EST projects are usually conducted by a single labo-ratory, which prepares the cDNA libraries, isolates and se-quences clones, analyzes the data and submits it to GenBank. However, the Sugarcane EST project (SUCEST) involved the cooperation of 24 sequencing laboratories, a bioinformatics laboratory, a coordinating laboratory, 50 data mining groups scattered throughout Brazil and an in-ternational relations group. A new Brazilian bioinformatics group also became associated with the project during a later phase. Starting early in 1999, in 15 months the SUCEST project generated 291,904 sequences from 260,352 clones from 37 different libraries.
Brazilian genome research has been consor-tium-based since its first project, the sequencing of the complete genome of the phytopathogenic bacterium Xylella fastidiosa(Simpsonet al., 2000), conducted by the Organization for Nucleotide Sequencing and Analysis (ONSA network). Although a consortium-based genome project provides a larger number of researchers, technicians and sequencing machines it demands a much more orga-nized data flow. In the SUCEST project, the Bioinformatics Laboratory (Laboratório de Bioinformática - LBI) was re-sponsible for receiving data from a network of sequencing laboratories, assessing quality, storing and clustering the data, and providing many other services. In this paper these tasks are described in some detail and quantitative figures from the project are given.
METHODS
Computational systems
For a short time in the beginning of the project, the SUCEST web site was hosted by a personal computer with 128 MB of memory running the Linux operating system (Red Hat 6.2) but now the site resides on a Compaq AlphaServer ES40 with two Alpha 667 MHz processors, 8 GB of RAM and 384 GB of hard-disk storage space run-ning OSF-1 operating system version 4.0G. However, the bulk of the project was executed on a Compaq AlphaServer DS20 with two Alpha 500 MHz processors, 4 GB of RAM and 144 GB of hard-disk storage space running OSF-1 ver-sion 4.0F. Since this was the system on which most of the tools were developed we will concentrate on it for the rest of the paper.
The Web engine server is Apache (www.apache.org) version 1.3.9. Programs were written in Perl version 5.005 (www.cpan.org), and PHP version 3.0.12 (www.php.net). The database management system is MySQL version 3.22.26a (www.mysql.com).
Input data consisted of data received through web forms, including chromatograms produced by ABI 377 se-quencing machines (Applied Biosystems), and data mining reports in HTML format.
The base calling and sequence extraction programs used were phred version 0.980904.e (www.phrap.org) and phd2fasta version 0.990622.d (www.phrap.org). The se-quence comparison programs used were cross-match ver-sion 0.990319 (www.phrap.org) and blastall verver-sion 09/19/1999 (www.ncbi.nlm.nih.gov) that implements the BLAST algorithm (Altschulet al., 1997). Assembly pro-grams were phrap version 0.990319 (www.phrap.org) and CAP3 (Huang and Madan, 1999). Off-the-shelf scripts
were used to provide search by keywords in the reports pro-duced by data mining groups, database administration and other minor tasks. Each piece of software used is either free for academic purposes or was developed by our team.
Computational methods
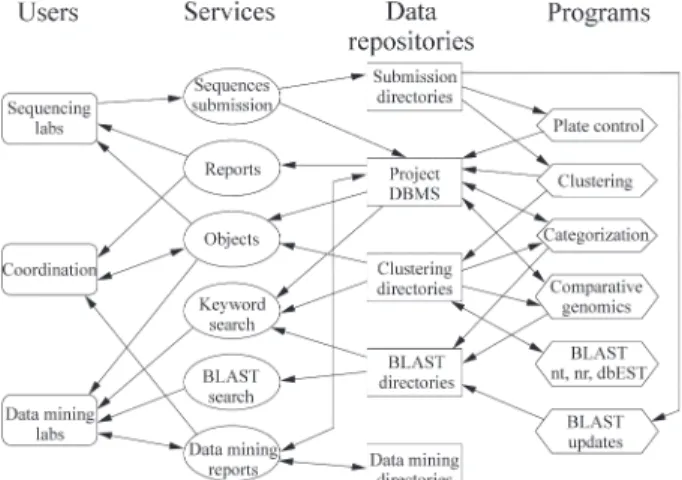
From a computational point of view, SUCEST may be seen as a large data repository and as a provider of Internet-based services for a community of different users. Figure 1 shows the major relationships between users, ser-vices, data and programs in the project.
There are several types of users: members of sequenc-ing laboratories who submit chromatograms from clone li-braries, members of data mining laboratories who perform searches on the project database and publicize their results in data mining reports, and members of the project coordi-nation team who monitor the status of the project and the distribution and validation of control plates. These users in-teract with data through services that add to, retrieve from, and update the data repositories.
Data include sugarcane ESTs, information about pro-ject members, data mining reports, control data, summaries and the output from programs that perform automated searches in databases, organize the sequences into clusters and the clusters into categories. In the following para-graphs we describe the users, data, and SUCEST services and programs, showing how they interact.
DEFINITIONS
Objects
In the SUCEST project data is stored in two different kinds of repositories: operating system directories and a re-lational database. The directories hold biological sequence files, results from BLAST and cross-match searches in bio-logical databases, and data mining reports. Biobio-logical
se-quence files include chromatograms, files in a standard for-mat called fasta format (www.ncbi.nlm.nih.gov/ BLAST/fasta.html), quality files, and files generated by clustering, categorization and comparative genomics pro-cedures. The project uses only one relational database, with several interconnected tables that store other biological and management data,e.g.libraries, sequencing plates and data on laboratories and their members. The database also points to data in directories. The major entities (objects) in our da-tabase are described below, where we also introduce quan-titative figures and details from the project’s pipeline.
Laboratories
There are 78 laboratories involved in the SUCEST project that belong to one or more of five groups: the DNA Coordination Group, the Bioinformatics Group, the Data Mining Group, the Sequencing Group and the International Cooperation Group. Each participating laboratory is identi-fied by a two-letter code. The services and data that a mem-ber of a particular laboratory can access depend on the group to which the laboratory belongs. A member of each laboratory is designated as being the head of the unit in-volved in SUCEST-related work and receives notification of some of the activities performed by the laboratory mem-bers.
Members
A SUCEST member is a person who belongs to at least one laboratory. Several members belong to both a se-quencing laboratory and a data mining laboratory. Data held on members include their name, the laboratories to which they belong, their e-mail address, phone numbers and a login name and password to grant access to autho-rized services. SUCEST had 256 members as at March 25, 2001.
Libraries
The ESTs included in the SUCEST database came from 37 different libraries prepared from different sugar-cane tissues under different conditions (Vettore et al., 2001). The name and description of the library and vector employed in cloning were recorded for each library. Each library received a two-letter code indicating the tissue from which the library was derived, together with a consecutive number assigned for every new library derived from the same tissue. For example, LR1 indicates that the library came from leaf roll (LR) with long inserts (library 1) while LR2 shows that the library came from leaf roll (LR) with small inserts (library 2). There are three possibilities for the status of each library: ‘test’ for validating libraries, ‘start’ for libraries released for sequencing and ‘stop’ when the DNA Coordination Group decides it is not worth continu-ing to sequenccontinu-ing a distributed library. Of the 37 libraries prepared for the project, 32 were started and 5 were aban-Figure 1- Major relationships between users, services, data and programs
doned after the `test’ phase. Those not formally started ei-ther produced too much redundancy or very small reads.
Plates
SUCEST clones are organized in 96-well plates that hold clones from the same library in an 8 x 12 grid. Se-quencing is done for a whole plate and the data is sent to the LBI for processing and storage. Data for a plate include the library that it came from and the laboratory that is autho-rized to send data on this plate. A plate has a three-digit identification tag, except for control plates (see below), which have the letter ‘C’ and two digits. The SUCEST data-base holds data from 2,771 different plates.
Reads
Reads are the same as ESTs and are extracted using the phred program from chromatograms submitted by the sequencing laboratories and screened for vectors with the cross-match program. All reads are stored in directories as chromatogram files and also as a pair of text files holding the sequence and its quality in fasta format. For every read the following attributes are stored in the database: the plate and the position on the plate where the read came from; in-formation about the submission process (e.g.date and time of submission); the number of vector and non-vector bases with phred quality equal to or higher than 20; the number of vector and non-vector bases with phred quality less than 20; the starting and ending positions for every vector sequence identified in the read and whether or not the read has rele-vant data (see preparation sheet below.)
Every read has a name that is a concatenation of its laboratory, library and plate codes, plate position and read direction (5’ or 3’). For example, reading from right to left, the string SCACAD1001A01.g is the name for the 5’ read (3’ uses .b as a suffix.) of the clone in well A01 of plate 001 of library AD1, sequenced by laboratory AC. The prefix SC stands for sugarcane. Every position on the plate is identi-fied by its row (A to H) and column (01 to 12).
Preparation sheet
Before a laboratory can sequence and submit a plate, it must provide a sheet of information about the process used to prepare the plate. There are records in the database for every well where bacteria did not grow and for the wells from which it was not possible to obtain DNA. Every well marked as a problem corresponds to a sequence without in-formation relevant to the project.
Control plates
For every set of 12 plates a control plate is built using the 8thcolumn of each controlled plate, so 12 columns make one control plate that is sequenced. The sequences from both control and controlled plates are compared against each other using cross-match, and the matches are stored in the database. A criterion, based on the matches distribution
over the control and controlled plates, was established to automatically mark plates that probably had tracking and naming errors due to plate preparation and sequencing pro-cesses. Matches distributions could be visualized via a web service, and plates with problems could be fixed and resub-mitted by the laboratory that produced them.
Clusters
SUCEST reads are grouped by the clustering proce-dure described below, which creates sets of aligned reads that we call clusters. In our database we store the reads that are part of each cluster. Moreover, in addition to being a set of reads, a cluster has an alignment and a consensus se-quence. Alignments, consensus sequences, and quality files are stored in cluster directories. A cluster also has a name, which is equal to the name of oldest read in the cluster.
Services and programs
Data enter and are retrieved from the SUCEST data repository through a set of services available on web pages hosted at LBI. Data is also generated within the LBI by pro-grams that are executed either automatically or manually. Brief descriptions of these services and programs are pre-sented below and provide a general overview on how the SUCEST web site is organized and how it works.
Data retrieval
Data is retrieved from the SUCEST database in units called ‘objects’ which are the same as the data entities de-scribed above under ‘Definitions’. Each object has its own web page containing information about the object and links to any other object, service or report directly related to it. Starting from a laboratory or library object it is possible to reach the web page of any other object. Some objects point to pages that include data extracted from the directory structure of the project. For instance, one can visualize reads and its qualities in many versions: immediately after submission but before screening, after screening but before trimming (see below under ‘Clustering and Trimming’) and after trimming. For clusters, it is possible to see the reads in a cluster and their alignments, including the con-sensus.
Anobject searchservice was created to allow direct access to any object. Given the code and the type of the ob-ject, the service delivers its page. For the ‘Member’ object type it is possible to search by name, email, department, city or institution.
SUCEST database users who are SQL (Structured Query Language) literate may take advantage of a service that allows generic queries to the database. Queries can be typed in a web form and the results are returned in tabular fashion. Entity-relationship diagrams and table descrip-tions for our database are available to help users in this task.
Sequences submission
Sequences are submitted by sequencing laboratories only, the submission process requiring the user to access the project’s web site using a valid login/password pair to upload a set of 96 chromatograms (i.e.one plate). When an upload finishes certain pre-requisites are verified: all chro-matograms must belong to the same plate, the laboratory that is trying to submit a plate must be the one authorized to do so, the preparation sheet for that plate must have already been submitted and the reads must be in accordance with the naming conventions.
If the pre-requisites are satisfied, the phred and phd2fasta programs are used to extract the sequences and their qualities in fasta format from chromatograms and the cross-match program is used to mask vector sequences in
the reads. These steps take only a few minutes (this time has essentially been constant during the project because the analysis done upon submission does not depend on the other reads present in the repositories).
After submission analysis, a report that summarizes the process and the sequences received is presented to the submitter who is asked to confirm the submission or not. If the submission is confirmed, the database is updated and if there is an older version of the plate it is replaced. Direc-tories are updated as well. If the submission is not con-firmed (e.g., if the submitter is not happy with the quality assessment) the submission is discarded.
Figure 2 shows the path followed by a read in the LBI, starting from the submission. The submission procedure corresponds to the part of the figure starting at ‘Zip file’, extending through top line and reaching the ‘Report Gener-ator’. Other steps in the diagram are performed by pro-grams described in the following sections.
Clustering and trimming
Clustering of ESTs is important to reduce the amount of sequence data that miners have to look at, and to
nize the reads in a less redundant set. In the SUCEST data-base, clustering had as an additional motive the need to estimate the level of redundancy in the libraries.
Early on two pivotal decisions were made, the first being that each cluster should reflect a transcript rather than a gene, allele or other biological entity while the second was that a cluster consists not only of a set of reads but also of an alignment of these reads.
In this context, our first scheme was to group similar transcripts and to produce consensus sequences using the assembly program phrap. This strategy was sufficient in the early stages of the project but, as data accumulated, a series of problems forced us to change the scheme, as described below.
To minimize artifacts, reads were trimmed before clustering. This trimming procedure started with vector masking using the cross-match program followed by re-moval of some of the poly-A, vector and adapter regions. A quality trimmer was also applied, removing bases from the ends of the sequence one by one until there were at least 12 bases with phred quality above 15 in a window of 20 bases at the end. Reads were also checked for contamination againstXylella fastidiosa,Xanthomonas citri,Escherichia coliand other potential contaminants that could be present in the laboratories that produced the libraries. BLAST was used to compare the reads and potential contaminators and if a match of at least 100 bases and more than 90% identity occurred the read was marked as probably being due to con-tamination. However, marked reads were kept in clustering and subsequent analyses to allow data miners to decide for themselves whether or not a specific read was contami-nated.
Trimmed reads were assembled using the phrap pro-gram with quality and stringent arguments (-penalty -15 -bandwidth 14 -minscore 100 -shatter_greedy). Every contig and singlet produced by phrap was taken as a cluster. As new plates came in, a program automatically updated the database, directories and BLAST results for every clus-ter that changed and was already in the database. Initially, clustering was performed every day but as the set of se-quences grew the updates became sparser, running once a week. In the final phases of the project, clustering would typically occupy an entire processor for about 20 hours.
The last assembly done with phrap included 261,609 trimmed reads and produced 81,223 clusters. However, changes were made due to remarks made by several mem-bers of the project that the total number of clusters in the da-tabase was unreasonably large, that many clusters were malformed and that some clusters appeared as if they could be combined. These changes are described in detail by Telles and da Silva (2001). The new scheme was based on careful testing and evaluation, and consisted of a more elab-orate trimming procedure, the use of the CAP3 assembler (Huang and Madan, 1999), which is the same tool used to
produce TIGR’s gene indices (Quackenbushet al., 2000). Trimming in this new procedure included ribosomal RNA removal, comprehensive removal of poly-A, poly-T, vector and adapter regions and improved low-quality-end trim-ming. CAP3 was fed with 237,954 reads and their quality data and produced 43,141 clusters.
Both clustering versions are accessible through the project web site, with data from both methods available for most services.
Keyword search
Keyword search is a service that allows users to search for a set of keywords in the header lines of every se-quence in NCBI’s nr, nt and dbEST databases (www.ncbi. nlm.nih.gov) that hits any cluster in SUCEST. To perform a query the user gives a database name (nr, nt or dbEST), a logical expression of keywords (that may include ‘or’ and ‘and’ connectors) and the maximum e-value required (an optional parameter which defaults to 1e-5 = 10-5). The ser-vice then returns the clusters that have a hit with the ex-pected or better e-value, and whose subject heading contains words satisfying the logical expression. The re-sulting list of clusters is ordered by e-value.
A program was created for keeping BLAST results against nr, nt and dbEST up to date for all SUCEST clus-ters. A BLAST result against a certain database is consid-ered outdated for a SUCEST cluster if the cluster was newer than the result or if the cluster or the database were modified after the last BLAST run. When the program finds outdated BLAST results it builds a queue giving priority to older clusters. If the databases are on different computers the system is able to reduce the processing time by running several BLASTs in parallel (one on each remote server) and takes about 2 or 3 days. If the databases are on a single com-puter, BLAST searches take considerably longer.
Subclustering
This service is used to evaluate statistics about sub-sets of clusters obtained by clustering, including read fre-quency by cluster size, total reads, total clusters, redundancy and novelty. To select the subset of clusters, the user has to indicate the reads that belong to the clusters. Any cluster that contains a read in the selection is included in the evaluation. To locate reads, one or more elements (laboratory, library, plate, position and direction) from their names should be selected,e. g. selecting a particular labora-tory will generate the statistics for the clusters that have at least one read sequenced by that laboratory.
BLAST search
Data mining report
Data mining groups submit HTML formatted reports to the SUCEST site and update them periodically. Users may access reports through an index page that provides ac-cess to the reports of every data mining group and a key-word search is also available. When a report archive is uploaded a service takes care of unpacking the files and up-dating the index page and the search index. Information about reports is also kept in the SUCEST database, includ-ing the name and a summary of the project, its members and a submission date and submitter name.
Categorization
SUCEST members tried to categorize the clusters in the project, in an attempt to determine their function and to aggregate information. Thirty categories were defined, and 32,438 proteins with known function were selected from public databases to serve as examples in each category. Public databases included MIPSArabidopsis thaliana data-base (mips.gsf.de), Clusters of Orthologous Groups - func-tional annotation (www.ncbi.nlm.nih.gov/COG/), EGAD cellular roles (www.tigr.org/docs/tigr-scripts/egad_scripts /role_report.spl) and others.
Categorization was achieved by two methods: auto-matic and manual. In autoauto-matic categorization a database was constructed containing the proteins selected from pub-lic databases and a BLAST search was performed against this database using SUCEST clusters as input. Any cluster was considered to be in category X if it matched a category X sample protein with an e-value better than or equal to 10-10and covered 70% or more of the example. A cluster could be in many different categories. This method catego-rized 36% of the 43,141 clusters. For manual categorization a web service was built to allow manual annotation when automatic annotation produced ambiguous categorization or produced no categorization at all. Based on BLAST re-sults against the nr database, SUCEST members were able to establish a direct relation between a cluster and a cate-gory. Manual annotation significantly increased the num-ber of categorized clusters and as of March 20th, 2001, 60.5% of the clusters were categorized.
Comparative genomics
To obtain information on sugarcane and its relation-ship to other species, SUCEST cluster consensi were com-pared against other organisms. The first organism selected for comparison was the model plantArabidopsis thaliana. Every cluster consensus was BLASTed againstA. thaliana chromosomes, proteins and ESTs. Clusters that produced no matches against A. thaliana, were also BLASTed against ESTs fromLycopersicon esculentum,Glycine max, Lotus japonicus,Hordeum vulgare,Oryza sativa,Sorghum bicolor, Zea mays, Triticum aestivum and Medicago truncatula. Results from these searches were inserted in our database, allowing queries to determine the distribution of
these hits per library, per cluster, or some other grouping criteria.
Management
These services provide a way for the DNA Coordina-tion Group to input management informaCoordina-tion into the SUCEST database. This information is used mainly by ser-vices that perform checking and summarizing operations. Using the library management services, the DNA Coordi-nation Group modifies the status of any library and assigns plates to sequencing laboratories. Manual plate approval is also possible via a service that displays control and con-trolled plates showing which cells match in control and controlled plates.
DISCUSSION
A key aspect of the project was the close interaction between the biological laboratories and the LBI. Discus-sion lists or telephone calls were used so that users could give suggestions for new services and quickly point out problems with the services (broken links, bugs, etc.) This daily, intensive interaction was undoubtedly one of the main reasons for the success of the project.
Clustering started early and had a dramatic impact during the project. Re-clustering on a regular basis de-manded designing and implementing programs to update databases and BLAST results against the nr, nt and dbEST databases, and also used a lot of processor time. When an-other clustering scheme was adopted the web site had to change to accommodate both versions simultaneously and to show relationships between clusters in different versions and both bioinformatics and data mining staff needed some time to adapt to the changes.
The two most important lessons learnt during the SUCEST project were ‘avoid changing systems’ and ‘keep reference sequences, not cluster lists’ which we will discuss in more detail in the following paragraphs.
phys-ical disks into one big volume of, say, a few hundred giga-bytes. Most vendors provide such software for a small fee.
It is also important to keep reference sequences in-stead of lists of clusters. In this project, data accumulated at a fast rate and clustering was redone frequently. Some data mining groups had problems trying to keep up with the fre-quent updates because they maintained lists of relevant clusters. Each time the clustering was redone some clusters would disappear (merge into larger ones) or the read com-position of a cluster would change, requiring a lot of man-ual labor. Our advice would be to use reference sequences from Genbank or another stable sequence database, which can then be used as queries to retrieve the cluster lists via BLAST. Proceeding in this way lists can be quickly recon-structed from the reference sequences using automated methods.
There are many other programs, not presented here, that contribute to the functionality of the SUCEST web site. Some services and programs have already been disabled (e.g.the sequence submission and plate control programs) but others, such as the keyword search, BLAST and report submission programs are still being used by data mining laboratories and will be used by the international commu-nity when the web site goes public. This will certainly transform the meeting point of the project’s community into the meeting point of a wider group which will produce new demands for services and data storage.
ACKNOWLEDGMENTS
This work was supported by FAPESP, CNPq and COPERSUCAR.
RESUMO
O projeto SUCEST (Sugarcane EST Project) pro-duziu 291.904 ESTs de cana-de-açúcar. Nesse projeto, o Laboratório de Bioinformática criou oweb siteque foi o “ponto de encontro” dos 74 laboratórios de sequencia-mento edata miningque fizeram parte do consórcio para o projeto. O Laboratório de Bioinformática (LBI) recebeu, processou, analisou e disponibilizou ferramentas para a exploração dos dados. Neste artigo os dados, serviços e programas implementados pelo LBI para o projeto são descritos, incluindo o procedimento declusteringque ge-rou 43.141clusters.
REFERENCES
Adams, M.D., Kelley, J.M., Gocayne, J.D., Dubnick, M., Poly-meropoulos, M.H., Xiao, H., Merril, C.R., Wu, A., Olde, B., Moreno, R., Kerlavage, A.R., McCombie, W.R., and Venter, J.C. (1991). Complementary DNA sequencing:
“expressed sequence tags” and the human genome project. Science 252: 1651-1656.
Altschul, S.F., Madden, T.L., Schäffer, A.A., Zhang, J., Zhang, Z., Miller, W. and Lipman, D.J.(1997). Gapped BLAST and PSI-BLAST: a new generation of protein data-base search programs.Nucleic Acids Res.25: 3389-3402. Boguski, M. and Schuler, G. (1995). ESTablishing a human
transcript map.Nature Genetics.10: 369-371.
Huang, X. and Madan, A.(1999). CAP3: A DNA sequence as-sembly program.Genome Res.9: 868-877.
Quackenbush, J., Liang, F., Holt, I., Pertea, G., and Upton, J. (2000). The TIGR Gene Indices: reconstruction and repre-sentation of expressed gene sequences.Nucleic Acids Res. 28(1): 141-145.
Schuler, G.(1997). Pieces of the puzzle: Expressed sequence tags and the catalog of human genes. J Mol Med. 75 (10): 694-698.
Simpson, A.J.G., Reinach, F.C., Arruda, P., Abreu, F.A., Acencio, M., Alvarenga, R., Alves, L.M.C., Araya, J.E., Baia, G.S., Baptista, C.S., Barros, M.H., Bonaccorsi, E.D., Bordin, S., Bove, J.M., Briones, M.R.S., Bueno, M.R.P., Camargo, A.A., Camargo, L.E.A., Carraro, D.M., Carrer, H., Colauto, N.B., Colombo, C., Costa, F.F., Costa, M.C.R., Costa-Neto, C.M., Coutinho, L.L., Cristofani, M., Dias-Neto, E., Docena, C., El-Dorry, H., Facincani, A.P., Ferreira, A.J.S., Ferreira, V.C.A., Ferro, J.A., Fraga, J.S., Franca, S.C., Franco, M.C., Frohme, M., Furlan, L.R., Garnier, M., Goldman, G.H., Goldman, M.H.S., Gomes, S.L., Gruber, A., Ho, P.L., Hoheisel, J.D., Junqueira, M.L., Kemper, E.L., Kitajima, J.P., Krieger, J.E., Kuramae, E.E., Laigret, F., Lambais, M.R., Leite, L.C.C., Lemos, E.G.M., Lemos, M.V.F., Lopes, S.A., Lopes, C.R., Machado, J.A., Machado, M.A., Madeira, A.M.B.N., Madeira, H.M.F., Marino, C.L., Marques, M.V., Martins, E.A.L., Martins, E.M.F., Matsukuma, A.Y., Menck, C.F.M., Miracca, E.C., Miyaki, C.Y., Monteiro-Vitorello, C.B., Moon, D.H., Nagai, M.A., Nascimento, A.L.T.O., Netto, L.E.S., Nhani Jr., A., Nobrega, F.G., Nunes, L.R., Oliveira, M.A., de Oliveira, M.C., de Oliveira, R.C., Palmieri, D.A., Paris, A., Peixoto, B.R., Pereira, G.A.G., Pereira Jr., H.A., Pesquero, J.B., Quaggio, R.B., Roberto, P.G., Rodrigues, V., de M. Rosa, A.J., de Rosa Jr., V.E., de Sa, R.G., Santelli, R.V., Sawasaki, H.E., da Silva, A.C.R., da Silva, F.R., da Silva, A.M., Silva Jr., W.A., da Silveira, J.F., Silvestri, M.L.Z., Siqueira, W.J., de Souza, A.A., de Souza, A.P., Terenzi, M.F., Truffi, D., Tsai, S.M., Tsuhako, M.H., Vallada, H., Van Sluys, M.A., Verjovski-Almeida, S., Vettore, A.L., Zago, M.A., Zatz, M., Meidanis, J. and Setubal, J.C.(2000). The genome se-quence of the plant pathogenXylella fastidiosa.Nature 406: 151-157.
Telles, G.P. and da Silva, F.R.(2001). Trimming and clustering sugarcane ESTs.Genetics and Molecular Biology 24(1-4): 17-23.