Seasonal and diel variation in the fish assemblage of a
Neotropical delta in southern Brazil
Adriana Saccol-Pereira
1& Clarice B. Fialho
21. Laboratório de Ecologia de Águas Continentais, Departamento de Ecologia e Zoologia, Centro de Ciências Biológicas, Universidade Federal de Santa Catarina, Campus Universitário, Trindade, 88010-970 Florianópolis, SC, Brazil. (a.saccolpereira@yahoo.com.br) 2. Laboratório de Ictiologia, Departamento de Zoologia, Universidade Federal do Rio Grande do Sul, Av. Bento Gonçalves, 9500,
91501-970 Porto Alegre, RS, Brazil.
ABSTRACT. The objective of this study was to identify the patterns of seasonal and diel variation and the most important abiotic factors that influence variation in the fish assemblage of the Delta of the Jacuí River in southern Brazil. Seventy-two samples were collected over a one year period. Water temperature was the abiotic factor with the greatest influence on the distribution of the assemblage. The structure of the assemblage exhibited significant changes in terms of species abundance and biomass during the year, with the greatest abundance and biomass being observed during the autumn. There was no significant difference between day and night in terms of abundance, but biomass was significantly greater during the night than during the day.
KEYWORDS. Fish ecology, freshwater fish, biological rhythm, circadian rhythm, Patos Lagoon.
RESUMO.Variação sazonal e circadiana na assembleia de peixes em delta Neotropical no sul do Brasil. O objetivo deste estudo foi identificar o padrão de variação sazonal e circadiana e os principais fatores abióticos que influenciam a estrutura da assembleia de peixes do delta do rio Jacuí, região sul do Brasil. Foram realizadas 72 amostragens durante o período de um ano. A distribuição da assembleia foi influenciada principalmente pela temperatura da água. A estrutura da assembleia apresentou diferenças significativas na abundância e biomassa das espécies entre as estações do ano e as maiores abundância e biomassa foram apresentadas no outono. Quando os resultados do dia e da noite foram comparados, a abundância não apresentou diferença significativa, entretanto a biomassa da noite foi significativamente maior que a do dia.
PALAVRAS-CHAVE. Ecologia de peixes, peixes de água doce, ritmo biológico, ritmo circadiano, laguna dos Patos.
The temporal and spatial variations of fish
assemblages are influenced by both biotic and abiotic
factors. Even in adjacent biotopes, these assemblages
exhibit a high degree of variation which is dependent
upon the relationships between each species intrinsic
characteristics and environmental variables such as
resource accessibility and availability (J
ACKSONet al.
,
2001; O
KADAet al.
, 2003).
Several authors have emphasized the importance
of studying the structure of fish assemblages as a tool
for understanding the environment and for establishing
relationships between their structures and environmental
factors (R
ICKLEFS, 1987; J
UNKet al
., 1989; T
EJERINA-G
ARROet al
., 1998; L
OREAUet al
., 2001; G
RANADO-L
ORENCIOet
al
., 2005; P
IANAet al
., 2006). These studies have
investigated ecological mechanisms that act on
assemblages (
e.g.
competition, reproduction, parasitism
and predation) and evaluated interactions with
environmental variables (
e.g.
dissolved oxygen,
temperature and seasonality). It is therefore evident that
the question of which environmental and ecological
factors have a significant influence on the structure of
the assemblage in a given location is considered important
within the field of ecology (W
ELCOMME, 1979; S
CHLOSSER,
1982; T
OWNSEND& H
ILDREW, 1994; B
ROWN, 2000; S
CHEINER& W
ILLIG, 2008).
The structure of a local assemblage may undergo
seasonal and diel variations. In a considerable part of the
Neotropical region, seasonal variation has been described
in studies investigating the differences between flood
and dry periods. These studies have demonstrated that
there is greater availability of food and increased species
abundance during flood periods, leading them to consider
this seasonal phenomenon to be the main modulating
the structure of the biota (A
GOSTINHOet al
., 1995;
M
ATTHEWS, 1998; L
AKE, 2003; F
REITAS& G
ARCEZ, 2004;
M
AGALHÃESet al
., 2007; S
OUSA& F
REITAS, 2008).
However, no studies could be located that have
focused on the structure of the fish assemblage in
Neotropical environments exhibiting both periods of high
and low rainfall and strong temperature variations.
Temperature is a limiting factor and higher or lower
temperatures can favour the presence or absence of
certain species, affecting the distribution and
composition of the community (M
AGNUSONet al
., 1979;
J
AUREGUIZARet al
., 2003; W
OLTER, 2007; C
USSACet al
.,
2009).
Furthermore, species-specific diel variations can
mean that the abundance of individuals and species in a
given habitat changes over the course of 24-hours, as
determined by feeding activities (R
OOKER& D
ENNIS, 1991;
P
IET& G
URUGE, 1997), predation and the need to escape
from predators (W
RIGHT, 1989; C
OPP& J
URAJDA, 1993;
B
URROWSet al
., 1994; G
IBSONet al
., 1998; G
ROSSMANet al.
,
1998). According to L
OWE-M
CC
ONNELL(1999) the
presence of predators and large species at night, while
small species protect themselves in the vegetation, is a
common observation in Neotropical rivers.
Neotropical region of southern Brazil with the objective
to investigate whether seasonal and diel variation is
related to abiotic factors (pH; Secchi transparency;
dissolved oxygen; air and water temperature; rainfall and
water column depth).
MATERIAL AND METHODS
Study area. The Jacuí River Delta is located in
southern Brazil and receives water from the Jacuí,
Gravataí, Caí and Sinos rivers, forming a flooded
freshwater area of approximately 22 thousand hectares
comprising several islands and a network of channels
and wetlands that provide the inflow to the Guaíba Lake,
which itself flows out to the Patos Lagoon and on to the
Atlantic Ocean (Fig. 1). The Delta is located in a region
with a subtropical humid climate and has water
temperature that varies from 11°C to 24°C over the course
of the year, and a mean air temperature of 19.5°C, which
can vary by up to 9°C during daylight hours (M
ALUF,
2000; F
ARIA& L
ERSCH, 2001). Annual rainfall is less than
1500 mm and the lowest rainfall is observed between
December and February (M
ALUF, 2000).
Field sampling. Sampling was carried out monthly
from October 2004 to September 2005, at three locations
that were considered replicates of each other: Saco da
Alemoa (SA) (29º59’56.5’’S, 51º14’53.4’’W), Saco do
Quilombo (SQ) (29º58’31’’S, 51º15’53.2’’W), and Saco do
Ferraz (SF) (30º00’34.8’’S, 51º14’41.3’’W) (Fig. 1). All of
these sampling stations are bays with a depth of more
than 1.2 m, bushy vegetation, grass, and macrophytes
(
Eichhornia
spp.) growing along the banks (O
LIVEIRA&
P
ORTO, 1999).
The following physical and chemical measurements
were taken monthly at each sampling area: pH, Secchi
transparency, dissolved oxygen and air and water
temperature. Additionally, monthly data on rainfall and
water column depth were obtained from the eighth district
of the Instituto Nacional de Meteorologia and from the
Superintendência de Portos e Hidrovias, respectively. We
used several gillnets for each sampling area, with mesh
sizes of 1.5, 2.5, 3.5, 4.5 and 6.0 cm between adjacent
knots and with dimensions of 20 x 1.5 m, making a total
area of 150 m
2. The nets were arranged in sequence,
perpendicular to the shore for a period of 24 hours. Nets
were set at 6pm and were checked at 6am on the following
day. All individuals collected during this period were
considered nocturnal, while individuals collected between
6am and 6pm were considered diurnal. Environmental
data was used to define the seasons as follows, spring:
September, October and November; summer: December,
January and February, autumn: March, April and May
and winter: June, July and August.
The individuals collected were classified
according to taxonomic keys and were measured (mm),
and weighed (g). Voucher species were deposited in
the ichthyologic collection of the Laboratório de
Ictiologia, Departamento de Zoologia, Instituto de
Biociências, Universidade Federal do Rio Grande do
Sul, Brazil, under the following accession numbers:
UFRGS 0088, 0188, 4190, 5059, 5172, 5838, 6366, 6707,
6727, 6989, 7114, 7576-7585, 7588-7590, 7592-7594, 7595,
7656, 8190, 8259, 8643, 8916, 8917.
Data analysis. In order to describe the main species
distribution tendencies and to relate them to
environmental factors, monthly means were calculated
from the absolute numbers of individuals captured at the
three sampling areas and, independent of diel variation,
correlated with the abiotic data using canonical
correspondence analysis (CCA), performed with
CANOCO version 4.5 software (
TERB
RAAK, 1995).
The data were natural log-transformed (Ay + B)
and the “downweighting of rare species” option was
selected in order to ensure that where few individuals of
a given species had been collected, this would not affect
the final result. The significance of environmental factors
was estimated using the “vif” function (variance inflation
factor), which detects co-linearity between variables,
where variables whose vif > 20 were defined as redundant
and removed from the analysis (M
YERS, 1990; H
AIRet al.
,
1998). Statistical significance was estimated using the
Monte Carlo permutation test (10
4unrestricted
permutations) with the significance level set at
P
≤
0.05.
The null hypothesis was that species abundance did not
correlate with environmental variables.
Principal coordinates analysis (PCA,
TERB
RAAK,
1995) was performed using a matrix of abundance data
for each species, for each season, and for the day and
night periods, in order to represent the pattern of
associations between species composition and seasons
and day/night. Data were natural log-transformed (Ay +
B) and the downweighting rare species option was once
more selected in order to avoid the influence of rare
species leading to biased results. Detrended
correspondence analyses (DCA,
TERB
RAAK, 1995) was
performed in order to verify the length of the gradient (<
3 SD) and, on the basis of the DCA results, a linear PCA
model was selected, in line with standard practice (
TERB
RAAK, 1995). Ordination analyses were carried out using
the computer program CANOCO version 4.5.
Hypotheses were tested using analysis of variance
with randomization (M
ANLY, 1991) in order to verify
whether there were significant diel differences between
species abundance at seasonal stations. A multivariate
analysis based on randomization and bootstrap
non-parametric re-sampling methods was performed (M
ANLY,
1991; C
ROWLEY, 1992; P
ODANI, 1994; P
ILLAR, 1998; 1999).
Data were transformed [log (x+1)], and the Euclidian
distance was used as measure of similarity. The
randomization test was performed through 1000
interactions and the main criterion adopted was the sum
of the square of the distances between groups. The
significance level used for all analyses was
P
≤
0.05 and
the null hypothesis tested was that the composition of
these species does not change in relation to seasonal
variations and is independent of day or night. The
MULTIV computer program, version 2.4.2 (P
ILLAR, 2006),
was used to transform the data and perform the similarity
measurements and randomization tests.
The constancy (
c
) for each species was calculated
using the number of months and the period (day/night)
during which the species was collected. Each species
were classified as frequent (
c
> 50%), accessory (25%
≤
c
≤
50%), or accidental (
c
< 25%) (D
AJOZ, 1983).
Indices of richness (M
ARGALEF, 1951), diversity
H’
(ln), and evenness
J’
(P
IELOU, 1966, 1975) were calculated
using the Divers computer program (P
EREZ-L
OPEZ& S
OLA-F
ERNANDEZ, 1993). MULTIV version 2.4.2 (P
ILLAR, 2006)
was used to compare results with analysis of variance
(one-way ANOVA), by season and sampling period (day/
night).
RESULTS
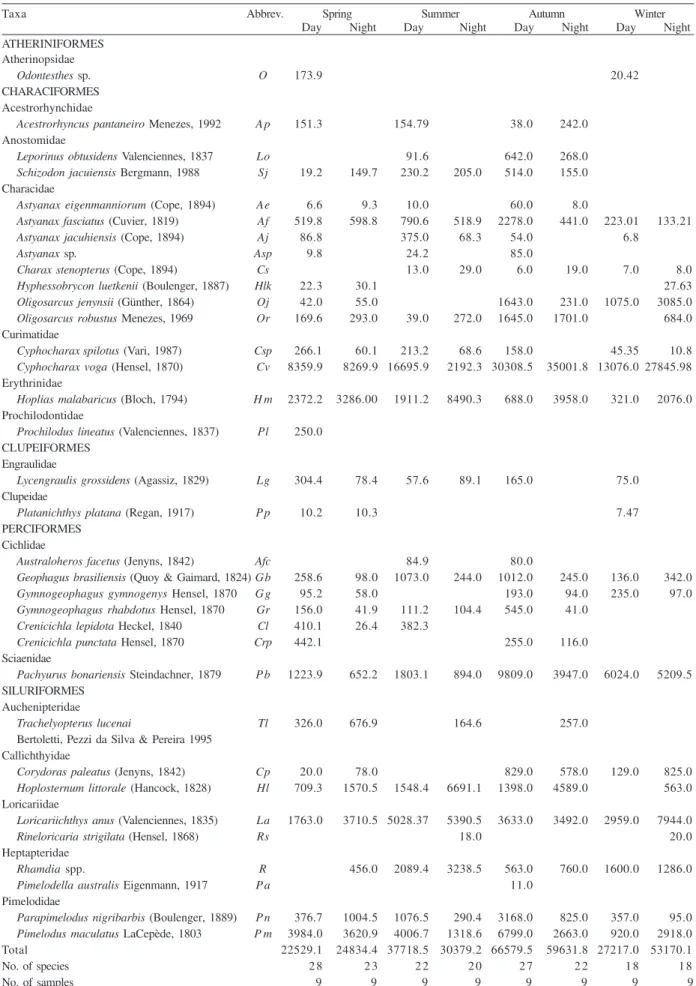
A total of 3862 individuals were collected,
distributed across 34 species (Tab. I).
Cyphocharax voga
(Hensel, 1870),
Astyanax fasciatus
(Cuvier, 1819),
Parapimelodus nigribarbis
(Boulenger, 1889),
Pachyurus bonariensis
Steindachner, 1879,
Corydoras
paleatus
(Jenyns, 1842),
Loricariichthys anus
(Valenciennes, 1835),
Pimelodus maculatus
Lacepède,
1803 and
Hoplosternum littorale
(Hancock, 1828)
accounted for 80% of the total catch in terms of number
of individuals, while
C. voga
,
L. anus
,
P. bonariensis
,
P. maculatus
,
Hoplias malabaricus
(Bloch, 1794) and
H. littorale
accounted for 80% of the total biomass
(Tab. II).
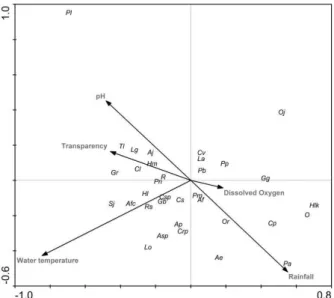
With relation to the significance of the
environmental factors, the variables “air temperature” and
“depth of the water column” were considered redundant
(vif > 20) and were removed from the analysis. The
environmental variable measurements are given in table
III and the results of the canonical correspondence
analysis (Tab. IV; Fig. 2) based on these measurements
demonstrated that water temperature was the
environmental variable with the greatest influence on the
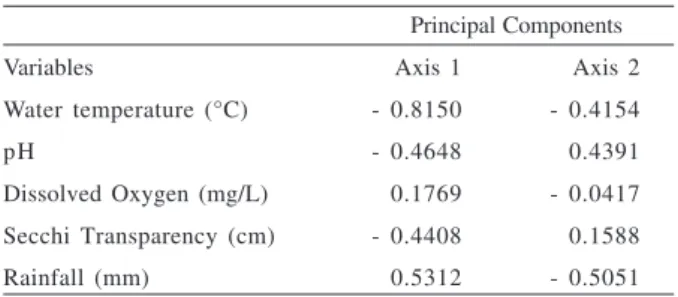
distribution of species. The results of this analysis were
significant and the environmental factors measured
explained 59.2% of the variation in abundance. The first
and second ordination axes were predominantly
correlated with the variables “water temperature” and
“rainfall” (Tab. V).
Figure 2. Pattern in fish assemblages distribution among environmental variables based on canonical correspondence analysis (CCA) in the Jacuí River Delta, RS, Brazil, from October 2004 to September 2005 (Ap, Acestrorhyncus pantaneiro; Ae, Astyanax eigenmanniorum; Af, Astyanax fasciatus; Aj, Astyanax jacuhiensis;
Asp, Astyanax sp.; Afc, Australoheros facetus; Cs, Charax stenopterus;
Cp, Corydoras paleatus; Cl, Crenicichla lepidota; Crp, Crenicichla punctata; Cv, Cyphocharax voga; Csp, Cyphocharax spilotus; Gb,
Geophagus brasiliensis; Gg, Gymnogeophagusgymnogenys; Gr,
Gymnogeophagus rhabdotus; Hm, Hoplias malabaricus; Hl, Hoplosternum littorale; Hlk, Hyphessobrycon luetkenii; Lo,
Leporinus obtusidens; La, Loricariichthys anus; Lg, Lycengraulis grossidens; O, Odontesthes sp.; Oj, Oligosarcusjenynsii; Or,
Table I. Individuals (n) collected in the Jacuí River Delta, southern Brazil, from October 2004 to September 2005 in every season and day period and their respective ecological indices.
Taxa Abbrev. Spring Summer Autumn Winter Constancy (%) Day Night Day Night Day Night Day Night Day Night ATHERINIFORMES
Atherinopsidae
Odontesthes sp. O 3 1 16.7
CHARACIFORMES Acestrorhynchidae
Acestrorhynchus pantaneiro Menezes, 1992 A p 2 2 2 2 5 0 16.7 Anostomidae
Leporinus obtusidens Valenciennes, 1837 Lo 1 4 1 16.7 16.7 Schizodon jacuiensis Bergmann, 1988 Sj 1 2 3 2 4 1 33.3 2 5 Characidae
Astyanax eigenmanniorum (Cope, 1894) Ae 1 1 1 5 1 41.7 8.3 Astyanax fasciatus (Cuvier, 1819) Af 4 3 5 6 6 6 4 1 198 3 6 2 0 1 2 100 100 Astyanax jacuhiensis (Cope, 1894) Aj 7 1 0 7 2 1 5 0 2 5
Astyanax sp. Asp 1 2 7 33.3
Charax stenopterus (Cope, 1894) Cs 2 4 1 3 1 1 2 5 2 5 Hyphessobrycon luetkenii (Boulenger, 1887) Hlk 3 5 4 8.3 16.7
Oligosarcus jenynsii (Günther, 1864) Oj 1 1 2 1 3 1 5 4 3 33.3 5 0
Oligosarcus robustus Menezes, 1969 Or 3 3 2 3 1 2 2 1 6 33.3 5 0
Curimatidae
Cyphocharax spilotus (Vari, 1987) Csp 2 2 4 1 6 4 8 3 1 91.6 5 0
Cyphocharax voga (Hensel, 1870) Cv 103 7 9 139 2 0 244 264 110 203 100 91.6
Erythrinidae
Hoplias malabaricus (Bloch, 1794) H m 1 2 1 1 1 0 2 6 3 1 3 1 6 66.7 91.6 Prochilodontidae
Prochilodus lineatus (Valenciennes, 1837) Pl 1 8.3
CLUPEIFORMES Engraulidae
Lycengraulis grossidens (Agassiz, 1829) Lg 6 2 2 4 3 2 66.7 33.3
Clupeidae
Platanichthys platana (Regan, 1917) P p 2 1 1 16.7 16.7 PERCIFORMES
Cichlidae
Australoheros facetus (Jenyns, 1842) Afc 1 1 16.7
Geophagus brasiliensis (Quoy & Gaimard, 1824) Gb 4 1 1 6 2 1 9 4 2 4 66.7 58.3 Gymnogeophagus gymnogenys Hensel, 1870 Gg 4 3 8 3 7 3 58.3 33.3 Gymnogeophagus rhabdotus Hensel, 1870 Gr 3 1 4 4 8 1 41.7 2 5
Crenicichla lepidota Heckel, 1840 Cl 4 1 1 2 41.7 8.3
Crenicichla punctata Hensel, 1870 Crp 5 3 2 33.3 16.7
Sciaenidae
Pachyurus bonariensis Steindachner, 1879 P b 1 5 9 2 5 1 1 117 4 2 5 1 4 5 91.6 100 SILURIFORMES
Auchenipteridae
Trachelyopterus lucenai Tl 3 1 0 2 3 8.3 41.7
Bertoletti, Pezzi da Silva & Pereira, 1995 Callichthyidae
Corydoras paleatus (Jenyns, 1842) Cp 2 9 9 5 6 6 1 5 109 41.7 5 0
Hoplosternum littorale (Hancock, 1828) Hl 1 0 1 2 1 1 5 8 1 4 3 9 4 66.7 91.6 Loricariidae
Loricariichthys anus (Valenciennes, 1835) La 1 4 2 8 4 7 4 4 2 9 2 4 2 3 5 7 100 91.6
Rineloricaria strigilata (Hensel, 1868) Rs 2 1 8.3 Heptapteridae
Rhamdia spp. R 1 7 1 3 2 2 3 4 33.3 66.7
Pimelodella australis Eigenmann, 1917 P a 1 8.3 Pimelodidae
Parapimelodus nigribarbis (Boulenger, 1889) P n 2 2 5 7 6 6 1 4 150 4 1 1 8 7 91.6 83.3 Pimelodus maculatus LaCepède, 1803 P m 3 1 3 6 4 4 1 3 5 8 2 8 1 0 2 5 91.6 91.6
Total 328 333 488 275 1019 600 284 535
No. of species 2 8 2 3 2 2 2 0 2 7 2 2 1 8 1 8
Diversity 2.45 2.27 2.29 2.4 2.25 2.01 1.92 1.92
Richness 4.66 3.78 3.39 3.38 3.75 3.28 3 2.7
Eveness 0.73 0.72 0.74 0.8 0.68 0.65 0.68 0.66
Table II. Biomass (g) of individuals collected in the Jacuí River Delta, southern Brazil, from October 2004 to September 2005 in each season (day and night).
Taxa Abbrev. Spring Summer Autumn Winter
Day Night Day Night Day Night Day Night
ATHERINIFORMES Atherinopsidae
Odontesthes sp. O 173.9 20.42
CHARACIFORMES Acestrorhynchidae
Acestrorhyncus pantaneiro Menezes, 1992 A p 151.3 154.79 38.0 242.0 Anostomidae
Leporinus obtusidens Valenciennes, 1837 Lo 91.6 642.0 268.0
Schizodon jacuiensis Bergmann, 1988 Sj 19.2 149.7 230.2 205.0 514.0 155.0
Characidae
Astyanax eigenmanniorum (Cope, 1894) Ae 6.6 9.3 10.0 60.0 8.0
Astyanax fasciatus (Cuvier, 1819) Af 519.8 598.8 790.6 518.9 2278.0 441.0 223.01 133.21
Astyanax jacuhiensis (Cope, 1894) Aj 86.8 375.0 68.3 54.0 6.8
Astyanax sp. Asp 9.8 24.2 85.0
Charax stenopterus (Cope, 1894) Cs 13.0 29.0 6.0 19.0 7.0 8.0 Hyphessobrycon luetkenii (Boulenger, 1887) Hlk 22.3 30.1 27.63
Oligosarcus jenynsii (Günther, 1864) Oj 42.0 55.0 1643.0 231.0 1075.0 3085.0
Oligosarcus robustus Menezes, 1969 Or 169.6 293.0 39.0 272.0 1645.0 1701.0 684.0 Curimatidae
Cyphocharax spilotus (Vari, 1987) Csp 266.1 60.1 213.2 68.6 158.0 45.35 10.8 Cyphocharax voga (Hensel, 1870) Cv 8359.9 8269.9 16695.9 2192.3 30308.5 35001.8 13076.0 27845.98 Erythrinidae
Hoplias malabaricus (Bloch, 1794) H m 2372.2 3286.00 1911.2 8490.3 688.0 3958.0 321.0 2076.0 Prochilodontidae
Prochilodus lineatus (Valenciennes, 1837) Pl 250.0
CLUPEIFORMES Engraulidae
Lycengraulis grossidens (Agassiz, 1829) Lg 304.4 78.4 57.6 89.1 165.0 75.0 Clupeidae
Platanichthys platana (Regan, 1917) P p 10.2 10.3 7.47
PERCIFORMES Cichlidae
Australoheros facetus (Jenyns, 1842) Afc 84.9 80.0
Geophagus brasiliensis (Quoy & Gaimard, 1824)Gb 258.6 98.0 1073.0 244.0 1012.0 245.0 136.0 342.0 Gymnogeophagus gymnogenys Hensel, 1870 Gg 95.2 58.0 193.0 94.0 235.0 97.0 Gymnogeophagus rhabdotus Hensel, 1870 Gr 156.0 41.9 111.2 104.4 545.0 41.0
Crenicichla lepidota Heckel, 1840 Cl 410.1 26.4 382.3
Crenicichla punctata Hensel, 1870 Crp 442.1 255.0 116.0 Sciaenidae
Pachyurus bonariensis Steindachner, 1879 P b 1223.9 652.2 1803.1 894.0 9809.0 3947.0 6024.0 5209.5
SILURIFORMES Auchenipteridae
Trachelyopterus lucenai Tl 326.0 676.9 164.6 257.0 Bertoletti, Pezzi da Silva & Pereira 1995
Callichthyidae
Corydoras paleatus (Jenyns, 1842) Cp 20.0 78.0 829.0 578.0 129.0 825.0
Hoplosternum littorale (Hancock, 1828) Hl 709.3 1570.5 1548.4 6691.1 1398.0 4589.0 563.0 Loricariidae
Loricariichthys anus (Valenciennes, 1835) La 1763.0 3710.5 5028.37 5390.5 3633.0 3492.0 2959.0 7944.0 Rineloricaria strigilata (Hensel, 1868) Rs 18.0 20.0
Heptapteridae
Rhamdia spp. R 456.0 2089.4 3238.5 563.0 760.0 1600.0 1286.0
Pimelodella australis Eigenmann, 1917 P a 11.0 Pimelodidae
Parapimelodus nigribarbis (Boulenger, 1889) P n 376.7 1004.5 1076.5 290.4 3168.0 825.0 357.0 95.0 Pimelodus maculatus LaCepède, 1803 P m 3984.0 3620.9 4006.7 1318.6 6799.0 2663.0 920.0 2918.0
Total 22529.1 24834.4 37718.5 30379.2 66579.5 59631.8 27217.0 53170.1
No. of species 2 8 2 3 2 2 2 0 2 7 2 2 1 8 1 8
In contrast with the majority of species observed,
the overall tendency of the species
Oligosarcus jenynsii
(Günther, 1864),
C
.
paleatus
and
L
.
anus
was to exhibit
increased abundance during the winter, particularly
during the night. Conversely,
Acestrorhynchus
pantaneiro
Menezes, 1992,
Schizodon
jacuiensis
Bergmann, 1988,
Astyanax
eigenmanniorum
(Cope,
1894),
Gymnogeophagus
rhabdotus
Hensel, 1870 and
Trachelyopterus
lucenai
Bertoletti, Pezzi da Silva &
Pereira, 1995 were all caught during the other three
seasons, but not during winter, leading to lower species
richness in the winter.
The number of individuals observed increased
during the autumn; in particular, there were greater
numbers of
A
.
fasciatus
,
P
.
bonariensis
and
P
.
nigribarbis
during the daytime, while high frequencies of predator
species such as
Oligosarcus robustus
Menezes, 1969,
H
.
malabaricus
,
T
.
lucenai
,
H
.
littorale
and
Rhamdia
spp.
were observed during the nocturnal period (Tab. I).
Abundance and biomass were significantly higher
during the winter (Tab. II) than during the summer and
the lowest abundance and biomass were observed during
the spring.
Analysis of variance with randomization
demonstrated that, independent of diel variation, autumn
was the season with the greatest abundance of species,
significantly different from winter (
P
= 0.03), spring (
P
=
0.04) and summer (
P
= 0.005). Winter abundance was
significantly greater than summer abundance (
P
= 0.01).
No significant differences were detected in species
abundance when the differences between numbers of
individuals observed during the day and during the night
were analyzed independent of season.
With relation to the differences in biomass between
seasons, independent of diel variation, autumn exhibited
the greatest biomass, with a statistically significant
difference in relation to winter (
P
= 0.007), summer (
P
=
0.006), and spring (
P
= 0.05). Winter biomass was
significantly greater than summer biomass (
P
= 0.003)
and biomass was significantly lower during spring than
during the summer (
P
= 0.01). When diurnal biomass was
compared with nocturnal biomass, independent of
season, the sum of the nocturnal individuals’ mass was
significantly greater (
P
= 0.01) than that of the diurnal
individuals (Fig. 3).
Figure 3. Seasonal abundance (n) and biomass (g) (mean ± SD) and period of collection (day/night) in the Jacuí River Delta, southern Brazil, from October 2004 to September 2005.
0 100 200 300 400 500 600
Spring Summer Autumn Winter
d n
0 5000 10000 15000 20000 25000 30000 35000 40000
Spring Summer Autumn Winter
Abundance
d n
Biomass
(g)
Table III. Mean (±SD) of environmental variables in the sample areas (SA; SQ; SF) in the Jacuí River Delta, southern Brazil, from October/2004 to September/2005.
Oct Nov Dec Jan Feb Mar Apr May Jun Jul Aug Sep
Water 21.0±0.1 24.1±0.3 19.3±0.6 24.7±2.3 21.7±0.6 23.3±2.3 21.0±0.1 18.5±0.5 17.4±0.4 13.3±0.4 14.0±0.1 18.0±1.0 temperature
pH 7.16±0.1 7.2±0.1 6.6±0.4 6.7±0.5 6.7±0.6 6.9±0.7 6.7±0.1 6.5±0.2 6.9±0.1 6.9±0.1 6.8±0.1 6.4±0.1 Secchi 53.6±4.9 33.6±16.8 25.0±4.5 20.3±7.6 7.7±2.5 24.7±6.6 38±3.6 15.3±1.5 14±2.6 20±0.1 20±0.1 0.3±9.4 transparency (cm)
Dissolved oxygen 3.7±0.4 6.4±2.0 9.0±1.7 8.0±0.1 8.6±0.1 9.0±1.7 8.0±0.1 7.3±1.1 9.3±2.8 7.1±1.6 11.0±0.1 5.0±1.7 (mg/L)
Rainfall 76.2 117.6 33.7 28.8 41.0 141.3 145.8 153.7 15.2 57.7 155.9 164.3
(mm)
Rainfall (mm) 114.3 104.2 101.2 100.1 108.6 104.4 86.1 94.6 132.7 121.7 140.0 139.5 1961-1992
Table IV. Summary of the results of canonical correspondence analysis (CCA) based on five environmental variables measures in the Jacuí River Delta, southern Brazil, from October 2004 to September 2005 (* Global test).
Axis 1 Axis 2
Eigenvalues (λ) 0.164 0.062
Pearson’s correlations (species-environment) 0.964 0.972
Cumulative percentage variance of species data (%) 28.511 39.211
Cumulative percentage variance of species-environment relation (%) 48.111 66.211
Monte Carlo test
F 2.387 1.741*
Figure 5. Ordination of the species (biomass) in relation to season (day/night) resulting from principal components analysis (PCA) applied to total biomass (g) data matrix in the Jacuí River Delta, RS, Brazil, from October 2004 to September 2005 (1, spring day; 2, spring night; 3, summer day; 4, summer night; 5, autumn day; 6, autumn night; 7, winter day; 8; winter night; Ap, Acestrorhyncus pantaneiro; Ae, Astyanax eigenmanniorum; Af, Astyanax fasciatus; Aj, Astyanax jacuhiensis; Asp, Astyanax sp.; Afc,
Australoheros facetus; Cs, Charax stenopterus; Cp, Corydoras paleatus; Cl, Crenicichla lepidota; Crp, Crenicichlapunctata; Cv,
Cyphocharax voga; Csp, Cyphocharax spilotus; Gb, Geophagus brasiliensis; Gg, Gymnogeophagus gymnogenys; Gr,
Gymnogeophagus rhabdotus; Hm, Hoplias malabaricus; Hl, Hoplosternum littorale; Hlk, Hyphessobrycon luetkenii; Lo,
Leporinus obtusidens; La, Loricariichthys anus; Lg, Lycengraulis grossidens; O, Odontesthes sp.; Oj, Oligosarcusjenynsii; Or,
Oligosarcus robustus; Pb, Pachyurus bonariensis; Pn, Parapimelodus nigribarbis; Pa, Pimelodella australis; Pm,
Pimelodus maculatus; Pp, Platanichthysplatana; Pl, Prochilodus lineatus; R, Rhamdia spp.; Rs, Rineloricaria strigilata; Sj, Schizodon jacuiensis;Tl, Trachelyopterus lucenai).
Figure 4. Ordination of the species (number of individuals) in relation to season (day/night) resulting from principal components analysis (PCA) applied to abundance (n) data matrix in the Jacuí River Delta, RS, Brazil, from October 2004 to September 2005 (1, spring day; 2, spring night; 3, summer day; 4, summer night; 5, autumn day; 6, autumn night; 7, winter day; 8, winter night; Ap,
Acestrorhyncus pantaneiro; Ae, Astyanax eigenmanniorum; Af, Astyanax fasciatus; Aj, Astyanax jacuhiensis; Asp, Astyanax sp.; Afc, Australoheros facetus; Cs, Charax stenopterus; Cp, Corydoras paleatus; Cl, Crenicichla lepidota; Crp, Crenicichlapunctata; Cv,
Cyphocharax voga; Csp, Cyphocharax spilotus; Gb, Geophagus brasiliensis; Gg, Gymnogeophagus gymnogenys; Gr,
Gymnogeophagus rhabdotus; Hm, Hoplias malabaricus; Hl, Hoplosternum littorale; Hlk, Hyphessobrycon luetkenii; Lo,
Leporinus obtusidens; La, Loricariichthys anus; Lg, Lycengraulis grossidens; O, Odontesthes sp.; Oj, Oligosarcusjenynsii; Or,
Oligosarcus robustus; Pb, Pachyurus bonariensis; Pn, Parapimelodus nigribarbis; Pa, Pimelodella australis; Pm,
Pimelodus maculatus; Pp, Platanichthysplatana; Pl, Prochilodus lineatus; R, Rhamdia spp.; Rs, Rineloricaria strigilata; Sj, Schizodon jacuiensis;Tl, Trachelyopterus lucenai).
Table VI. Ecological indexes between seasons in the Jacuí River Delta, southern Brazil, from October 2004 to September 2005.
Contrasts Diversity Evenness Richness
p p p
spring x summer 1.11 0.32 0.34
spring x autumn 0.41 0.30 0.34
spring x winter 0.32 0.32 0.33
summer x autumn 0.31 0.34 1.11
summer x winter 0.31 0.34 0.33
autumn x winter 0.34 1.11 0.32
The first two axes of the ordination analysis (PCA)
explained 65.9% of seasonal species variability. Axis 1
(42.3%) demonstrated that, with the exception of diurnal
winter data and nocturnal autumn data there was
separation between the species collected during the day
and during the night, with greater richness during the
daytime (Fig. 4).
When species were arranged in order of biomass,
the two first axes explained 52.7% of the observed
variation, with 30.1% explained by axis 1. Although
species richness was greater during the diurnal period
when compared with the nocturnal period, the largest
species, with the greatest biomass, were observed during
the night, meaning that total biomass was greater at night
(Fig. 5).
Table I lists the results of classifying the species
by constancy of occurrence (
c
) and also gives the results
for richness, diversity
H’
(ln) and evenness
J’
. Analysis
of variance of the indices of richness, diversity
H’
and
evenness
J’
did not detect significant seasonal variation
(Tab. VI) or significant diel variation (diversity
P
= 0.74,
evenness
P
= 1, richness
P
= 0.38).
Table V. Matrix of correlation among environmental variables measures and abundance of individuals collected in the Jacuí River Delta, southern Brazil, from October 2004 to September 2005.
Principal Components
Variables Axis 1 Axis 2
Water temperature (°C) - 0.8150 - 0.4154
pH - 0.4648 - 0.4391
Dissolved Oxygen (mg/L) - 0.1769 - 0.0417 Secchi Transparency (cm) - 0.4408 - 0.1588
DISCUSSION
According to L
OWE-M
CC
ONNELL(1999), it is very
common for Ostariophysi to dominate in Neotropical
rivers, in particular Characiformes and Siluriformes, and
this is what was observed in the Jacuí River Delta.
Cyphocharax voga
exhibited the greatest biomass and
abundance during all periods, followed by
P. nigribarbis
,
C. paleatus
,
L. anus
, and
P. maculatus
. Overall, the fish
that make up the assemblage in the Jacuí River Delta also
occur frequently in the Patos Lagoon system
(M
ALABARBA, 1989).
One factor that could contribute to the biomass
and abundance of the species mentioned above is the
fact that the Delta has a muddy bottom with large
quantities of debris resulting from the confluence of rivers
from different areas (F
ARIA& L
ERSCH, 2001). This feature
would encourage a local increase in the abundance and
biomass of detritivorous species such as
C. voga
,
P.
nigribarbis
,
C. paleatus
,
L. anus
, and
P. maculatus
(H
ARTZ& B
ARBIERI, 1993; Y
OSSA& A
RAÚJO-L
IMA, 1998; D
ELARIVA& A
GOSTINHO, 2001; F
UGIet al
., 2001; L
IMA-J
UNIOR&
G
OITEIN, 2004; G
RANADO-L
ORENCIOet al
., 2005; C
ARDONEet al
., 2006). According to G
RENOUILLETet al.
(2002),
species abundance is intimately related to the availability
of food sources.
However, in common with the description of Patos
Lagoon published by P
EREIRA(1994), seasonal factors
have a significant influence on the distribution of
individuals in the Delta. During periods of heavy rain
and higher water levels, an elevated abundance of
freshwater fish was observed in Patos Lagoon, which
led researchers to raise the hypothesis that some species
may be being carried towards the lagoon (G
ARCIA&
V
IEIRA, 2001; G
ARCIAet al
., 2003). Notwithstanding,
abundance of species and biomass in the Delta also
increased in line with rainfall. M
ACHADO-A
LLISON(1990)
made the observation that increases in the abundance of
species are to be expected during periods with increased
rainfall because of the greater availability of food sources.
In contrast with species in flooded areas, where
the structure of the assemblage is mainly influenced by
the flood pulse (W
INEMILLERet al
., 2000; S
ÚAREZet al
.,
2001), variations in the ichthyofauna in the Delta were
mainly influenced by water temperature. This pattern is
similar to that observed in other areas with subtropical
climates (J
AUREGUIZARet al
., 2003; A
DAMSet al
., 2004).
Previous studies carried out with three different
species of the genus
Astyanax
(B
ERTACOet al
., 1998) and
with
P. nigribarbis
(B
ERTACO& B
ECKER, 2000) in Guaíba
Lake have reported low abundance during periods with
low temperatures, and related this decrease to individuals
seeking protected areas in deeper waters. Individuals
engaging in such migration would avoid collection by
gillnets, which may also have occurred in the study
described here.
Alternatively, the largest number of individuals
caught in autumn, resulting in greater abundance and
biomass, could be a result of increasing movement and
feeding activity of individuals in the period before the
breeding season of most species. Furthermore, it has been
demonstrated that many fish feed with greater intensity
during the periods before and after their reproductive
season (B
ARBIERIet al
., 1982; S
CHLOSSER, 1982; H
ARTZet
al
., 1996; T
RIPE& G
UY, 1999).
The majority of species inhabiting the coastal
regions of southern Brazil begin their reproductive cycles
during the spring (F
IALHOet al
., 1996; N
UNESet al
., 2004;
M
ARQUESet al
., 2007; M
ILANI& F
ONTOURA, 2007) and the
fact that the greatest richness and lowest abundance and
biomass was observed during this period could be related
to a high number of juveniles in species assemblages.
These juveniles would not be collected by gillnets due
to their small size.
In addition to seasonal influences, several fish
exhibit diel variation in their habitat use, varying in
biomass, richness and abundance when day and night
are compared (L
OWE-M
CC
ONNELL, 1964; W
INEMILLER,
1989; G
AUDREAU& B
OSCLAIR, 1998; Y
U& P
ETERS, 2003;
W
OLTER& F
REYHOF, 2004; O
KUNet al
., 2005). Although
the number of individuals did not significantly differ
between day and night, biomass was significantly higher
during the night, which is probably linked to frequent
collection of large predator species such as
H
.
littorale
,
H
.
malabaricus
,
O
.
robustus
,
Rhamdia
spp. and
T
.
lucenai
at night. This result is in contrast with the
abundance data, where a large number of small
individuals were observed during the day.
Finally, in common with tropical regions, where fish
assemblages are influenced mainly by rainfall, in this
subtropical area rainfall also plays a role. However, this
study supports the view that temperature-related
seasonal and diel variation is the most important factor
impacting the distribution of the fish assemblage in the
Jacuí River Delta.
Acknowledgments. The authors are grateful to the Parque Estadual Delta do Jacuí staff for their assistance, especially to Clemente da Rosa for his help in the boat. We would also like to thank the staff at the Laboratório de Ictiologia (UFRGS), and in particular L. R. Malabarba, R. Hirano, J. Ferrer, A. P. Dufech, T. S. Dias, J. Giora, P. Milani, F. Schneck and R. Pereira for their valuable help in the field, with the statistical analysis and for reviewing this manuscript. This study was supported by the Conselho Nacional de Desenvolvimento Científico e Tecnológico (140879/2004-8).
REFERENCES
ADAMS, S.; WARREN JR, M. L. & HAAG, W. R. 2004. Spatial and temporal patterns in fish assemblages of upper coastal plain streams, Mississippi, USA. Hydrobiologia 528:45-61.
AGOSTINHO, A. A.; VAZZOLER, A. E. A. M. & THOMAZ, S. M. 1995. The High river Paraná basin: limnological and ichthyological aspects. In: TUNDISI, J. G.; BICUDO, C. E. M. & MATSUMURA -TUNDISI, T. eds. Limnology in Brazil. Rio de Janeiro, ABC/
SBL. p.59-103.
BARBIERI, G.; VERANI, J. R. & BARBIERI, M. C. 1982. Dinâmica quantitativa da nutrição de Hoplias malabaricus (Bloch, 1974), na represa do Lobo (Brotas-Itirapina/SP) (Pisces, Erythrinidae).
Revista Brasileira de Biologia 42(2):295-302.
BERTACO, V. A. & BECKER, F. G. 2000. Observações sobre a abundância de Parapimelodus nigribarbis (Boulenger, 1889) (Pimelodidae) no lago Guaíba, Rio Grande do Sul, Brasil.
Comunicações do Museu de Ciências e Tecnologia da PUCRS, Série Zoologia, 13(2):185-195.
BROWN, L. R. 2000. Fish communities and their associations with environmental variables, lower San Joaquin River Drainage, California. Environmental Biology of Fishes 57:251-269. BURROWS, M. T.; GIBSON, R. N.; ROBB, L. & COMELY, C. A. 1994. Temporal patterns of movement in juvenile flatfishes and their predators: underwater television observations. Journal of Experimental Marine Biology and Ecology 177 :251-268.
CARDONE, I. B.; LIMA-JUNIOR, S. E. & GOITEIN, R. 2006. Diet and capture of Hypostomus strigaticeps (Siluriformes, Loricariidae) in a small Brazilian stream: relationship with limnological aspects. Brazilian Journal of Biology 66(1A):25-33. COPP, G. H. & JURAJDA, P. 1993. Do small riverine fish move
inshore at night? Journal of Fish Biology 43(Suppl. A):229-241.
CROWLEY, P. H. 1992. Resampling methods for computation intensive data analysis in ecology and evolution. Annual Review of Ecological Systems 23:405-447.
CUSSAC, V. E.; FERNÁNDEZ, D. A.; GOMEZ, S. E. & LÓPEZ, H. L. 2009. Fishes of southern South America: a story driven by temperature. Fish Physiology and Biochemistry 35 :29-42.
DAJOZ, R. 1983. Ecologia Geral. Petrópolis, Vozes. 472p. DELARIVA, R. L. & AGOSTINHO, A. A. 2001. Relationship between
morphology and diets of six neotropical loricariids. Journal of Fish Biology 58:832-847.
FARIA, C. M. & LERSCH, E. C. 2001. Monitoramento das águas do Delta e foz dos rios formadores do Guaíba. Revista Ecos Pesquisa 2(5):7-42.
FIALHO, C. B.; VERANI, J. R.; PERET, A. C. & BRUSCHI JR., W. 1996. Dinâmica da reprodução de Odontesthes aff. perugiae
(Evermann & Kendall, 1906) da lagoa Emboaba, RS, Brasil (Pisces, Atherinidae). Boletim do Instituto de Pesca 23:105-115.
FREITAS, C. E. C. & GARCEZ, R. C. S. 2004. Fish communities of natural canals between floodplain lakes and Solimões-Amazonas River. Acta Limnologica Brasiliensia 16(3):273-280.
FUGI, R.; AGOSTINHO, A. A. & HAHN, N. S. 2001. Trophic morphology of five benthic-feeding fish species of a tropical floodplain. Revista Brasileira de Biologia 61(1):27-33. GARCIA, A. M. & VIEIRA, J. P. 2001. O aumento da diversidade de
peixes no estuário da lagoa dos Patos durante o episódio El Niño 1997-1998. Atlântica 23:85-96.
GARCIA, A. M.; RASEIRA, M. B.; VIEIRA, J. P.; WINEMILLER, K. O. & GRIMM, A. M. 2003. Spatiotemporal variation in shallow-water freshshallow-water fish distribution and abundance in a large subtropical coastal lagoon. Environmental Biology of Fishes 68:215-228.
GAUDREAU, N. & BOSCLAIR, D. 1998. The influence of spatial heterogeneity on the study of fish horizontal daily migration.
Fisheries Research 35:65-73.
GIBSON, R. N.; PIHL, L.; BURROWS, M. T.; MODIN, J.; WENNHAGE, H. & NICKELL, L. A. 1998. Diel movements of juvenile plaice
Pleuronectes platessa in relation to predators, competitors,
food availability and abiotic factors on a microtidal nursery ground. Marine Ecology Progress Series 165:145-159. GRANADO-LORENCIO, C.; ARAÚJO-LIMA, C. R. M. & LOBÓN-CERVIÁ, J.
2005. Abundance – distribution relationships in fish assembly of the Amazonas floodplain lakes. Ecography 28(4):515-520. GRENOUILLET, G.; PONT, D. & SEIP, K. 2002. Abundance and species richness as a function of food resources and vegetation structure: juvenile fish assemblages in rivers. Ecography 25:641-650.
GROSSMAN, G. D.; RATAJCZAK JR, R. E.; CRAWFORD, M. & FREEMAN, M. C. 1998. Assemblage organization in stream fishes: effects of environmental variation and interspecific interactions.
Ecological Monographs 68:395-420.
HAIR, J. F. J.; ANDERSON, R. E.; TATHAM, R. L. & BLACK, W. C. 1998. Multivariate data analyses. New Jersey, Prentice Hall. 552p.
HARTZ, S. M. & BARBIERI, G. 1993. Dinâmica quantitativa da alimentação de Cyphocarax voga (Hensel, 1869) da lagoa Emboaba, RS, Brasil (Characiformes, Curimatidae).
Comunicações do Museu de Ciências e Tecnologia da PUCRS, Série Zoologia, 6:63-74.
HARTZ, S. M.; MARTINS, A. & BARBIERI, G. 1996. Dinâmica da alimentação e dieta de Oligosarcus jenynsii (Gunther, 1864) na lagoa Caconde, Rio Grande do Sul, Brasil (Teleostei, Characidae). Boletim do Instituto de Pesca 23:21-29. JACKSON, D. A.; PERES-NETO, P. R. & OLDEN, J. D. 2001. What
controls who is where in freshwater fish communities – the roles of biotic, abiotic and spatial factors. Canadian Journal of Fisheries and Aquatic Sciences 58:157-170. JAUREGUIZAR, A. J.; MENNI, R.; GUERRERO, R. & LASTA, C. 2003.
Environmental factors structuring fish communities of the Rio de la Plata estuary. Fisheries Research 66 (2-3):195-211.
JUNK, W. J.; BAYLEY, P. B. & SPARKS, R. E. 1989. The flood pulse concept in river-floodplain systems. Canadian Journal of Fisheries and Aquatic Sciences 106:110-127.
LAKE, P. S. 2003. Ecological effects of perturbation by drought in flowing water. Freshwater Biology 48:1161-1172. LIMA-JUNIOR, S. E. & GOITEIN, R. 2004. Diet and feeding activity of
Pimelodus maculatus (Osteichthyes, Pimelodidae) in the
Piracicaba river (state of São Paulo, Brazil) - the effect of seasonality. Boletim do Instituto de Pesca 30(2):135-140. LOREAU, M.; NAEEM, S.; INCHAUSTI, P.; BENGTSSON, J.; GRIME, J. P.; HECTOR, A.; HOOPER, D. U.; HUSTON, M. A.; RAFFAELLI, D.; SCHMID, B.; TILMAN, D. & WARDLE, D. A. 2001. Biodiversity and ecosystem functioning: current knowledge and future challenges. Science 294:804-808.
LOWE-MCCONNELL, R. H. 1964. The fishes of the Rupununi savanna district of British Guiana, South America. Journal of the Linnean Society 45:103-144.
___. 1999. Estudos ecológicos de comunidades de peixes tropicais. São Paulo, EDUSP. 534p.
MACHADO-ALLISON, A. 1990. Ecologia dos peixes das áreas inundáveis dos Llanos da Venezuela. Interciencia 15:411-423. MAGALHÃES, M. F.; BEJA, P.; SCHLOSSER I. J. & COLLARES-PEREIRA, M.
J. 2007. Effects of multi-year droughts on fish assemblages of seasonally drying Mediterranean streams. Freshwater Biology 52(8):1494-1510.
MAGNUSON, J. J.; CROWDER, L. B. & MEDVICK, P. A. 1979. Temperature as an Ecological Resource. American Zoologist 19(1):331-343.
MALABARBA, L. R. 1989. Histórico sistemático e lista comentada das espécies de peixes de água doce do sistema da laguna dos Patos, Rio Grande do Sul, Brasil. Comunicações do Museu de Ciência e Tecnologia da PUCRS, Série Zoologia,
2(8):107-179.
MALUF, J. R. T. 2000. Nova classificação climática do estado do Rio Grande do Sul. Revista Brasileira de Agrometeorologia 8(1):141-150.
MANLY, B. F. J. 1991. Randomization and Monte Carlo Methods in biology. London, Chapman & Hall. 455p. MARGALEF, R. 1951. Diversidad de especies en comunidades
naturales. Publicaciones del Instituto de Biologia Aplicada e Barcelona 9:5-27.
MARQUES, C. S.; BRAUN, A. S. & FONTOURA, N. F. 2007. Estimativa de tamanho de primeira maturação a partir de dados de IGS:
Oligosarcus jenynsii, Oligosarcus robustus, Hoplias malabaricus, Cyphocharax voga, Astyanax fasciatus
(Characiformes), Parapimelodus nigribarbis, Pimelodus maculatus, Trachelyopterus lucenai, Hoplosternum littorale, Loricariichthys anus (Siluriformes) e Pachyurus bonariensis
(Perciformes) no lago Guaíba e laguna dos Patos, RS.
Biociências 15(2):230-256.
MATTHEWS, W. J. 1998. Patterns in freshwater ecology. New York, Chapman & Hall. 756p.
MILANI, P. C. & FONTOURA, N. F. 2007. Diagnóstico da pesca artesanal na lagoa do Casamento, sistema nordeste da laguna dos Patos: uma proposta de manejo. Biociências 15 (1):82-125.
MYERS, R. H. 1990. Classical and modern regression with applications. Belmont, Duxbury. 488p.
NUNES, D. M.; PELLANDA, M. & HARTZ, S. M. 2004. Dinâmica reprodutiva de Oligosarcus jenynsii e O. robustus
(Characiformes, Characidae) na Lagoa Fortaleza, Rio Grande do Sul, Brasil. Iheringia, Série Zoologia, 94(1):5-11. OKADA, E. K. A.; AGOSTINHO, A. A.; PETRERE JR, M. & PENCZAK, T.
Recebido em junho de 2009. Aceito em abril de 2010. ISSN 0073-4721 Artigo disponível em: www.scielo.br/isz
ponds and lagoons in the upper Paraná River basin, Brazil.
Ecohydrology & Hidrobiology 3(1):97-110.
OKUN, N.; MENDONÇA, R. & MEHNER, T. 2005. Diel shifts in community composition and feeding of juvenile fishes in the pelagic area of a large shallow lake. Limnologica 35:70-77. OLIVEIRA, M. L. A. A. & PORTO, M. L. 1999. Ecologia de Paisagem do Parque Estadual Delta do Jacuí, Rio Grande do Sul, Brasil: Mapa da Cobertura do Solo e da Vegetação, a partir de imagem do LADSAT.TM5. Iheringia, Série Botânica, 52:145-160. PEREIRA, L. E. 1994. Variação diurna e sazonal dos peixes demersais na Barra do Estuário da Lagoa dos Patos, RS. Atlântica16 :5-21.
PÉREZ-LÓPEZ, F. J. & SOLA-FERNANDEZ, F. M. 1993. DIVERS: Programa para el cálculo de los índices de diversidad.
Available at: <http://perso.wanadoo.es/jp-l/descargas.htm>. Accessed on: 20.08.2007.
PIANA, P. A.; GOMES, L. C. & CORTEZ, E. M. 2006. Factors influencing Serrapinnus notomelas (Characiformes: Characidae) populations in upper Paraná river floodplain lagoons. Neotropical Ichthyology 4(1):81-86.
PIELOU, E. C. 1966. The measurement of diversity in different types of biological collections. Journal of Theoretical Biology 13:131-144.
___. 1975. Ecological diversity. New York, John Wiley & Sons. 165p.
PIET, G. J. & GURUGE, A. H. P. W. 1997. Diel variation in feeding and vertical distribution of ten co-occurring fish species: consequences for resource partitioning. Environmental Biology of Fishes 50:293-307.
PILLAR, V. D. 1998. Sampling sufficiency in ecological surveys. Abstracta Botanica 22:37-48.
___. 1999. The bootstrapped ordination re-examined. Journal of Vegetation Science 10:895-902.
PILLAR, V. P. 2006. MULTIV, Multivariate Exploratory Analysis, Randomization Testing and Bootstrap Resampling Software. Available at: <http://ecoqua.ecologia.ufrgs.br/ecoqua/ software.html>. Accessed on: 10.11.2007.
PODANI, J. 1994. Multivariate data analysis in ecology and systematics: a methodological guide to the SYN-TAX 5.0 package. The Hague, SPB Academic. 316p.
RICKLEFS, R. E. 1987. Community Diversity: relative roles of local and regional processes. Science 235(4785):167-171. ROOKER, J. R. & DENNIS, G. D. 1991. Diel, lunar and seasonal
changes in a mangrove fish assemblage off southwestern Puerto Rico. Bulletin of Marine Science 49:684-698. SCHEINER, S. M. & WILLIG, M. R. 2008. A general theory of
ecology. Theoretical Ecology 1:21-28.
SCHLOSSER, I. J. 1982. Fish Community Structure and Function
along two habitat gradients in a headwater stream. Ecological Monographs 52(4):395-414.
SOUSA, R. G. C. & FREITAS, C. E. DE C. 2008. The influence of flood pulse on fish communities of floodplain canals in the Middle Solimões River, Brazil. Neotropical Ichthyology 6 (2):249-255.
SÚAREZ, Y. R.; PETRERE JR., M. & CATELLA, A. C. 2001. Factors determining the structure of fish communities in Pantanal lagoons (MS, Brazil). Fisheries Management and Ecology 8:173-186.
TEJERINA-GARRO, F. L.; FORTÍN, R. & RODRÍGUEZ, M. A. 1998. Fish community structure in relation to environmental variation in floodplain lakes of the Araguaia River, Amazon Basin.
Environmental Biology of Fishes 51:399-410.
TER BRAAK, C. J. F. 1995. Ordination. In: JONGMAN, R. H. J.; TER BRAAK, C. J. F. & VAN TONGEREN, O. F. R. eds. Data Analysis in Community and Landscape Ecology. Cambridge, Cambridge University. p.91-173.
TOWNSEND, C. R. & HILDREW, A. G. 1994. Species traits in relation to a habitat templet for river systems. Freshwater Biology 31:265-275.
TRIPE, J. A. & GUY, C. S. 1999. Spatial and temporal variation in habitat and fish community characteristics in a Kansas Flint Hills stream. Ecology of Freshwater Fish 8:216-226. WELCOMME, R. L. 1979. The fisheries ecology of floodplain
rivers. London, Longman. 317p.
WINEMILLER, K. O. 1989. Ontogenetic diet shifts and resource partitioning among piscivorous fishes in the Venezuelan llanos.
Environmental Biology of Fishes 26:177-199.
WINEMILLER, K. O.; TARIM, S.; SHORMANN, D. & COTNER, J. B. 2000. Fish assemblage structure in relation to environmental variation among Brazos River oxbow lakes. Transactions of the American Fisheries Society 129:451-468.
WOLTER, C. 2007. Temperature influence on the fish assemblage structure in a large lowland river, the lower Oder River, Germany. Ecology of Freshwater Fish 16(4):493-503. WOLTER, C. & FREYHOF, J. 2004. Diel distribution patterns of
fishes in a temperate large lowland river. Journal of Fish Biology 64:632-642.
WRIGHT, J. M. 1989. Diel variation and seasonal consistency in the fish assemblage of the non-estuarine Sulaibikhat Bay, Kuwait. Marine Biology 102(1):1432-1793.
YOSSA, M. I. & ARAÚJO-LIMA, C. A. R. M. 1998. Detritivory in two Amazonian fish species. Journal of Fish Biology 52 :1141-1153.