599
Fish assemblage in a dammed tropical river: an analysis along the
longitudinal and temporal gradients from river to reservoir
Bianca de Freitas Terra
1,2, Alex Braz Iacone dos Santos
1and Francisco Gerson Araújo
1We analysed changes in the fish assemblage structure along a longitudinal gradient of the Paraíba do Sul River and Funil Reservoir. We tested the hypothesis that shifts from lotic to lentic environment affect the richness and structure of the assemblage which are modulated by seasonal rainfall changes. Standardised monthly samplings were carried out from October 2006 to September 2007 in four zones: 1) river upstream from the reservoir; 2) upper part of the reservoir; 3) lower part of the reservoir, and 4) river downstream from the reservoir. Fishes were caught using gillnets deployed for 15 hours. We collected a total of 4550 specimens, representing 35 species and 5 orders. The highest richness and diversity were recorded in zone 2, the transitional zone between river and reservoir. In this ecotone, lotic and lentic species overlap. Greater abundance and biomass was recorded in the river upstream from the reservoir (zone 1); however, there are no differences between the zones in the structure of assemblages during the wet season. During the dry season, the assemblage structure is more differentiated between zones, although no differences in abundance and biomass occur. The seasonal flow of the river is the major driving factor to influence the fish assemblage structure along the longitudinal gradient from the river to the reservoir.
Mudanças na estrutura da assembleia de peixes foram analisadas ao longo de um gradiente longitudinal do rio Paraíba do Sul e Reservatório do Funil. A hipótese testada foi a de que mudanças do ambiente lótico para o lêntico afetam a riqueza e a estrutura da assembleia de peixes que são moduladas pelas variações sazonais da pluviosidade. Coletas mensais padronizadas foram realizadas entre outubro de 2006 e setembro de 2007 em quatro zonas: 1) rio a montante do reservatório; 2) parte alta do reservatório; 3) parte baixa do reservatório, e 4) rio a jusante do reservatório. Os peixes foram capturados com redes de espera que ficaram em operação por 15 horas. Um total de 4.550 espécimes foi coletado, representando 35 espécies e 5 ordens. A maior riqueza e diversidade foram registradas na zona 2, a zona de transição entre rio e reservatório. Neste ecótono, espécies lóticas e lênticas se sobrepõem. Maior abundância e biomassa foram observadas no rio a montante do reservatório (zona 1), no entanto, não houve diferenças na estrutura da assembleia de peixes entre as zonas durante a estação chuvosa. Durante a estação seca, a estrutura da assembleia de peixes foi mais diferenciada entre as zonas, porém sem diferenças na abundância e biomassa. O fluxo sazonal do rio é o principal fator a influenciar a estrutura da assembleia de peixes ao longo do gradiente longitudinal rio-reservatório.
Key words: Spatial patterns, Physico-chemical variables, Reservoirs.
1Universidade Federal Rural do Rio de Janeiro, Laboratório de Ecologia de Peixes. BR 465, Km 7, 23851-970 Seropédica, RJ, Brazil.
2Programa de Pós-Graduação em Ciências Ambientais e Florestais - UFRRJ. Introduction
Reservoirs have been considered hybrid systems due to their pronounced environmental gradient; that is, they have limnological properties intermediate between those of rivers and lakes (Thornton, 1990). Hence, the upper part of a reservoir tends to be similar to a river, while the lower part has characteristics more similar to a lake. Because of this gradient, local fish assemblages can be organised across space, since each species has different tolerance limits that vary across environmental gradients (Holmgren & Appelberg, 2000).
The longitudinal gradient can become more complex due to seasonal events such as rainfall, which is one of the most important changes in tropical aquatic ecosystems (Talling & Lemoalle, 1998). Seasonal variation in water flow is a major
the riverbed, and the river-reservoir gradient is characterised by three differentiated zones (riverine-transitional-lacustrine). Below the dam, the flow is regulated according to the requirements of the hydroelectric power plant. River flow in the studied reach averages 318 m3 s-1, ranging from 109 m3 s-1
during the dry season to 950 m3 s-1 during extraordinary floods
in the wet season (Hydroscience, 1977).
The purpose of this study was to investigate the spatial and seasonal patterns of the fish assemblage in Funil Reservoir and in the stretches of the Paraíba do Sul River upstream and downstream from the reservoir, and to determine how changes in abiotic variables influence their composition and structure. Questions addressed here include (i) How does the fish assemblage change along the longitudinal and temporal gradient from the river upstream to the reservoir to the river downstream? (ii) What physical and chemical variables are associated with longitudinal and temporal changes in assemblage structure? In answering these questions, we test the hypothesis that shifts from lotic to lentic environment affect the richness and structure of the fish assemblage due to physical, chemical and biological changes in the system, which are modulated by seasonal rainfall changes.
Material and Methods
Study area
The Funil Reservoir (22°30’S 44°45’W) was built in 1969 and is located in the middle to upper reaches of the Paraíba do Sul River basin. The water of the Paraíba do Sul River is used for domestic and public drinking water, irrigation, industrial self-supply systems, aquaculture and hydroelectric power generation.
The reservoir has a 16,800 km2 catchment area, a surface
area of 40 km2 and a perimeter of 320 km, impounding about
888 million m3. Its maximum depth is 70 m, while its average
depth is 20 m. The operational water level ranges from 444 to 465.5 m. The hydraulic retention time of the water is from 10 to 55 days, and the average flow is 220 m3s-1. According to
Branco et al. (2002), Funil Reservoir is developing increasingly eutrophic conditions due to anthropogenic influences.
The vegetation around the reservoir is very poor, a result of previous agricultural use for coffee plantations and pasture. The constant water-level oscillation contributes to marginal erosion and sedimentation in the reservoir. Reforestation programmes are being implemented by the power generation company responsible for the reservoir (Branco et al., 2002).
Sampling
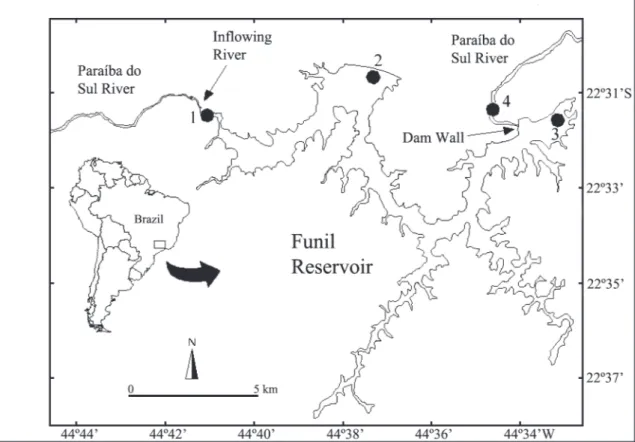
The study area consisted of four zones representing different ecological conditions within the system and selected to encompass the longitudinal axis from river to reservoir to river (Fig. 1). Zone 1 (22°31’50.7”S 44°42’64.0”W) was located in the Paraíba do Sul River upstream from the reservoir, with changes in flow dictated by rainfall. During the wet season, the water floods part of the riparian zone, increasing shelter and food for fish. The predominant substrate is clay, and average water depth is about 4 m. Zone 2 (22°31’63.0”S 44°40’83.0”W) was located in
the upper part of the reservoir, with a depth of approximately 11 m. The substrate is characterised by stones and rocky formations, increasing habitat complexity and depth and decreasing flow. Zone 3 (22°31’64.6”S 44°34’00.8”W) was located in the lower part of the reservoir and was characterised by the greatest transparency and depth (approximately 20 m). The substrate is sandy and forms a wide and unprotected littoral zone. Zone 4 (22°31’33.4”S 44°34’65.1”W) was located in the Paraíba do Sul River downstream from the reservoir. The depth in this area is approximately 3 m, with high habitat complexity due to stony, rocky and gravelly substrate and margins, stable flow and strong current. The riparian vegetation of this zone is less degraded than that of the other zones.
Sampling was performed monthly at four sites in each zone from October 2006 to September 2007 (except in May and July 2007). The sampling months were grouped into two seasons (wet and dry) according to the patterns of rainfall recorded during the study in the surrounding region. The wet season was characterised by monthly rainfall ranging from 100 to 400 mm, corresponding to the months from October 2006 to February 2007, while the dry season was characterised by monthly rainfall from 0 to 57 mm, corresponding to the months of March to September 2007.
Samplings of the fish assemblage were conducted at four randomly arranged locations within each zone. At each site, three gill nets (mesh sizes from 2.5 to 6.5 cm between opposite knots) were deployed, with a total area of 900 m2 per zone.
The nets were placed in the evening and removed at dawn the following day, remaining in place for approximately 15 hours. This fishing procedure catches mainly subadults and adults individuals which use the margins of the river and reservoir, thus emcompassing most of the fish assemblage.
Fish were identified to the species level. All the specimens were counted, weighed (to the nearest gram), and measured for total length (to the nearest millimetre). This material was fixed in 10% formalin for 48 hours and then preserved in 70% ethanol. Vouchers were deposited at the Coleção Ictiológica do Laboratório de Ecologia de Peixes, Universidade Federal Rural do Rio de Janeiro.
The physical and chemical characteristics of the water were determined by direct measurement using a multisensor Horiba W-21 (Horiba Trading Co., Shanghai). These measurements were taken concurrently with the sampling of the fish assemblage at four locations within each of the four zones. Measurements were made during the morning, at a depth of 20 cm from the water surface and a distance of approximately 3 m from the margin of the river or reservoir. The variables measured were temperature (°C), oxygen saturation (%), pH, conductivity (µS cm-1) and redox potential (mV).
Data analysis
Abundance and biomass were estimated through a standardised Capture Per Unit Effort (CPUE), defined as the sum of the total number (CPUEn) and weight (CPUEb) of captured fish per 100 m2 per 24 hours. This procedure
species among zones and seasons. Data were log-transformed [Log10(x+1)] to stabilise variance.
Species richness was compared among zones by using rarefaction of individuals with the help of the program EstimateS 8.0 (Colwell, 2006), and species diversity in each zone was measured using the Shannon index. The Indicator Species Analysis was used to determine which species might be used as indicators, characterizing different zones/seasons. This method, developed by Dufrêne & Legendre (1997), was applied using the software PCOrd (Mccune & Mefford, 1997). This analysis of species gives a value from 0 to 100%, where zero indicates that the species is not an indicator for a particular environment and 100 indicates that the occurrence of the species is characteristic of the environment. Statistical significance of each species was assessed by a Monte Carlo permutation test, using 1000 sample permutations.
In order to verify whether there are differences in fish species composition among zones and seasons (wet and dry), we performed the “Similarity Percentage” procedure (SIMPER). This analysis was performed with the software package PRIMER (Plymouth Routines Multivariate Ecological Research) (Clarke & Warwick, 2001). Because the data were not normally distributed, the nonparametric Kruskal-Wallis test was used to test the hypothesis that species distributions differed along the longitudinal axis (river-reservoir-river) and between the wet and dry seasons. When significant differences were detected, the Multiple Comparisons of Mean Ranks for all Groups test (p < 0.05) was used.
The abiotic variables were transformed [log10(x+1)] to meet the requirements of parametric statistics and to minimise the differences between units of different variables. Comparisons among zones and between seasons were made by analysis of variance (ANOVA) followed by a posteriori Tukey HSD tests at a significance level of 95%. Relationships between fish species abundance and abiotic variables were investigated for those species that contributed more than 1% of total abundance by using the Canonical Correspondence Analysis (CCA). This analysis was performed using the software CANOCO for Windows version 4.5.
Results
Fish assemblage
A total of 4550 specimens were captured, belonging to 35 species (5 introduced) and 5 orders (Table 1). Fourteen species individually contributed greater than 1% of the numerical abundance and collectively amounted to 95% of the total catch in number of individuals and 94.2% of the total biomass.
According to the rarefaction curves, the richness expected for a standard sample of 750 individuals was 26 species for zone 2 and 21 species for zone 3 (representing the reservoir). The expected richness values for zones 1 and 4 (representing the river) were 23 and 24 species respectively (Fig. 2). Zone 2 (1.40 ± 0.08; H = 11.28) had the highest Shannon diversity compared to the other zones (p < 0.05).
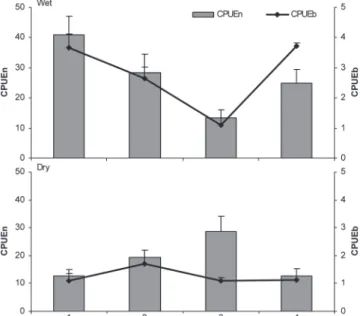
Changes in CPUEn and CPUEb were found between seasons for each zone and among the zones for each season (Fig. 3). During the wet season, a significant difference (H = 15.49; p = 0.01) was found in CPUEn between zone 1 (40.79 ± 6.28) and zone 3 (13.42 ± 2.56), while CPUEb was higher in zones 1, 2 and 4 compared to zone 3 (H = 28.37; p < 0.001). During the dry season, no significant differences among zones were found for CPUEn and CPUEb, although a trend for comparatively higher CPUEn values was observed for zone 3.
The river zones (1 and 4) exhibited significant differences in CPUEn and CPUEb between the dry and wet seasons. In zone 1, higher CPUEn (H = 13.03; p < 0.01) and CPUEb (H = 16.37; p < 0.01) values were found during the wet season than during the dry season. A similar pattern was found in zone 4 for both CPUEn (H = 7.17; p < 0.01) and CPUEb (22.66; p< 0.01). In the reservoir zones (2 and 3), both CPUEn and CPUEb were highly variable, and no significant trends were detected.
During the wet season, Pimelodus maculatus was the most representative species from the river zones (1 and 4) and Astyanax cf. bimaculatus was the typical species from the reservoir zones (2 and 3) , according to SIMPER (Table 2). During the dry season, A. cf. bimaculatus was typical from zones 1, 2 and 3, while P. maculatus was representative from zone 4. The greatest dissimilarities were recorded between zones 2 and 4 (72.8%) and between zones 3 and 4 (72.6%) during the dry season. On the other hand, the smallest dissimilarity was found during the wet season, between zones 1 and 2 (57.3%). According to the Indicator Species Analysis, 11 out of the 35 examined species showed significant indicator values (Table 3). Zones 1 and 4 had the largest number of indicator species (3 for each zone), while only L. conirostris and H. littorale were indicators for zone 2 and P. adspersus and A. cf. bimaculatus for zone 3.
Species abundance
Astyanax cf. bimaculatus and P. maculatus were the most abundant species in all zones, comprising 35% and 21% of the total number of fishes, respectively. However, the greatest biomass was recorded for P. maculatus, which amounted to 30%, and for A. cf. bimaculatus, which contributed to 9% of the total weight. Eleven species (Astyanax sp., Brycon insignis, Callichthys callichthys, Characidium lauroi, Cichla kelberi, Cyphocharax gilbert, Hoplerythrinus Table 1. Total number of individuals (N), trophic guilds (TG) and
total length (TL in mm) range of fish species by zone (1, 2, 3, 4) in the Paraíba do Sul River - Funil Reservoir system. O = omnivores; D = detritivores; C = carnivores; H = herbivores; In = invertivores.
Fig. 2. Individual-based rarefaction curves by zone (1, 2, 3, 4) for species richness in the Paraíba do Sul River and Funil Reservoir.
Zones
Individuals Species
TG N 1 2 3 4 TL
Astyanax cf. bimaculatus O 1618 366 418 718 117 89-149
Pimelodus maculatus O 969 422 135 70 343 98-350
Astyanax parahybae O 283 114 4 10 155 90-140
Hoplosternum littorale D 229 70 115 37 7 127-210
Metynnis maculatus O 223 11 190 16 7 118-149
Cichla kelberi C 211 3 7 201 0 110-271
Plagioscion squamosissimus C 208 77 70 54 7 105-360
Hypostomus auroguttatus D 181 26 66 7 81 190-354
Oligosarcus hepsetus C 105 24 16 22 43 149-303
Geophagus brasiliensis O 78 0 45 28 5 139-228
Leporinus copelandii H 65 33 20 2 10 164-435
Hypostomus affinis D 61 21 17 7 16 248-354
Hoplias malabaricus C 55 18 19 8 10 150-417
Leporinus conirostris H 48 13 26 3 6 248-354
Gymnotus carapo IN 41 10 26 1 4 237-341
Callichthys callichthys D 25 16 8 2 0 125-172
Astyanax giton O 23 0 0 0 23 95-115
Cyphocarax gilbert D 23 18 5 0 0 180-230
Rineloricaria sp. D 16 0 2 1 14 135-160
Pachyurus adspersus IN 14 2 2 10 0 215-252
Eigenmannia virescens IN 12 7 1 0 4 209-300
Hoplerythrinus unitaeniatus C 9 3 5 1 0 171-220
Oreochromis niloticus O 9 0 3 5 1 230-316
Rhinelepis aspera D 8 0 5 0 3 249-275
Leporinus mormyrops H 6 1 3 0 2 160-185
Probolodus heterostomus O 5 0 1 1 3 107-126
Piaractus mesopotamicus H 4 3 0 1 0 100-122
Crenicichla lacustris C 4 0 1 0 3 290-913
Characidium lauroi IN 3 1 2 0 0 204-209
Brycon insignis H 2 1 1 0 0 180-190
Rhamdia sp. C 2 0 0 0 2 140-160
Pimelodus fur O 2 0 0 2 0 123-149
Glanidium albescens O 2 1 0 0 1 145-150
Astyanax sp. O 1 0 0 1 0 120
Synbranchus marmoratus C 1 0 0 1 0 415
Total 4 550 1 261 1 213 1 209 867
unitaeniatus, Pachyurus adspersus, Piaractus
mesopotamicus, Pimelodus fur and Synbranchus
marmoratus) were found only upstream of the dam (zones 1, 2 and 3).Only two species (Astyanax giton and Rhamdia sp.) were found exclusively downstream of the dam (zone 4).
The introduced species (Cichla kelberi, Metynnis maculatus, Piaractus mesopotamicus, Plagioscion squamosissimus and Oreochromis niloticus) amounted to 14% of the total number of species when considering all sampled zones. In the reservoir, the introduced species amounted to 22% and 23% of the total number of individual fish in zones 2 and 3, respectively. Metynnis maculatus and C. kelberi were the most abundant introduced species in zones 2 and 3, respectively, comprising 70% and 72% of the total number of non-native individuals.
Environmental influences on fish distribution
The highest temperature in all zones was recorded during the wet season. Overall, zone 2 had the highest average temperature compared to the other zones during the wet season (Table 4). On the other hand, no differences in temperature were found among the zones during the dry season. Dissolved oxygen had an inverse relationship with temperature, with the highest values being recorded in dry season for all zones. During both seasons, the three zones upstream from the dam (zones 1, 2 and 3) had higher dissolved oxygen saturations than the zone downstream from the dam (zone 4). The pH values were significantly higher in the reservoir zones (2 and 3) compared to the river zones (1 and 4) in both seasons. Conductivity showed different spatial patterns according to season (ANOVA, p< 0.05); during the wet season, only slight changes were found between the zones, with significant differences between zones 1 and 3 (higher values) and zone 4 (lowest values). During the dry season, greater among-zone variation was detected, with zones 1 and 2 having higher values than zone 3. Although its
amplitude of variation was smaller, redox potential had comparatively higher values in zone 4 (p< 0.05), with such differences being greater during the dry season (Table 4).
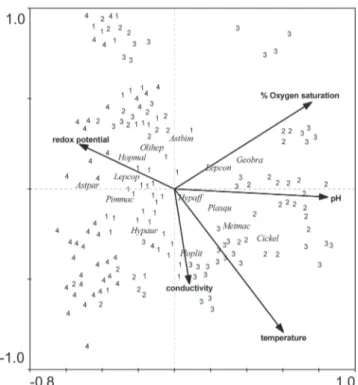
The Monte Carlo permutation test was significant for all abiotic variables (temperature, dissolved oxygen, redox potential, pH and conductivity) used in CCA. Therefore, none of these variables was excluded from the analysis. The first two axes explained 71.3% of the variance in the species-environment correlation (Table 5). The abiotic variables that contributed most to species distribution were dissolved oxygen, pH and temperature, which showed the largest vectors (Fig. 4). Axis 1 explained 53.5% of the species-environment relationship, being positively correlated with dissolved oxygen, pH and conductivity, and corresponding to the greatest abundances of P. squamosissimus, C. kelberi, M. maculatus and G. brasiliensis, species typical of the reservoir zones (zones 2 and 3). Axis 2 explained 17.8% of the species-environment relationship; this axis was negatively correlated with conductivity and temperature and positively correlated with dissolved oxygen.
Zones
1 2 3 4 Species
W D W D W D W D
Average similarity (%) 43.79 34.69 51.04 36.68 36.96 46.88 48.30 32.33
Astyanax cf. bimaculatus 19.87 52.22 21.28 35.44 32.62 38.25 8.49 17.70
Pimelodus maculatus 28.38 11.02 16.11 14.01 27.65 10.04 39.80 47.63
Hoplosternum littorale 7.90 18.88 7.82 10.48
Astyanax parahybae 6.94 12.34 6.01
Plagioscion squamosissimus 6.49 8.77 11.38 15.89 9.32 17.74
Leporinus copelandii 7.92 6.48
Oligosarcus hepsetus 5.70 7.04 14.47
Hypostomus auroguttatus 13.57 6.24 27.22 5.15
Cichla kelberi 13.03
Geophagus brasiliensis 12.44
Hoplias malabaricus 6.92
Zones
1 x 2 1 x 3 1 x 4 2 x 3 2 x 4 3 x 4
W 57.32 65.28 61.03 61.14 61.35 70.41
Average dissimilarity (%)
D 65.87 65.85 71.38 64.24 72.83 72.63
Table 2. Percent contribution of the most abundant species to similarity within the zones and dissimilarity between the zones. W = Wet season; D = Dry season.
Table 3. Significant values of the Indicator Species Analysis for fish assemblages for seasons and zones in the Paraíba do Sul River - Funil Reservoir system. Zone codes: 1 = Zone 1; 2 = Zone 2; 3 = Zone 3; and 4 = Zone 4.
Species Indicator Value
(Ind Val) P Zone/Season
Leporinus copelandii 22.0 0.000 1/wet
Callichthys callichthys 15.8 0.006 1/wet
Pimelodus maculatus 36.2 0.000 1/wet
Leporinus conirostris 20.2 0.003 2/wet
Hoplosternum littorale 36.3 0.000 2/wet
Pachyurus adspersus 12.2 0.003 3/wet
Astyanax cf. bimaculatus 24.3 0.010 3/wet
Cichla kelberi 54.9 0.000 3/dry
Astyanax giton 16.9 0.010 4/wet
Astyanax parahybae 28.7 0.001 4/wet
Discussion
We found that fish assemblage changed across the longitudinal gradient from river to reservoir to river, with greater species richness and diversity in the upper part of the reservoir (zone 2) where the influence of the river is greatest. This is associated with the transitional characteristics of the area, where river and reservoir conditions overlap. Areas of transition are considered fertile, with higher rates of primary productivity and density of fish, which contributes to the increase in diversity (Benedito-Cecílio et al., 1997). In zone 2, coexistence of species from both lotic and lentic systems was observed in the indicator species analysis; Leporinus conirostris, a migratoryspecies typical of large lotic systems, and H. littorale,an iliophagous species associated with the bottom of still waters and with low swimming capacity, were recorded.
On the other hand, the lowest species diversity and richness were recorded in the lower part of the reservoir (zone 3), where the non-native species C. kelberi and P. squamosissimus were abundant. Similar patterns have been reported in other Brazilian reservoirs (Agostinho et al., 2004a,b; Gubiani et al., 2010) and in other countries (Marchetti et al., 2006; Han et al., 2008). As in Itaipu Reservoir (Oliveira et al., 2004), the reduced richness of the lacustrine zone may be a result of local and historical processes, like habitat homogenization and wide changes in water level and, consequently, water quality, with a small number of native species being adapted to the new lentic environment.
The effect of the dam was also shown by the greater number of species that were found exclusively upstream from the dam (in zones 1, 2 and 3) as compared to those found exclusively downstream from the dam (zone 4); eleven and two species, respectively. Impoundment of rivers strongly affects the aquatic fauna by causing changes in the abundance and composition of species, with reduction or even local elimination of some populations (species) and a marked increase of others that find favourable conditions in the new environment (Fukushima et al., 2007). Therefore, dams create an artificial discontinuity between fish communities upstream and downstream of the dam (Ward & Stanford, 1983; Peter, 1998; Anderson et al., 2006). Gehrke et al. (2002) have also found divergence between populations of species that live upstream and downstream of the dam in the Shoalhaven River system, Australia.
A clear influence of the river’s seasonal pulse on local fish assemblages was detected in zones 1, 2 and 4 during the wet season. In this season, higher rainfall increases the river flow, resulting in increased resource availability and contributing to higher CPUEn and CPUEb in these zones. On the other hand, during the dry season, both the river flow and the availability of riparian habitat decrease, reducing the number of individuals in these zones. Such variation may also be related to the greater number of indicator species in the wet season (ten) compared with the dry season (one). Greater availability of resources during the wet season enables a larger number of species to use and maintain a steady population in the area. Additionally, the seasonal river pulse has a role in structuring fish assemblage, with greater dissimilarity among the zones during the dry season when the influence of the river is low, and the reverse situation (faunal homogenisation) during the wet season. Upstream migration of reservoir fish is promoted by increased water flow and temperature, so these factors may also be responsible for changes in the structure of fish assemblages. In tropical areas, the wet period is the reproductive season for rheophilic species that use reservoirs (Lowe-McConnel, 1991; Agostinho et al., 2004a). Increased abundance and biomass in zone 1 during the wet season suggests that new microhabitats become available for fish in the riparian zone, while the littoral zone in the lacrustrine area gains comparatively less new habitat space due to its less structured vertical margins. Since water level variations seasonally annex large areas of the terrestrial environment to the water bodies (flood zones), they promote environmental fluctuations that affect biological processes and the structure and function of species assemblages (Agostinho et al., 2004a). An inverse pattern was observed in the dry season, when zone 3 had greater albeit non-significant (p > 0.05) abundance and biomass compared with the other zones. The increased number of individuals in zone 3 during the dry season is probably related to increased primary production due to deeper light penetration, resulting in increased fish densities. According to Okada et al. (2005), species on the lentic conditions in the reservoir are closely related to availability of autochthonous resources and water transparency. Carnivorous species such as C. kelberi, a predator well adapted to lentic systems due to its strong vision, can take advantage of high water transparency, increasing their predation capacity. Cichla kelberi was the only indicator
Table 4. Abiotics data (mean ± s.d.) from four zones of the Paraíba do Sul River - Funil Reservoir system during the wet and dry seasons. n= 20 for each zone in each season. Superscript letters indicate significant (p < 0.05) differences according to ANOVA.
Season Zones Temperature (°C) Dissolved oxygen (%) pH Conductivity (µS cm-1) Pot. Redox
1 24.6±0.05b 71.9±1.0a 7.0±0.01b 87.4±0.32ª 169.8±2.4
2 27.0±0.07ª 93.7±2.3ª 7.9±0.03ª 83.2±0.30 145.6±2.8b
3 26.8±0.04 91.1±2.1ª 8.2±0.05ª 87.5±0.32ª 160.4±1.6
Wet
4 24.2±0.05b 41.3±0.6b 6.7±0.02b 80.4±0.33b 188.7±1.3a
1 22.4±0.17 82.8±0.4ª 7.1±0.01b 98.4±0.9ª 187.9±3.7
2 23.6±0.21 98.5±1.1ª 7.8±0.04ª 91.7±0.5ª 183.8±4.6
3 24.2±0.22 95.7±1.2ª 7.7±0.05ª 62.4±1.8b 137.7±2.1b
Dry
4 22.4±0.16 65.3±1.3b 6.7±0.02b 74.8±1.4 248.9±4.5ª
species found in zone 3 during the dry season, corroborating the hypothesis that lacustrine zones are suitable for carnivorous cichlids (Santos et al., 2001; Novaes et al., 2004). The reservoir exhibits spatial heterogeneity for abiotic variables, with higher pH and dissolved oxygen in the reservoir zones. Increased dissolved oxygen is favoured by decreased river flow, which enables higher transparency and thus increases phytoplankton biomass. According to Soares et al. (2008), the Paraíba do Sul River influences phytoplankton biomass by carrying nutrients into the reservoir. Besides contributing to increased dissolved oxygen, greater photosynthetic activity also increases pH due to removal of carbon dioxide from water (Reynolds, 1987 as quoted in Rahman et al., 2005). This process can lead to eutrophic conditions in reservoirs (Egborge, 1994 as quoted in Atobatele & Ugwumba, 2008). This situation has been previously described for Funil Reservoir (Rocha et al., 2002; Soares et al., 2008).
The Paraíba do Sul River upstream from the reservoir (zone 1) exhibited high conductivity due to the large nutrient inputs from urban areas in the watershed. According to CCA, species associated with the river zones (1 and 4) are mainly native and
characteristics of lotic systems, such as L. copelandii, A. parahybae and P. maculatus. Damming the river limits the distribution of the rheophilic L. copelandii and may sharply reduce its population size. The river zone downstream from the reservoir (zone 4) exhibited higher redox potential and lower dissolved oxygen compared with the other zones. This may be due to the operation of the hydroelectric power plant, which periodically discharges low quality bottom water as part of maintenance procedures (Soares, 1999). Effluents from the hydroelectric power plant may also contribute to increased redox potential. Species in this zone (e.g., A. giton, A. parahybae, and H. auroguttatus) are closely associated with structured habitats, suggesting that the physical structure is more important than water quality for the fish assemblage.
Conclusions
The longitudinal gradient of the Paraíba do Sul River -Funil Reservoir system alters fish assemblage structure, which are modulated by seasonal rainfall changes. Species richness and diversity are comparatively higher in the upper reaches of the reservoir which is a transitional zone where both lotic and lentic species overlap. The seasonal flow of the river influences fish assemblage structure, with greater abundance and biomass in the river upstream from the reservoir (zone 1) in the wet season, when dissimilarity between the zones were comparatively lower. During the dry season, the assemblage structure is more differentiated between zones, although no differences in abundance and biomass occur.
Acknowledgements
This paper is a portion of the first author’s Master’s Dissertation submitted to the Programa de Pós-Graduação em Ciências Ambientais e Florestais da Universidade Federal Rural do Rio de Janeiro. This research was partially financed by FURNAS Centrais Elétricas S/A. The first author received a scholarship from the Conselho Nacional de Desenvolvimento Científico e Tecnológico (CNPq) through the programme CT-HIDRO and from FAPERJ through the programme Cientista do Nosso Estado.
Fig. 4. Ordination diagram from Canonical Correspondence Analysis of the abundance of the 14 most numerous species with abiotic variables. Zone codes: 1 = Zone 1; 2 = Zone 2; 3 = Zone 3; and 4 = Zone 4. Species codes: Aspar = Astyanax parahybae; Astbim = Astyanax cf. bimaculatus; Cickel = Cichla kelberi; Geobra = Geophagus brasiliensis; Hopmal = Hoplias malabaricus; Hypaur = Hypostomus auroguttatus; Hoplit = Hoplosternum littorale; Hypaff = Hypostomus affinis; Lepcop = Leporinus copelandii; Lepcon = Leporinus conirostris; Metmac = Metynnis maculatus; Olihep = Oligosarcus hepsetus; Pimmac = Pimelodus maculatus; Plasqu = Plagioscion squamosissimus.
Table 5. Summary of Canonical Correspondence Analysis of data for biotic and abiotic factors in the Paraíba do Sul River - Funil Reservoir system.
Axes 1 2 3 4
Temperature 0.45 -0.47 0.00 0.00
Saturation of oxygen 0.57 0.29 -0.07 0.20
pH 0.63 -0.02 -0.00 -0.36
Potencial redox -0.39 0.15 -0.44 0.12
Conductivity 0.62 -0.31 -0.11 -0.36
Summary
Eigenvalues 0.157 0.052 0.039 0.034 2.459
Species-environment correlations 0.745 0.599 0.547 0.538
Cumultive percentage variance
of species data 6.4 8.5 10.1 11.5
of species-environment relation 53.5 71.3 84.5 96.2
Sum of all eigenvalues 2.459
Literature Cited
Agostinho, A. A., L. C. Gomes, S. Veríssimo & E. K. Okada. 2004a. Flood regime, dam regulation and fish in the Upper Paraná River: effects on assemblage attributes, reproduction and recruitment. Reviews in Fish Biology and Fisheries, 14: 11-19.
Agostinho, A. A., S. M. Thomaz & L. C. Gomes. 2004b. Threats for biodiversity in the floodplain of the upper Paraná River: effects of hydrological regulation by dams. Ecohydrology & Hydrobiology, 4: 267-280.
Anderson, E. P., M. C. Freeman & C. M. Pringle. 2006. Ecological consequences of hydropower development in Central America: impacts of small dams and water diversion on neotropical stream fish assemblages. River Research and Applications, 22: 397-411. Atobatele, O. E. & O. A. Ugwumba. 2008. Seasonal variation in the physicochemistry of a small tropical reservoir (Aiba Reservoir, Iwo, Osun, Nigeria). African Journal of Biotechnology, 7: 1962-1971. Benedito-Cecílio, E., A. A. Agostinho, H. F. Julio Jr. & C. S. Pavanelli.
1997. Colonização ictiofaunística do reservatório de Itaipu e áreas adjacentes. Revista Brasileira de Zoologia, 14(1): 1-14. Branco, W. C. C., M. I. A. Rocha, F. S. P. Pinto, G. A. Gômara & R. de
Filippo. 2002. Limnological features of Funil Reservoir (RJ, Brazil) and indicator properties of rotifers and cladocerans of zooplankton community. Lakes & Reservoir: Research and Management, 7: 87-92. Clarke, K. R. & R. M. Warwick. 2001. Change in marine communities: an approach to statistical analysis and interpretation. Plymouth, PRIMER-E Ltd, 172p.
Colwell, R. K. 2006. EstimateS 5: Statistical estimation of species richness and shared species from samples. Version 8.0 Guide and application published at: http://viceroy.eeb.uconn.edu/EstimateS. Dufrêne, M. & P. Legendre. 1997. Species assemblages and indicator species: the need for a flexible asymmetrical approach. Ecological Monographs, 67: 345-366.
Egborge, A. B. M. 1994. Water Pollution in Nigeria: Biodiversity and Chemistry of Warri River. Warri, Nigeria, Ben Miller Books Nigeria Limited, 331p.
Fukushima, M., S. Kameyama, M. Kaneko, K. Nakao & E. A. Steel. 2007. Modelling the effects of dams on freshwater fish distributions in Hokkaido, Japan. Freshwater Biology, 52: 1511-1524. Gehrke, P. C., D. M. Gilligan & M. Barwick. 2002. Changes in
fish communities of the Shoalhaven River 20 Years after construction of Tallowa Dam, Australia. River Research and Applications, 18: 265-286.
Gubiani, E. A., L. C. Gomes, A. A. Agostinho & G. Baumgartner. 2010. Variations in fish assemblages in a tributary of the upper Paraná River, Brazil: A comparison between pre and postclosure phases of dams. River Research and Applications, 26(7): 848-865. Han, M., M. Fukushima, S. Kameyama, T. Fukushima & B. Matsushita.
2008. How do dams affect freshwater fish distributions in Japan? Statistical analysis of native and nonnative species with various life histories. Ecological Research, 23: 735-743.
Holmgren, K. & M. Appelberg. 2000. Size structure of benthic freshwater fish communities in relation to environmental gradients. Journal of Fish Biology, 57: 1312-1330.
Hydroscience, Inc. 1977. The Paraíba do Sul river water quality study. Technical Report 6, BRA-73/003. New Jersey, Toms. River, 254p. Lowe-McConnell, R. H. 1991. Ecological studies in tropical fish communities. Cambridge, Cambridge University Press, 382p. Marchetti, M. P., J. L. Lockwood & T. Light. 2006. Effects of
urbanization on California’s fish diversity: differentiation, homogenization and the influence of spatial scale. Biological Conservation, 127: 310-31.
Mccune, B. & M. J. Mefford. 1997. Multivariate Analysis of Ecological Data. Version 3.11. Gleneden Beach: MjM Software. Novaes, J. L., E. P. Caramaschi & K. O. Winemiller. 2004. Feeding
of Cichla monoculus Spix, 1829 (Teleostei: Cichlidae) during
and after reservoir formation in the Tocantins River, Central Brazil. Acta Limnologica Brasiliensia, 16(1): 41-49.
O’Brien, W. J. 1990. Perspectives on fish in reservoir limnology. Pp. 209-225. In: Thornton, K.W., B. L. Kimmel & F. E Payne (Eds.). Reservoir limnology: ecological perspectives. New York, John Wiley & Sons, 246p.
Okada, E. K., A. A. Agostinho & L. C. Gomes. 2005. Spatial and temporal gradients in artisanal fisheries of a large Neotropical reservoir, the Itaipu Reservoir, Brazil. Canadian Journal of Fisheries and Aquatic Sciences, 62: 714-724.
Oliveira, E. F., E. Goulart & C. V. Minte-Vera. 2004. Fish diversity along spatial gradients in the Itaipu Reservoir, Paraná. Brazilian Journal of Biology, 64(3A): 447-458.
Peter, A. 1998. Interruption of the river continuum by barriers and the consequences for migratory fish. Pp. 99-112. In: Jungwirth, M., S. Schmutz & S. Weiss (Eds.). Fish Migration and Fish Bypasses: Fishing News Books. Oxford, 448p.
Pinto, B. C. T., M. G. Peixoto & F. G. Araújo. 2006. Effects of the proximity from an industrial plant on fish assemblages in the rio Paraíba do Sul, southeastern Brazil. Neotropical Ichthyology, 4(2): 269-278. Rahman, A. K. M., D. A. Bakri, P. Ford & T. Church. 2005.
Limnological characteristics, eutrophication and cyanobacterial blooms in an inland reservoir, Australia. Lakes & Reservoirs: Research and Management, 10: 211-220.
Reynolds, C. S. 1984. The Ecology of Freshwater Phytoplankton. Cambridge, Cambridge University Press, 384p.
Rocha, M. I. A., C. W. C. Branco, G. F. Sampaio, G. A. Gômara & R. de Filippo. 2002. Spatial and temporal variation of limnological features,
Microcystis aeruginosa and zooplankton in a eutrophic reservoir
(Fu-nil Reservoir, Rio de Janeiro). Acta Limnologica Brasiliensis, 4: 73-86. Santos, L. N., A. F. Gonzalez & F. G. Araújo. 2001. Dieta do tucunaré -amarelo Cichla kelberi (Bloch & Schneider) (Osteichthyes, Cichlidae), no reservatório de Lajes, Rio de Janeiro, Brasil. Re-vista Brasileira de Zoologia,18: 191-204.
Soares, C. B. P. 1999. Simulação da qualidade da água da UHE Funil com o modelo Ce-Qual-W2: Comparação entre duas formas de representação espacial. In: Schilling, M. (Ed.). Proceedings of the XV National Seminar on Production and Transmission of Electricity, Foz de Iguaçu, PR. 17 a 22 de Outubro, 1999. Minis-tério das Minas e Energia.
Soares, M. C. S., M. M. Marinho, V. L. M. Huszar, C. W. C. Branco & S. M. F. O. Azevedo. 2008. The effects of water retention time and watershed features on the limnology of two tropical reservoirs in Brazil. Lakes & Reservoirs, Research and Management, 13: 257-269. Talling, J. F. & J. Lemoalle. 1998. Ecological dynamics of tropical inland waters. Cambridge, Cambridge University Press, 452p. Thornton, K. W. 1990. Perspectives on reservoir limnology. Pp. 1-13. In: Thornton, K. W., B. L. Kimmel & F. E. Payne (Eds.). Reservoir limnology: ecological perspectives. New York, John Wiley & Sons, 246p.
Ward, J. V. & J. A. Stanford. 1983. The serial discontinuity concept of lotic systems. Pp. 29-42. In: Fontaine, T. D. III & S. M. Bartell (Eds.). Dynamics of lotic ecosystems. Ann Arbor, Ann Arbor Science, 494p.
Wootton, R. J. 1990. Ecology of teleost fishes. London, Chapman & Hall, 404p.