i
HETEROGENEOUS SENSOR DATABASE FRAMEWORK FOR THE SENSOR
OBSERVATION SERVICE: INTEGRATING REMOTE AND IN-SITU SENSOR
OBSERVATIONS AT THE DATABASE BACKEND
ii HETEROGENEOUS SENSOR DATABASE FRAMEWORK FOR THE SENSOR OBSERVATION SERVICE: INTEGRATING REMOTE AND IN-SITU SENSOR
OBSERVATIONS AT THE DATABASE BACKEND
Dissertation supervised by
Prof. Dr. Edzer Pebesma
Co-supervised by
Dr. Ismael Sanz
&
Dr. Pedro Cabral
FEBUARY 2012
iii
Declaration of Originality
iv ACKNOWLEDGEMENT
With utmost sense of reverence, I want to say thanks to the European Commission and the distinguished persons organizing this prestigious Erasmus Mundus Programme from the Institute of Geinformatics, university of Muenster, Universitat Jaume I, Spain and University of Lisbon, Portugal for this great opportunity given to me to participate in this wonderful master’s programme.
I express sincere appreciation to Christoph Stasch, my advisor for his unquantifiable help and support to make this a success. Lots of thanks are due to Prof. Edzer Pebesma for his great inspiration and idea that informed this thesis.
Thanks are also due to my co-supervisors, Dr. Ismeal Sanz and Dr. Pedro Cabral from Universitat Jaume I Spain and University of Lisbon Portugal respectively for their support and contributions. I could not meet them more often within this thesis period because of distance but they gave me a solid ‘go-ahead’ support and inputs for this accomplishment.
I want express my gratitude to Jorge Arevalo, the PostGIS Raster developer for his great help during the system configuration for the prototypical implementation of the research.
v ABSTRACT
vi
List of Figures
Figure 1 : The Conceptual Diagram ... 2
Figure 2: Workflow for comparing CIMIS and GOES temperature raster images ... 10
Figure 3: Overview of the communications flow and steps for the automated processing and calculation of vegetation productivity (Taken from (1))... 11
Figure 4: Image showing WARMER information flows (taken from (13)) ... 12
Figure 5: Sensor Web Concept (Source of Image courtesy of the OGC) . 15 Figure 6: Conceptual Coverage Diagram ... 21
Figure 7: UML Conceptual Model of the concept and Management of Coverages ... 22
Figure 8 : Regularly tiled rectangular raster coverage ... 26
Figure 9 : UML Conceptual Schema Model of the Proposed Heterogeneous Sensor Database .. 31
Figure 10: ER-diagram and logical design of the database model... 35
Figure 11: Conceptual Model of the proposed Web Query Service WQS ... 37
Figure 12: OpenJump Remote Database Query Connection Interface ... 37
Figure 13: Proposed Conceptual Architecture of Integrating the Heterogeneous Database and the Web Services ... 38
Figure 14: Multiple Database Approach Figure 15: Common Database Approach ... 41
Figure 16: Multiple Database Approach for scenario 3 ... 47
Figure 17: Remote Sensor Land Surface Temperature LST Data ... 56
Figure 18: Remote Sensor Sea Surface Temperature SST Data ... 56
Figure 19: Remote Sensor Normalised Difference Vegetation Index NDVI Data ... 57
Figure 20: A screen shot excerpt of the heterogeneous sensor database model with the tables ... 59
Figure 21: Screen short excerpt of Scenario 1 implementation in OpenJump ... 61
Figure 22: Screen short excerpt of a sample Scenario 2.1 implementation result in OpenJump 62 Figure 23: Screen short excerpt of a sample Scenario 2.2 implementation result in OpenJump 64 Figure 24: Screen short excerpt of a sample Scenario 3 implementation result in OpenJump ... 65
Figure 25: Screen short excerpt of a sample Scenario 4 implementation result in OpenJump client end ... 67
Figure 26: Screen short excerpt of a sample Scenario 5 implementation result in OpenJump client end ... 68
Figure 27: Current workflow in a dynamic geo-processing service ... 71
Figure 28: Proposed workflow in a dynamic geo-processing service by means of the heterogeneous sensor database ... 72
vii
List of Tables
viii
Listings
Listing 1: SQL sample query for scenario 1 ... 41
Listing 2: SQL sample query for Scenario 2.1 ... 42
Listing 3: SQL sample query for sample SQL queries Scenario 2.2 ... 44
Listing 4: SQL sample query for Scenario 3 ... 45
Listing 5: SQL sample query for Scenario 4 ... 48
Listing 6: SQL sample query for abstracting maximum and minimum pixel values ... 49
Listing 7: SQL sample query for describing raster coverage in the database ... 50
Listing 8 : Scenario 1 implementation SQL code ... 60
Listing 9: Scenario 2.1 implementation SQL code ... 62
Listing 10: Scenario 2.2 implementation SQL code ... 63
Listing 11: Scenario 3 implementation SQL code ... 64
Listing 12: SQL Query to obtain the NDVImax ... 66
Listing 14: Scenario 4 implementation SQL code ... 66
Listing 13: SQL Query to obtain the NDVImin... 66
ix List OF Acronyms
AET - Actual Evapotranspiration
AFIS - Advanced Fire Information System API - Application Programming Interface
ASCII – American Standard Code for Information Interchange AWDN- Automated Weather Data Network
CIMIS - California Irrigation Management Information System CSV - Comma Separated Values
ER – Entity Relationship
ESPG - European Petroleum Survey Group FVC - Fraction of Vegetation Cover
GDAL- Geospatial Data Abstraction Library
Geotiff – Georeferenced Tagged Image File Format GIS – Geographic Information System
GiST - Generalized Search Tree GLCF - Global Land Cover Facilities GML- Geographic Markup Language
GOES - Geostationary Operational Environmental Satellite Hdf - Hierarchical Data Format
HPRCC - High Plains Regional Climate Center HTTP - Hypertext Transfer Protocol
ISIES - Intelligent Sensorweb for Integrated Earth Sensing ISO - International Organisation for Standards
Jpeg - Joint Photographic Expert Group (Image Format) LST- Land Surface Temperature
MDD - Multi-Dimensional Discrete Data MIS - Marine Information System
MODIS – Moderate Resolution Imaging Spectroradiometer NASA - National Aeronautics and Space Administration NDVI - Normalised Difference Vegetation Index
NEO - NASA Earth Observations
NOAA- National Oceanic and Atmospheric Administration O&M - Observations & Measurements
OGC - Open Geospatial Consortium Png - Portable Network Graphics RasdaMan - Raster Database Manager RasQL - Raster Data Query Language RET - Referenced EvapoTranspiration SensorML - Sensor Model Language SOS - Sensor Observation Service SPS - Sensor Planning Service SQL – Structured Query Language SRID - Spatial Reference Identifier
x SST - Sea Surface Temperature
SWE - Sensor Web Enablement Tiff – Tagged Image File Format TML - Transducer Markup Language UML – Unified Modeling Language USGS – United States Geological Survey WCPS – Web Coverage Processing Service WCS – Web Coverage Service
WFS – Web Feature Service WKB - World Known Binary WMS - Web Map Service
WNS - Web Notification Services WQS – Web Query Service
xi
Table of Contents
ACKNOWLEDGEMENT ... iv
ABSTRACT ... v
List of Figures... vi
List of Tables ... vii
Listings ... viii
List OF Acronyms... ix
CHAPTER 1... 1
1.0 INTRODUCTION ... 1
1.1 Research Problem: ... 3
1.2 Research Hypothesis: ... 3
1.3 Research Questions: ... 3
1.4 Methodology ... 3
1.5 Thesis Structure Overview ... 4
CHAPTER 2... 5
2.0 BACKGROUND: ... 5
2.1 Studies dealing on In-Situ Sensor Databases: ... 5
2.2 Studies dealing on Remote Sensor (Raster) Databases: ... 6
2.3 Integrating Remote and In-situ Sensor Observations ... 9
2.4 Sensor Web Enablement, SWE ... 14
2.5 Sensor Observation Service SOS ... 15
2.6 Web Coverage Service WCS ... 16
2.6 Web Coverage Processing Service WCPS ... 17
CHAPTER 3... 18
3.0 REQUIREMENT ANALYSIS ... 18
3.1 Datatype Analysis; Differences and Commonalities... 18
3.2 Database Requirement Analysis for In-situ Sensor Observations ... 22
3.3 Database Requirement Analysis for Remote Sensor Observations (Raster data) ... 26
xii
CHAPTER 4... 29
4.0 CONCEPTUAL DESIGN AND MODELLING OF THE DATABASE SCHEMA ... 29
4.2 The Heterogeneous Database Schema Entity Description ... 29
4.1 UML Conceptual Schema Model of the Proposed Heterogeneous Sensor Database .... 31
4.3 ER-diagram and logical design of the database model ... 34
4.4 Integrating the Heterogeneous Sensor Database with the OGC Web Services ... 36
CHAPTER 5... 40
5.0 SCENARIO DESCRIPTION ... 40
5.1 Scenario 1: In-situ and satellite surface temperature analysis ... 40
5.2 Scenario 3: Geo-scientific Analysis of In-situ Temperature /Air Pressure Data and Satellite Elevation/ Height Observation ... 44
5.3 Scenario 4: Estimation of Actual Crop Evapotranspiration ET ... 46
5.4 Scenario 5: DescribeCoverage (Raster Coverage Metadata) Query Operation. ... 49
CHAPTER 6... 51
6.0 POSTGIS-BASED PROTOTYPICAL IMPLEMENTATION, PERFORMANCE AND HYPOTHESIS EVALUATION ... 51
6.1 System Configuration ... 51
6.2 Test Data Collection and Description ... 54
6.3 Physical Database Model Design ... 57
6.3 Implementation of some of the Application Scenarios and Use Cases. ... 59
6.4 Performance and Hypothesis Evaluation ... 68
6.3.1 Performance Analysis ... 68
6.3.2 Research Hypothesis Evaluation ... 70
Chapter 7 ... 74
7.0 CONCLUSION AND FUTURE WORK ... 74
References ... 77
1
CHAPTER 1
1.0 INTRODUCTION
Geo-sensors gathering data to the geospatial sensor web can be classified into remote sensors and in-situ sensors. Remote sensors include satellite sensors, UAV, LIDAR, Aerial Digital Sensors (ADS) and so on measuring environmental phenomena remotely. These sensors acquire data in raster format at larger scales and extent. In-situ sensors are spatially distributed sensors over a region used to monitor and observe environmental conditions such as temperature, sound intensity, pressure, pollution, vibration, motion etc. These sensors are measuring phenomena in their direct environment and could be said to acquire data in vector or feature data format.
Most environmental monitoring and management systems combine these diverse datasets from heterogeneous sensors for environmental modeling and analysis. For example monitoring and estimating of actual Evapotranspiration at a particular location involves the fusion of different sensor data. This involves the aggregation of fraction of vegetation cover which is derived from Normalised Difference Vegetation Index, NDVI generated from coverage data and the gridded reference Evapotranspiration map derived from automatic weather stations. Remote and in-situ sensor data aggregation is also needed in dynamic web mapping services for vegetation productivity (1) or in marine information system (2) .
geo-2 scientist want to compare for example the surface temperature value of a particular location from satellite observation and from in-situ temperature observations can easily be realized with this approach at the database backend without having to retrieve the massive raster data. Developing the database model that integrates remote sensor and in-situ sensor observations to leverage some of the above mentioned geo-scientific scenarios on the geospatial web services is the challenge and the essence of this research.
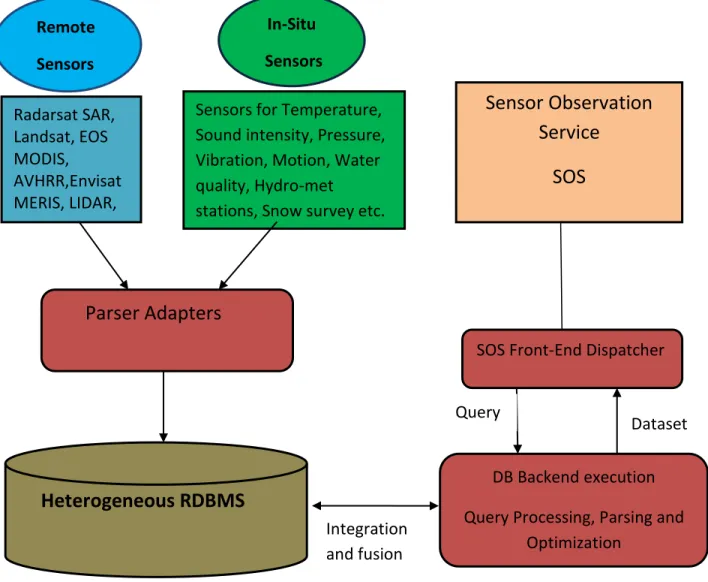
Figure 1 : The Conceptual Diagram
Figure 1 describes the research concept diagrammatically, showing the in-situ and remote sensor data passed to the heterogeneous sensor database where data integration , fusion and processing are carried out within the Sensor Observation Service, SOS.
Remote Sensors In-Situ Sensors
Parser Adapters
Heterogeneous RDBMS
DB Backend execution
Query Processing, Parsing and Optimization
Sensor Observation
Service
SOS
Radarsat SAR, Landsat, EOS MODIS, AVHRR,Envisat MERIS, LIDAR, UAV, ADS, etc.Sensors for Temperature, Sound intensity, Pressure, Vibration, Motion, Water quality, Hydro-met
stations, Snow survey etc.
SOS Front-End Dispatcher
Integration and fusion
Query
3 1.1 Research Problem:
The research problem for this thesis is the development of a heterogeneous sensor database model that enables Geo-scientific queries involving remote and in-situ sensor data aggregation at the database level and how this can be leveraged to reduced excessive work and communication load for relevant Geospatial Web Services.
1.2 Research Hypothesis:
If remote and in-situ sensor observations can be effectively integrated at the database backend, then communication and work load on the service middleware of the Geo-Web Services can be drastically reduced and query requests from the users would be more flexible.
1.3 Research Questions:
What are the methods that can be adopted for modeling heterogeneous sensor observations for databases?
What are the capabilities of existing DBMS in handling spatio-temporal and heterogeneous data models?
What are the specific constraints in implementing database schema that can be used for heterogeneous spatio-temporal observations?
How can geo-spatial web services leverage this solution in reducing excessive work and communication load on the service?
1.4 Methodology
To answer the above mentioned research questions towards solving the research problem and evaluate the research hypothesis, we approached this research in the following systematic sequence.
State-of-the-art survey
Requirement Analysis
Conceptual Design
Scenario Description
To examine the current methods of storing and managing remote and in-situ-sensor observations in sensor databases.
To find out the challenges of storing spatial-temporal remote and in-situ-sensor observations in a common database, conceptually and practically.
To address those challenges and develop a heterogeneous sensor database model and a model of the proposed integration with the OGC web services.
4 1.5 Thesis Structure Overview
The rest of this thesis is organised as follows: Chapter 2 provides the background work of existing studies and projects involving in-situ sensor observation database, raster database, integration of remote and in-situ sensor observations and also the OGC Sensor Web Enablement and some its specifications. Chapter 3 provides the database system requirement analysis for the seamless integration of in-situ and remote sensor observations at the database backend. Chapter 4 provides the conceptual and logical models of the proposed heterogeneous sensor database model and explains how the entities of the database schema relate. It also provides and discusses the conceptual model of how the heterogeneous database model can be integrated with other geo-web services for effectively services to the clients. Chapter 5 describes some of the scenarios and use cases where this type sensor database can be efficiently leveraged for geo-scientific analysis and processes. Chapter 6 provides the PostGIS-based prototypical implementation of the proposed heterogeneous sensor database model and provides the performance analysis of this prototypical implementation. In this section also is the discussion and evaluation of the research hypothesis based on the performance and results. Chapter 7 summarises this research and discusses the future work which will lead to more appreciation of this research work.
Prototypical Implementation and
Evaluation
5
CHAPTER 2
2.0 BACKGROUND:
Existing works and studies in in-situ sensor observations database and in remote sensor (raster) database provide insight into the possibility of developing a database models to integrate the two disparate data types. These studies offer a theoretical background for this.
The literature review or background to this thesis can be divided into the following categories; studies related to in-situ sensor observations databases, studies related to remote sensor observations (raster) databases, studies related to the integration of remote and In-situ sensor observations and finally OGC Sensor Web Enablement (SWE), Sensor Observation Service (SOS), Web Coverage Service WCS and Web Coverage Processing Service WCPS.
2.1 Studies dealing on In-Situ Sensor Databases:
The current Sensor Observation Service SOS of 52 North organization is an in-situ sensor observation service implemented as a servlet and can be deployed in any servlet container, such as Apache Tomcat. In-situ sensor observations are stored in the PostgresSQL database. Users can create customized SQL query tables with new data and metadata. On the client side, the OX-Framework provides the access to SWE SOS and subsequent visualization of the queried data from the database. The 52 North in-situ sensor observation data service can be implemented in a broad environmental monitoring and management areas. For example, it has been used in the implementation in the AFIS (Advanced Fire Information System) (3). However the shortcoming of this approach is that is a single type sensor database service, optimized for In-situ sensors. When dealing with a project that requires integration with coverage data, the coverage data will have to be pulled from a different raster database, e.g. implemented by a Web Coverage Service (4). This is not optimal for an application using these data because usually the coverage data retrieval and processing is very massive over the network.
6 Deegree SOS is very configurable enabling existing relational databases to be connected. On the client side, iGeoPortal is the web-based portal framework and offers visualization of geodata through a standard web browser (3). This is another in-situ sensor data type SOS without the possibility of coverage and feature data aggregation at the database backend.
2.2 Studies dealing on Remote Sensor (Raster) Databases: Why Raster Databases?
Peter Baumann et al. (5) stressed the importance of efficient raster data storage and retrieval, as raster data acquisition is increasingly becoming easier and less expensive. Currency and large area coverage of raster imageries are substantially higher when compared to vector data. Hence raster data competes and complements favorably with vector data in most geo-application. Consequently the need for efficient, flexible large scale raster data storage coupled with remote access and retrieval is very paramount.
The authors (5) also pointed out the advantages of a database system for raster data retrieval and transaction services. “Aside the flexibility in task definition, query languages allow the definition of complex tasks to the server better than atomic steps in procedural APIs” (5). Query optimizers gain a lot more freedom in rephrasing the query optimally for different situations. The paper also rightly mentioned that “application integration is much higher because one central instance is in charge of data integration and consistency”. This buttresses our argument that with a heterogeneous database system, data integration, consistency, flexibility, retrieval and transaction services will a lot more easy.
RasDaMan (5) is one of the systems efficiently implementing raster database management. RasDaMan is implemented as a middleware running on top of a relational database system. The RasQL query language affords the capability to semantically manipulate and retrieve raster data from the database. The expressiveness of RasQL enables a wide range of signal processing, imaging, and statistical operations up to, e.g., the Fourier Transform (5)
7 Multi-Dimensional Discrete (MDD) array raster database such as 2-D seamless aerial image map, a 3-D seamless map extended in the time dimension, and a 4-D database of climate simulation results were implemented in RasDaMan (5).
There are great advantages in the enhanced functionality provided by the query language approach, and in general by bringing standard database benefits such as multiuser synchronization, transaction support, and concise, explicit schema modeling to the area of raster data management. Finally, storing geo images in the database together with and vector data not only eases administration, but also enhances data consistency considerably (5).
2.2.1 Efficient Raster Data Management in Relational Databases
For an efficient and functional raster data storage that affords precised and effective geo-scientific queries in databases, raster data are stored as an array of multidimensional discrete data (MDD). Baumann in (6) proposed managing raster as multidimensional discrete data (MDD) in databases which relieves applications from many low-level but data-intensive data management tasks with the need for any specialized imaging and visualization subsystem. Storing raster data in a database as pure byte sequence where the DBMS has no knowledge about the underlying data semantics (pixel or tile structure), execution of effective geo-scientific queries and optimization are not possible.
Existing systems related to raster data management in a database environment, such as Oracle Spatial GeoRaster or Rasdaman are designed to support storing and querying dense multi-dimensional real-valued arrays based on tiling techniques (7). We are going to be adopting in this research, the approach of MDD array storage or tile storage which has been implemented in PostGIS 2.0.
2.2.2 Large Scale Raster Database for Geo-Services
8 The paper outlined some important factors that make database raster services outperform the file-based raster services. According to the paper, we could talk about;
Optimised tiling which makes the server fetch much less data from disk.
Database system enables the client to send a single complex request instead of a long sequence of atomic operations.
There is much less communication overhead when a single complex request can be made, no intermediate results have to be transfered back and forth and hence a minimum amount of data is required to answer the client’s needs.
Baumann in (9) highlighted the current envisaged use of WCPS as in navigation, extraction, and server-side analysis over large multi-dimensional coverage repositories. He discussed and illustrated the importance of SQL-like request language and database approach in geo-raster services. The request language allows navigation, extraction, and ad-hoc analysis on multi-dimensional geo-scientific raster data. For example extraction tasks like retrieving of satellite image bands, performing band combination, even deriving of vegetation index maps and classification can easily and efficiently handle on the database backend through the SQL request language.
According to Peter Baumann in (9), the request language has the following advantages:
It has a (semi-) formal semantics which combines concise syntax and semantics specification with legibility.
The language is declarative in that there is no explicit array iteration, thereby allowing to process arrays in any cell iteration sequence, in particular based on partitioned (“tiled”) storage schemes.
Coverages are treated in a data independent way: not only are requests independent
from data encoding, but also dimensions are addressed by name and not by index, thereby avoiding an artificial dimension sorting.
WCPS queries are safe in evaluation – every request terminates after a finite number of steps (proof omitted here, but straightforward).
9
2.2.3 PostGIS Raster Spatial Database
Raster support is one of the new features of PostGIS 2.0 (10). The new features enable users to store georeferenced, multiband, multiresolution, with nodata value raster coverages in Postgres/Postgis spatial database. Raster coverages are stored as tables of many tiles (Multi Dimensional Discrete Data MDD). Rasters can be loaded in any format supported by GDAL and the list of raster tables is available to applications in a table named raster columns. The capability to do raster/vector analysis is our main point of attraction to this POSTGIS 2.0. This will enable the capability of heterogeneous sensor data fusion and aggregation. It also allows for raster analysis in the raster way with a set of map algebra functions working on one pixel at a time, on the neighborhood of a pixel, on two rasters, with expressions or custom user PL/pgSQL functions. All analysis takes nodata values into account unless specified. You can edit rasters pixel by pixel, many pixels at a time, using raster coordinates or georeferenced geometries. We also have the ability to convert PostGIS rasters to geometries or to any raster format supported by GDAL. With raster, topology, routing and 3D capabilities, PostGIS is becoming a complete in-the-database GIS driven with the SQL language (10). Leveraging these capabilities to develop a heterogeneous sensor database model integrating coverage and feature data for an efficient Sensor Observation Service (SOS) is of high benefit for environmental monitoring applications.
2.3 Integrating Remote and In-situ Sensor Observations
10 Carlos Rueda et al. project on real-time integration of geospatial raster and point data streams (11) which was used for estimation of accurate Evapotranspiartion over an extended agricultural area (California)
The system streams coverage data from Geostationary Operational Environmental Satellite (GOES) satellite and in-situ data from the California Irrigation Management Information System (CIMIS) network of weather stations. The system calculates spatially distributed daily reference Evapotranspiration and produces corresponding daily maps for the state of California. The satellite data from GOES is used within the system for evaluating the output from the interpolation methods used.
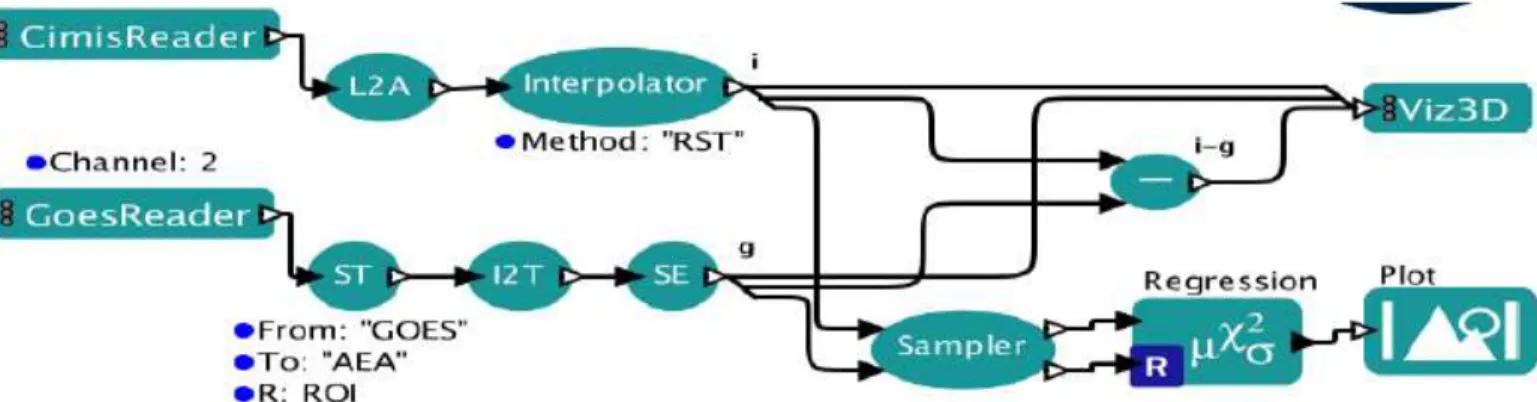
Figure 2: Workflow for comparing CIMIS and GOES temperature raster images (Taken from (Rueda and Gertz 2008))
The resulting interpolated temperature raster is denoted as i and the GOES-derived temperature raster is denoted as g in the figure above. And the stream extension SE actor spatially aggregates the incoming images to a single composite over the covered region.
11 2.3.1 Dynamic Web Mapping Service for Vegetation Productivity Using Earth Observation and in situ Sensors
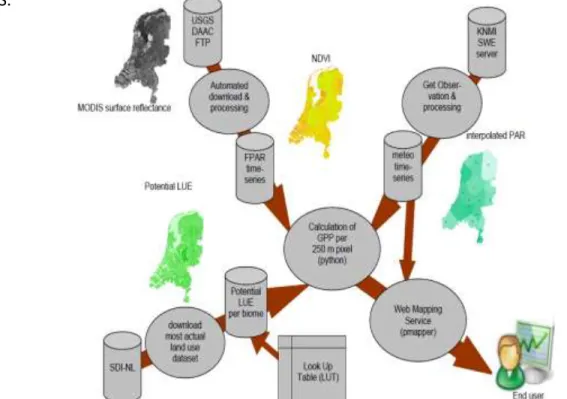
Lammert Kooistra et al. worked on dynamic web mapping service for vegetation productivity, (1) integrating remote and in-situ sensor observations in a web service approach. The study is actually a sensor web based system which combines remote sensor and in-situ sensor observations to derive near real-time vegetation productivity products. The application was developed and implemented within an automated processing facility.
The approach as shown in the figure, below retrieves MODIS data from the USGS DAAC file database and the in-situ sensor meteorological data requested from the PostGIS database of KNMI SWE server through the SOS GetObservation operation. The two different data are aggregated and processed at the middleware to generate the daily GPP product. And the final mapping products are stored as ASCII raster and made available to the end user through a WMS.
This approach is different from our proposed heterogeneous sensor database approach whereby the remote and in-situ sensor data are stored in one database. In our approach the massive data retrieval and processing at the middleware is reduced because the different sensor data aggregation and fusion can be carried out at the database backend.
12
2.3.2 WARMER- Water Risk Management in Europe Project
The WARMER project presents a web-based monitoring and management system that integrates and fuses medium to high resolution ocean colour satellite remote sensing data with in-situ measurements from the buoy monitoring systems. A "production line" for daily acquisition and generation of medium resolution satellite images (MERIS FR- Medium Resolution Imaging Spectrometer - full Resolution) was developed and implemented for WARMER. For In-situ data acquisition, the ADDP (Aberdeen DISPRO DB Proxy) for acquiring and communicating the in-situ data from multiple external databases was used. These information sources were integrated in the WARMER monitoring and management system, which is an OGC (Open Geospatial Consortium) compliant system offering results in form of WMS and WFS to
the users (12)
Figure 4: Image showing WARMER information flows (taken from (13))
This is also another concept of real-time integration of remote and in-situ observations on the service end after heterogeneous sensor data retrieval from different database ends over the network. Massive workload on the service end different from our approach transfers the data fusion and integration workload to the database backend.
2.3.3 Intelligent Sensorweb for Integrated Earth Sensing (ISIES) Project
13 and rangeland yield. ISIES is an on-line system that integrates an in-situ sensorweb, remote sensing imagery and Geographic Information System (GIS) data to provide superior estimates and predictions of biomass, crop yield and drought severity through open and standard interfaces (14). The ISIES host server is built to retrieve data from the sensorweb, process and store it in the relational database. It is actually a host of databases built on oracle 10g and file storage system that contains all ISIES data including remote, in-situ and GIS data. Through the automatic communication SmartCore devices, the in-situ data are retrieved on daily basis. A data fusion engine was developed to automatically run the plant models that intergrate in-situ and remote sensing data and the model are run on daily basis. Yield and biomass maps are produced on daily basis for each of the test sites.
Actually this server is built around Java and database connectivity (JBDC) is Java-based. This is also the approach of multiple databases and data retrieval from different databases and processed at the server end.
Hamre (2) proposes the Integration of remote sensing, in-situ and model data in the marine information system (2) and discusses about the usefulness of integration of in-situ and remote sensor observation in the marine information system (MIS). He mentioned that the integration of these different types of data in one information system will enable combination of data from different sources so that more information can be extracted than when analyzing them separately. His emphasizes here is actually on the usefulness of integrating these different sensor data in an MIS just like it is done in a GIS to generate more useful information about the marine environment. So it is not actually on the database approach that we are proposing.
14 useful insight for our research but is different from our approach because the data integration is not done at the database backend.
Stonebraker et al. (16) presented a benchmark that concisely captures the database requirements of a collection of earth scientist working in the SEQUOIA 2000 project. The authors emphasized the fact that earth scientist in the project dealt with four kinds of data; raster, point, polygon and detected graph data. Therefore there was a great need to develop database benchmarks that would enable integration of these kinds of data at the database backend. This would enable effective geo-scientific queries that run some kind of aggregation across the different data types on the database. This is also in line which our proposal for heterogeneous sensor database in the Sensor Observation Service (SOS) of the SWE.
2.4 Sensor Web Enablement, SWE
15
Figure 5: Sensor Web Concept (Source of Image courtesy of the OGC)
The OpenGIS Standards that make up the SWE suite of standards includes:
The Observations & Measurements Schema (O&M), Sensor Model Language (SensorML, Transducer Markup Language (TransducerML or TML), Sensor Observations Service (SOS), Sensor Planning Service (SPS), Sensor Planning Service (SPS), Sensor Alert Service (SAS) and Web Notification Services (WNS). They specify the encodings for describing sensors and sensor observations and interface definitions for web services. The research area of this thesis falls on the Sensor Observation Service (SOS) domain whereby these heterogonous sensors on the Sensor Web can be integrated on a heterogeneous database for the sensor observation service.
2.5 Sensor Observation Service SOS
16 channel. The SOS can also be accessed by the client to obtain metadata information about the associated sensors, platforms, procedures and other information associated with observations. Our research proposal relates to the SOS by defining database models for integration and retrieval of remote and in-situ observations at the database backend of SOS implementation.
2.6 Web Coverage Service WCS
The OGC Web Coverage Service (WCS) supports electronic retrieval of geospatial data as "coverages" – that is, digital geospatial information representing space/time-varying phe-nomena. (18)
The WCS 2.0 document (18) states that “A Web Coverage Service (WCS) offers multi-dimensional coverage data for access over the Internet’’
According to the OGC WCS 2.0 (18) documents a WCS provides access to coverage data in forms that are useful for client-side rendering, as input into scientific models, and for other clients. The WCS may be compared to the OGC Web Feature Service (WFS) and the Web Map Service (WMS). As WMS and WFS service instances, a WCS allows clients to choose portions of a server's information holdings based on spatial constraints and other query criteria.
Different from the Web Map Service WMS, which portrays spatial data to return static maps (rendered as pictures by the server), the Web Coverage Service provides available data together with their detailed descriptions; defines a rich syntax for requests against these data; and returns data with its original semantics (instead of pictures) which may be interpreted, extrapolated, and even reused not just portrayed.
And also unlike the Web Feature Service WFS, which returns discrete geospatial features (vector data), the Web Coverage Service returns coverages representing space/time-varying phenomena that relate a spatio-temporal domain to a (possibly multidimensional) range of properties. As such, WCS focuses on coverages as a specialized class of features and, correspondingly, defines streamlined functionality.
17 Application Schema; it is not constrained to quadrilateral grid coverages like previous WCS versions (19). The WCS is of high interest for our work as it is where the problem of massive data retrieval over the network lies.
2.6 Web Coverage Processing Service WCPS
Web Coverage Processing Service is meant to provide an open-ended framework for submitting requests of extensive complexity for processing on the server-side and returning the results. The processing and returning of results is done in a systematic and formally defined ways (4). The WCPS is currently under development within the OGC. The WCPS working group initiated and led by Jacobs University Bremen (4) . WCPS includes the functionalities of WCS and extends it with expression language to form requests of unlimited complexity.
The WCPS provides the GetCapabilities, DescribeCoverage and ProcessCoverage options to the client. The GetCapabilities option just like in the WCS provides the client with an XML document describing the service and brief descriptions of the data collections from which the client may request coverages. The DescribeCoverage operation allows the client to request for a full description of one or more coverages and get an XML document description of the coverages in return. The ProcessCoverage operation provides the client with the option to process and analyse and extract information from the coverage sets stored in the server, both grid data and metadata. The ProcessCoverage request is systematically defined by the client in the processing language which supports coverage processing expressions of high complexity (4).The result of the processing is then transmitted back to the client or made available for download. The WCPS request language proposed by peter Baumann in (9) is an SQL-like language that allows the client to declaratively navigate extract and analyze multi-dimensional raster data. This is implemented based on database approach and it is advantageous because the SQL is much formalized, declarative, data independent, optimizable and safe in evaluation (9).This research concept of heterogeneous database for integrating remote and in-situ observation at the database backend is intended to leverage solutions in the WCPS which involves massive coverage data retrieval.
18
CHAPTER 3
3.0 REQUIREMENT ANALYSIS
In this chapter we analyse the database system requirement for seamless integration of remote and in-situ sensor observations at the database level. The analysis is done taking into consideration the varying properties and the underlying semantics of these two different sensor datasets (raster and vector). The database model for this purpose will be design as a spatial database model based on OGC standards. That is to say we treat in-situ sensor observations as time series vector coverage and remote sensor observations as also time – dependent raster coverage.
This requirement analysis study is divided into four sections:
1. Analysis on the two different datatype contents of the proposed database, differences and similarities with a view in mind of possible integration option of the two datasets considering their common geometry inheritance properties.
2. Database requirement analysis for an effective and efficient storage of time series in-situ sensor observations which enables seamless integration with raster coverage data and retrieval.
3. Database requirement analysis for an effective and efficient storage of time series and multi-band remote sensor observations which enables seamless integration with feature (vector) data and retrieval.
4. System analysis of the spatial database management system to be used based on its capabilities to handle vector and raster over other spatial databases.
3.1 Datatype Analysis; Differences and Commonalities
19 ISO 19123:2005 defines a conceptual schema for the spatial characteristics of coverages. Coverages support mapping from a spatial, temporal or spatiotemporal domain to feature attribute values, where feature attribute types are common to all geographic positions within the domain. According to ISO 19123: 2005 “a coverage domain consists of a collection of direct positions in a coordinate space that may be defined in terms of up to three spatial dimensions as
well as a temporal dimension”- (20). We have coverage examples such as rasters, triangulated
irregular networks, point coverages etc.
“Coverages are like mathematical functions, they can calculate, lookup, intersect, interpolate, and return one or more values given a location and/or time. They can be defined everywhere for
all values or only in certain places ’’ - (21). Referencing ISO 19123:2005,the area covered by a coverage is referred to as the domain of that coverage while the values that can be returned by the coverage over the area are called the range of the coverage.
The range of coverage can be numbers, nominal values (for example the name of a town given the location) as well as spatial type (vector or raster).
“Querying a coverage for a set of values given a location is called evaluating the coverage.
Querying for a (set of) location(s) given some criteria on the values is given the name
evaluateInverse by ISO 19123. The specifics of how answers are generated for these queries
depend on the type of coverage and how the "supporting data" are stored” - (21).
20 Raster and vector coverages are both types of discrete coverage. They differ only in how they store and manage their collection of data. As coverages, they allow for basic query functions such as select, find, list etc. to be carried out on them.
Vector coverages handled as tables are the most common type of coverage implemented in most of the spatial database management systems. Individual data item are stored on each row in the table. The columns of the table ensure that collection is self-consistent. Texts are placed in text columns, numbers in numeric columns, and geometries in geometry columns and so on. The basic requirement a table must have for potential supply of information to a coverage is to have at least one geometry column and one additional column for a value or an attribute.
Raster coverages are handled as an array of multidimensional discrete data. In PostgreSQL/PostGIS precisely they are stored as regularly gridded data with the geometry of the domain as points and the range could be one or more numeric values (for example number of bands). Text values and timestamps may not be possible.
In-situ observations (vector data) are stored in tables with rows and columns in a relational manner, having one-to-one or one-to-many relationship. On the other hand remote sensor observations (raster) cannot reasonably be stored in tables but as gridded multidimensional array of data (array of points). That is to say we only have to leverage the concept of coverages to integrate the two tables in the database. The possible common column for the two datasets (tables) is the geometry column. The two datasets are collected by different sensor types in different coverage format but representing the same geographic area, it means that every point on the vector coverage has its corresponding point on the raster coverage.
Therefore the fundamental requirement from this data analysis that could enable us to integrate remote and in-situ sensor observations in a common database could be outlined as:
storage of in-situ observations as vector point coverage and
21 Below in Figure 6 & 7 are the conceptual map and the UML model of the concept and management of coverages describing features, relationships, functions and how they present in the database. This coverage conceptual map is an edited extract of the model discussed in PostGIS Wiki - (21). This gives insight on how coverages can be effectively handled in spatial database for seamless integration of raster and vector coverages.
Figure 6: Conceptual Coverage Diagram Coverage s Continuous Coverages Discrete Coverag es Data Geomval Collectio Tabul ar Gridde d Locatio Valu to Provide access Vector Coverag Raster Coverag Tabular Data GeomVal Collection Location
22 Figure 7: UML Conceptual Model of the concept and Management of Coverages
3.2 Database Requirement Analysis for In-situ Sensor Observations
Effective and efficient storage and retrieval of vector data has been well developed and implemented in most of the spatial databases such as Oracle Spatial, MySQL, Microsoft SQL Server 2008, SpatiaLite, Informix, Postgresql etc unlike the raster data counterpart .
But the issue here is on the requirements that can enable integration with raster data on the database as well time-effective query processing and retrieval.
2.2.1 Basic In-situ Sensor Observation Components
23 The components are:
Time (observation time or sampling time)
Location (geometry)
Producing sensor (sensor data)
Phenomenon which has been observed
Observation result value (observed data)
Looking at the list above, we have all the elements to create a coverage. The location (geometry) column serves as the domain of the coverage and the rest of the columns (attributes) as the range of the coverage. We will explore the use of this geometry coverage inheritance to examine heterogeneous and homogenous geometry column integration.
We will treat in-situ sensor observations as a vector coverage backed by tables. The geometry domain is point and the range is four or more columns which could be numeric, timestamp, text etc. individual data item are stored on each row in the table. The columns of the table ensure that collection is self-consistent. Texts are placed in text columns, numbers in numeric columns, and geometries in geometry columns etc. With these items in place a vector coverage is built.
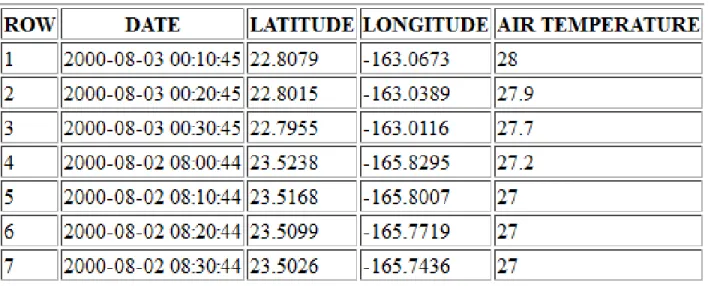
24 Table1 is an example of a vector point coverage. The longitude and latitude column can be used to build the geometry column which offers a point domain and the range is the columns with values. The observations will be stored as time series vector point coverage.
3.2.2 Fundamental database operation requirement for integration
Leveraging the concept of coverages, the functions and operation that can be carried out on coverages, the database can offer some of the following fundamental operations and functions on the vector coverage of in-situ sensor observation for possible integration and analysis with raster coverage.
Intersection operation
Buffer operation
Overlay operation
Interpolation operation ( vector to raster conversion)
With these operations, we can easily run queries for example that can lift a point on the vector coverage, intersect it with the geometrically corresponding point or cell on the raster coverage on the database and return a value. The goal is for us to be able to do relation and overlay operations on the different coverages irrespective of how the coverages are stored. The following intersection and overlay cases can be obtainable.
Vector to vector intersection or overlay
Vector to raster intersection or overlay
Raster to vector intersection or overlay
Raster to raster intersection or overlay
The buffer operation enables the selection of a point on the vector coverage, run a buffer of any extent over it and probably use the result for a possible intersection and overlay operation with a raster coverage.
25
3.2.3 Spatial Indexing:
Indexes are very important in spatial databases. They are what make search in large data sets possible. Without indexing, any search for a feature would require a sequential scan of every record in the database. Indexing speeds up searching by organizing the data into a search tree which can be quickly traversed to find a particular record. (24)
There are different types of indexing supported by most of the spatial database management systems.
The B-Trees which are mainly suitable for data that are sorted along one axis, for example numbers, letters, dates etc. This type of indexing does work for geospatial data because spatial data cannot reasonably be sorted along one axis. Therefore this cannot be suitable for sensor observations.
The R-Trees are suitable and supported by some spatial databases to index spatial data as well as the GiST indexes. The most popular open source spatial database system PostgreSQL/PostGIS does not have R-Trees well implemented as it did for GiST.
GiST stands for "Generalized Search Tree" and is a generic form of indexing. GiST is used to speed up searches on all kinds of irregular data structures (integer arrays, spectral data, etc) which are not amenable to normal B-Tree indexing.
Once a GIS data table exceeds a few thousand rows, there is need to build an index to speed up spatial searches of the data unless all searches are based on attributes, in that case a normal index on the attribute field could serve.
GiST indexes have two advantages over R-Tree indexes for example in PostgreSQL. GiST indexes are "null safe" (24), which means, they can index columns which include null values. Secondly, GiST indexes support the concept of "lossiness" (24), which is important when dealing with GIS objects larger than the PostgreSQL 8K page size. Lossiness allows PostgreSQL to store only the "important" part of an object in an index in the case of GIS objects, just the bounding box. GIS
26 3.3 Database Requirement Analysis for Remote Sensor Observations (Raster data) A coverage is created in the database once there is a geometry domain (column) and a range (column with values). This goes for raster coverages, In PostgreSQL/PostGIS for example a raster coverage is created by having a geometry column called raster and attribute columns containing the attributes to the raster (e.g. band number).
The fundamental database or storage support needed on the raster coverage for efficient and seamless integration and analysis with vector coverage in the database includes the following features:
Tiled raster storage: For pixel-level query, analysis and geoprocessing, the raster coverage must be stored in the database as gridded tiles (pixel) of data. One table row represents one raster tile. Each raster has associated attributes such as pixel size, width, height, georeferencing, number of bands, nodata value etc.
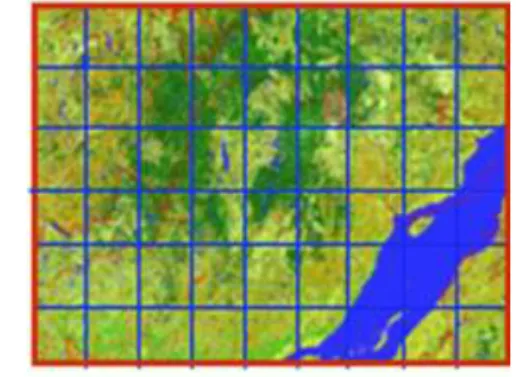
Figure 8 : Regularly tiled rectangular raster coverage
Georeferencing: The tiles must be georeferenced or geolocated in the database so that intersections and overlay operations with other data vector or raster can be possible.
Multiband and Multi-resolution support: There should be a support for multiband and multi-resolution storage. Each raster tile having bands with different pixeltypes as well as support for nodata value pixels.
27 Image Pyramid and compression: Image pyramid can be used to build multiple mosaics of images, each one at a different zoom level. It helps also to speed up image handling and processing.
This is very important to support data analysis at different scales and efficient storage of large size images.
Metadata Registration: Metadata of the observing sensor and observed data (raster data) should be supported in the database. Information such as name, sensor id, sensor model, spatial coverage, temporal coverage, ancillary data, quality, platform, etc. These information can be maintained in a separate metadata table outside the raster so that it can be conveniently used by applications and database optimizers outside the stored raster without processing the image.
Structured Query Language (SQL) Raster Functions and Operators Support: Raster manipulation and analysis functions and operators must be well supported by the database for raster geoprocessing and analysis at the database backend. And also the operators and functions for seamless integration of the raster with vector coverages in the database.
3.4 Spatial Database Management System Capability Analysis
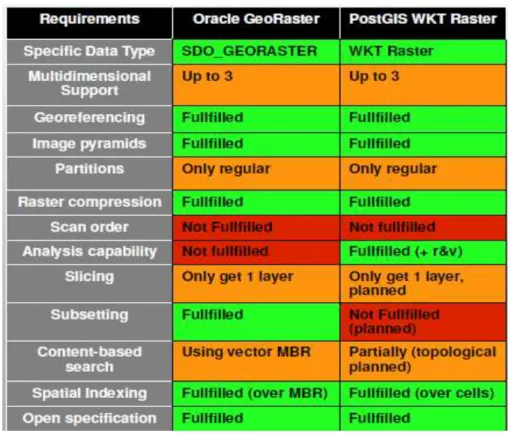
Some of the existing relational databases management systems have relatively good support for vector coverages. Oracle GeoRaster and PostgreSQL/PostGIS databases only have substantial support for raster coverage management. Meanwhile Oracle GeoRaster was primarily created for raster data storage with less support for raster data analysis in the database. In view of that, presently Oracle GeoRaster does not have the full support for our proposed heterogeneous sensortype database management and analysis system. However PostgreSQL/PostGIS2.0 has relatively good raster support, functions and operations that we can leverage for the feasibility of our research goal. In addition PostgreSQL/PostGIS2.0 can be configured with python GDAL-bonded to leverage more functionality. We shall briefly discuss some the PostgreSQL/PostGIS2.0 functionalities and capabilities over Oracle GeoRaster.
28 Rectangle (MBR). MBR is the raster object in Oracle GeoRaster while Pixel is the raster object in PostGIS2.0. PostGIS uses Geospatial Data Abstraction Libraries (GDAL) to handle multi-format image input and output and when working with out-db-raster, this is a powerful functionality. To achieve robust raster geoprocessing and analysis with Oracle GeoRaster as good as it can be done in PostGIS, it requires a middleware application such as RasdaMan. RasdaMan has been implemented on top of Oracle GeoRaster for raster coverage analysis.
Table2 below is an evaluation matrix table showing the functionalities of PostGIS Raster and Oracle GeoRaster based on the necessary system requirement for full raster data management and analysis in the database.
Table 2 : Evaluation Matrix between PostGIS Raster and Oracle GeoRaster Functionalities (taken from: (25))
29
CHAPTER 4
4.0 CONCEPTUAL DESIGN AND MODELLING OF THE DATABASE SCHEMA
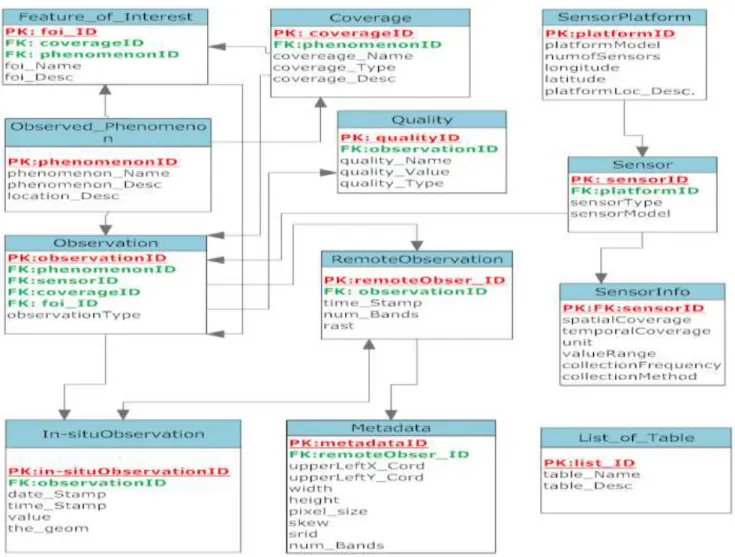
In chapter 3 we carried out the system requirement analysis and addressed the current challanges of having a heterogenous sensortype database that integrates remote and in-situ sensor observations. In this chapter we are looking at the possible conceptual design and model for this database. The UML model in figure 9 shows the high level abstraction model of the differents classes (tables), their attributes and important operations that can be carried out on them. It shows the relationships and the logic between the classes which enable integration between these classes. The ER diagram describes the logical design or abstraction of the entities, the fields in each class and the relationships between entities. Also in this chapter we developed the conceptual model of how the database model can be integrated with other web services seamlessly. The concept of the Web Query Service WQS is also explained.
4.2 The Heterogeneous Database Schema Entity Description
List_of _Table class is the table that contains the list of all the table names in the database. Operations like GetList_of_Tables and UpdateList_of_Table can be perform on it from the user end through our proposed SQL Web Query Service WQS. The efficacy of this table is to present to the user the names and descriptions of all the tables contained in the database. A “select * from list_of_table” SQL instruction from the client end would present a table describing all the tables contained in the database. This is a kind of DescibeTables operation by the user from the client end. This should be the first operation to be carried out by any user to have a good understating of the database before sending requests for specific data abstractions.
31 Figure 9 : UML Conceptual Schema Model of the Proposed Heterogeneous Sensor Database
32 The coverage class has an interface type class which defines the data type of the coverageType attribute of this class. The interface type is named Geometry, it has two values defining coverage type which can either be raster or vector coverage type.
Observed_Phenomenon class is the table that contains the names, descriptions, coverage type etc. of the various geographic phenomena that are contained in the observations. This is different from the features of interest table which contains the different features or formats of these observed phenomena that are of special interest. For example we have in our database, phenomena such as sea surface temperature, elevation, air pressure, wind speed etc., but from these phenomena, we have features such as the observations made in the night , observations during the day, observations postprocessed to a particular format and so on. These specifics are contained in the feature of interest table. The observed_phenomenon table has one-to-many relationships with Feature_of _interest , Coverage and Observation tables.
Feature_of_Interest class is the table that has the records of different features of the observed geographic phenomenon in the database. This is different from the Observed_Phenomenon table that has the record of the geographic phenomena observed from disparate sensors. The features of interest table can be updated, selected or listed by the user. This table has many-to-many relationship with the coverage, observed phenomenon and observation tables.
SensorPlatform class is the table with the record of the sensor platforms on which the sensors are mounted or housed. Attributes such as the platformId, number of sensors, platform location etc. are contained in the table. The table can be updated, selected from or listed . This table has one-to-many relationship with the sensor table. It has an interface type class named location which defines the PlatformLocation attribute data type that can be either longitude or latitude.
33 sensorInfo which it has one-to-many relationship with. This table has an interface type table called Type which defines the sensortype attribute which is either in-situ or remote. The table can be updated, selected from, listed etc.
SensorInfo table contains information related to the sensor mearsurement and method. Attributes such as spatial coverage, temporal coverage, collection frequency, unit of measurement etc. can be found in this table. The table has many-to-one relationship with the sensor table. Operations such as getSensorInfo, update and list can be performed on the class.
Observation class is the table that connects the Sensor, Observed_Phenomenon, Quality, In-situObservations and RemoteObservations tables. Observation table does not contain the values and time stamps of each observed value, they are contained in the in-situ and remote observations tables. The table has a unique id for each phenomenon observation stored in the database. The Observation table has many-to-many with the feature of interest, observed_phenomenon and the coverage table. And Many-to-one relationship with the sensor and the remote_observation tables. One-to-one relationship with the In-situ_observation and the quality tables.
In-situObservation class is the table that contains the compelete data of each observation that is contained in the Observation table where observationType is in-situ. It has one-to-one relationship with Observations table. The relationship between this table and the remote_observation table are handled on the fly leveraging the PostGIS intersection operation because the two coverages are handled differently in the database. Basic operations as well as complex operations such as intersection with raster, interoplation or rasterisastion can be carried out on this class. The attribute called the_geom contains the geometry of each observed data.
34 information as well as the the data values (geomval). The intersection between the in-situ and remote observations tables is made possible through the intersection of the ‘the_geom’ and the ‘rast’ which is always executed on the fly. Also more complex operations such as calculate, vectorise, intersect with vector can be performed on this class.
Metadata tables houses some important header data about any raster data contained in the RemoteObservations table. It has many-to-one relationship with the RemoteObservation table. It can be updated, selected from, listed etc. from the user end through an SQL- language based request. This table is created implicitly and encapsulated in the remote_observation table and is used to describe the coverages.
35 Figure 10 is the Entity Relationship diagram and logical design of the proposed heterogenous sensor database. The diagram shows the relationships between the tables and the attribute fields contained in each table. The primary keys PK are highlighted in red and underlined and the foreign key FK in green. In this logical design we try to avoid having intermediate tables to relate tables that have many-to-many relationship to each other. Instead we introduced foreign keys which can be leveraged by simple SQL-JOIN statements to integrate the tables.
The relationship and integration of the In-situObservation and RemoteObservation tables are executed on the fly, leveraging their geometry columns and the coverage concept that we discussed in content 3.1 above.
36 4.4 Integrating the Heterogeneous Sensor Database with the OGC Web Services
We are proposing an SQL-based Web Query Service WQS that delivers SQL queries from the user end to the database in the web service . This service can be intergated and accessed from within the user web or desktop application. This service provides the cleint the flexibility and ability to construct queries of extensive complexity which is delivered to the database for processing. In this case aggregations, processing and analysis of remote and in-situ observations are carried out at the database backend. The result of the query can be delivered in different formats such as ASCII, GML, KML, TIFF, JPEG etc in compliance with the OGC web mapping services, the WFS, WMS and WCS. The user specifies from the SQL query leveraging the PostGIs ST_As* function, the formats the data will be delivered. ASCII or text results are delivered to the client directly from the database through the WQS. If the request result is to be delivered as a raster coverage, that means the query result is a raster or a rasterised vector and will be delivered to the client through the Web Coverage Service WCS protocol. Similar process goes for a vector or vectorised query result which is delivered through the Web Feature service WFS protocol. The request result can be delivered as a JPEG or PNG image format to the user through the Web Map Service WMS protocol.
4.4.1 The concept of the Web Query Service WQS
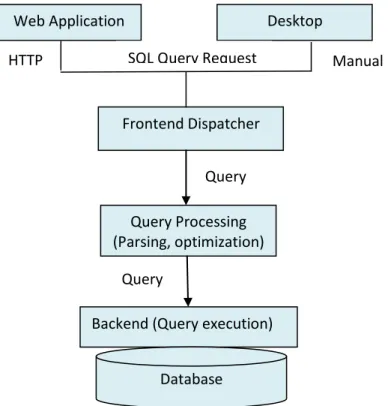
37 Figure 11: Conceptual Model of the proposed Web Query Service WQS
In Figure 11 the SQL query is delivered from the frontend dispatcher of client web or desktop application to the query processing and optimization module for optimization and parsing to the backend for query execution.
From a web application or API, the SQL query request is dispatched via the HTTP. From within a desktop application, a connection to the database will have to be established before queries are sent to the database for execution. Figure 12 is a sample OpenJump PostGIS database connection and query delivery interface on the client OpenJump GIS application.
Figure 12: OpenJump Remote Database Query Connection Interface
Web Application Desktop
Application
Frontend Dispatcher
Query Processing (Parsing, optimization)
Backend (Query execution)
Database HTTP SQL Query Request
Query
Query
38
4.4.2 Proposed Conceptual Architecture of Integrating the Heterogenous Sensor Database and OGC Web Services.
Figure 13: Proposed Conceptual Architecture of Integrating the Heterogeneous Database and the Web Services
SOS
SQLSERVER
WCS WFS WMS
SQL
ASCII Datasets SQL
CLIENT
Web Service Protocol
Heterogeneous Sensor Database
Client End
WQS
40
CHAPTER 5
5.0 SCENARIO DESCRIPTION
In this chapter we describe some few scenarios and use cases out of the numerous use cases where the proposed heterogeneous sensor database model can be leveraged to accomplish geo-scientific queries and processing involving remote and in-situ observations at the database end. Ranging from the a simple case where a geo-scientist would want to obtain the temperature difference between in-situ and remote temperature observations to a more complex case of estimating daily plant Evapotranspiration of a particular location. Example SQL queries are formulated and evaluated over what has been the approach on the web service.
5.1 Scenario 1: In-situ and satellite surface temperature analysis
A simple case of this scenario would be a situation where a geo-scientist is interested in determining the temperature difference between a particular in-situ temperature observation and the corresponding temperature value on the satellite surface temperature observation. Presently to carry this out on a dynamic web service, would involve the following process flow.
Communication to the two ends of the respective databases (In-situ observation database and raster database).
Data retrieval from the two respective databases
Analysis and geo-processing at the service middleware
Return of result to the client side.
41
Figure 14: Multiple Database Approach Figure 15: Common Database Approach The heterogeneous sensor database approach gives the user on the client side the leverage to send an SQL-query request in the form in listing1 to the database and gets the required result.
Listing 1: SQL sample query for scenario 1 SELECT
I_t, (tv).val as R_t, (I_t - R_t) as D_t
FROM (SELECT ST_intersection(R.rast, I.the_geom) AS tv,
I.temp_value as I_t, ST_Value(R.rast, I.the_geom) as R_t
FROM In_situ_temp I, Remote_temp R
WHERE I.the_geom && R.rast
AND ST_intersects(R.rast,I.the_geom)
AND I.temp_id = 111111111
) foo; Service Middleware Raster Database In-situ Database Client end Analysis and processing for Temperature difference Result Client end Heterogeneous Sensor Database Analysis and processing for
temperature difference
SQL-query
42 The sample SQL query in listing1 above does the required analysis and aggregation of the temperature values from in-situ observation temperature table (In-situ_temp) and remote sensor observation surface temperature table (Remote_temp), I_t and R_t respectively and returns the difference, D_t. The Intersection operation (ST_intersection) is used to intersect the point geometry of the particular in-situ temperature observation (the_geom) where id is ‘11111111’ with the corresponding geometry of the temperature pixel (rast) on the remote temperature observation.
Note: the id value ‘111111111’ is arbitrary in these sample queries; it can become any value in the real implementation exercise.
The ‘foo’ is an arbitrary alias name for the sub-query in the query statement.
5.1.1 Scenario 2.1: Weighted Mean surface temperature values from vector buffers
We now describe a sample case whereby a geo-scientist would want to create buffers around the in-situ temperature observation points on the in-situ temperature observation tables, overlaps these buffers on the raster surface temperature observations and finally retrieves the weighted mean raster surface temperature values of these buffers in comma separated values CSV format.
The listing 2 sample SQL query request can be delivered to the heterogeneous sensor database through the proposed Web Query Service WQS from the client end to extract the pixel-area weighted mean temperature values of those buffers.
Listing 2: SQL sample query for Scenario 2.1
SELECT sum(ST_Area(the_geom)*val)/(sum(ST_Area(the_geom))) AS Meantemp
FROM (Select(ST_Intersection(R.rast, (ST_Buffer(I.the_geom,1000)))).geom AS the_geom
(ST_Intersection(R.rast, (ST_Buffer(I.the_geom, 1000)))).val AS val
FROM In-situ_temp I, Remote_temp R
WHERE the_geom && R.rast
ST_Intersects(R.rast, I.the_geom)