What is meant by health situation analysis?
Health situation analyses (HSA) are analytical-synthetic
processes that encompass various types of analysis.
HSA make it possible to characterize, measure, and explain the health-disease profile of a population, including ill-nesses, injuries and other health problems and their determi-nant factors, whether they are the responsibility of the health sector or of other sectors. The HSA also facilitate the identi-fication of needs and priorities in health, as well as the iden-tification of interventions and appropriate programs and the evaluation of its impact on health.
HSA are based on the study of the interaction of the living conditions and the existing level of the health processes of a
country or any other geographic-political unit. The HSA
include as substrata population groups with different degrees of
neglect, resulting from unequal living conditions and quality of life and defined according to specific characteristics such as sex, age, occupation, etc., that occur in specific environments. The environment constitutes the historical, geographical, demographic, social, economic, cultural, political, and epi-demiological context of the human groups, where complex relations of determination and effect exist.
What are the purposes of HSA?
The HSA have various purposes and their importance resides in contributing the information that the technical component requires for directing, management, and deci-sion-making processes in health. In particular, the purposes are to support in:
• Definition of needs, priorities, and policies in health and the evaluation of their relevance.Figure 1 exemplifies the assessment of social needs of geostatistical units, using high population density, crowding and limited access to water at home as indicators, and identification of priority areas, where higher levels of those factors co-exist, in the city of Guadalajara, Mexico. Although the distribution patterns of high levels of the indicators towards the periphery are simi-lar, when a condition to identify all three in a single geo-graphic unit was set, only a few units were selected.
• Formulation of strategies of health promotion, disease prevention and control and the evaluation of their rel-evance and fulfillment.Figure 2 shows changes in the risk of meningoccocal disease in Cuba at the local level after the introduction of universal vaccination. Overall, a decrease was observed, but areas of persistence were seen
in the central and eastern areas of the country, a finding that deserves further study.
• Construction of prospective health scenarios. Figure 3 displays the 1950-1995 trends of infant mortality rates for 5 groups of countries of the Americas, classified according to Gross National Product per capita in 1995, Group I being the most affluent and V the least. An overall decrease of mortality in the Region was observed in all
groups. However, countries in group V had not reached in 1995 what was occurring in Group I in the 1950-1954 period
and the pace (slope) of change has been more dramatic in the opposite way, being faster in the least and slower in the most affluent ones.
Methodological Summaries in Epidemiology:
Health Situation Analyses
Vol. 20, No. 3
September 1999
IN THIS ISSUE...
• Methodological Summaries in Epidemiology: Health Situation Analyses
• Norms and Standards in Epidemiology – New PAHO List 6/67 for Tabulation of
ICD–10 Mortality Data
• Health Situation in the Americas. Basic Indicators 1999: selected basic indicators
• News:
That is, the HSA serve for political negotiation, institu-tional management, resource mobilization, and the dissemi-nation of health information. The principal goal of the HSA is to contribute to the rational decision-making for the satis-faction of the health needs of the population with a maxi-mum of equity, efficiency, and social participation.
Which are the different types of HSA?
There are several types of analysis, among them the analy-ses of trendsand the analyses of situation. The first ones have as their purpose to identify and to determine the condi-tions of changes in the health-disease processes of a popula-tion, usually in the medium and long terms. In turn, the situation analyses respond to a context and short-term defined situations that make it possible to orient courses of action depending on conditions of viability and feasibility of the existing political situation.
Measuring Inequity in Health
Inequity in health is expressed in the structure and level of
the health-disease profile of the various population groups. This
results from their exposure to risk factors that are related to living conditions, their control of exposure, their access to health services and their opportunity to participate in the decisions with respect to the management of those services. The HSA will have characteristics that will depend on the level of aggregation of the information, whether they are car-ried out at the national, regional or local level.
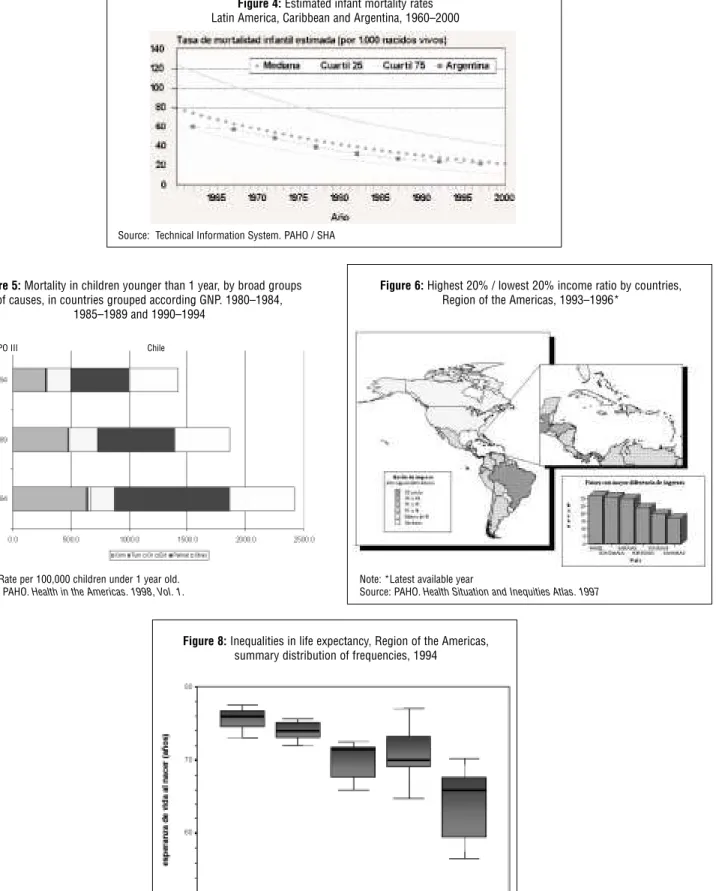
For example, the trends of infant mortality of a country in
a period can be analyzed, comparing them with Latin America and the Caribbean (Figure 4). The progress of mortality in a
country can also be defined according to its causes, consid-ering that the quality and access to the health services will affect more the perinatal causes, while the living conditions will have a more important effect on communicable diseases (Figure 5).
Another example to analyze, for its effect on health, is the evolution and distribution of the wealth of the Region of the Americas in relation to the Gross National Product (GNP), specifically the highest 20%/lowest 20% income ratio (Fig-ure 6). The gaps can be analyzed between countries, the geo-graphical pattern by subregions, and their relation to levels of life expectancy at birth (Figure 7).
Figure 2:Changes in the risk of meningococcal disease, Cuba. 1989-1994
Figure 3:Infant mortality rate trends in the Americas. 1950-1995
Infant mortality rate per 1000 live births
Source: PAHO. Health in the Americas. 1998, Vol. 1
Source: PAHO/SHA. Geographic Information Systems in Health
Figure 4: Estimated infant mortality rates for Latin America, the Caribbean and Argentina, 1960–2000
Source: Technical Information System. PAHO/SHA
Figure 5: Mortality in children younger than 1 year, by broad groups of causes, in countries grouped according to GNP* .
1980-1984, 1985-1989 y 1990-1994
Note: * Rate per 100.000 children under 1 year old Source: PAHO. Health in the Am ericas, 1998, Vol. 1
GRUPO III Chile
Figure 7: Inequalities in life expectancy,
Region of the Americas, summary distribution of frequencies, 1994
Source: Basic Indicators 1996. Health Situation in the Am ericas
Figure 6: Highest 20% / lowest 20% income ratio by countries, Region of the Americas, 1993-1996*
Note: * Last available year
When changing from one revision of the International
Classification of Diseases to another, a particular concern is the potential impact of the changes on health statistics.1 This concern is usually taken into account when preparing special tabulation lists, such as those for presentation of mor-tality data.
PAHO efforts underway concerning development of a short list for mortality tabulation using ICD-10 were men-tioned in a previous article.2 In this regard, and as part of a process leading to development of a short ICD-10 list for PAHO use in tabulating mortality data, the Special Program for Health Analysis undertook a review of experience using the 6/61 list for tabulating ICD-9 mortality data.3,4This was accompanied by a review of the special tabulation lists for mortality recommended in ICD-10 volume 1, as well as lists developed for their own use by the countries and by other international agencies.5 A provisional list was then prepared, submitted for scrutiny by data users and ICD experts, and used for trial tabulation of real data from several different countries of the Americas that are at different stages of development.
The PAHO 6/61 List
Development of the PAHO 6/61 list was conceptualized in 1987, when several countries of the Americas carried out research projects on health profiles/mortality analysis, with technical support from the Health Situation and Trend Assessment Program (now the Special Program for Health Analysis) and under the sponsorship of the PAHO Research Grants Program. The research projects focused on grouping of causes of deaths and preparing short lists for mortality analysis. Upon completion of the projects a Regional Meet-ing on Guidelines and Procedures for Mortality Analysis was held, in February 1988, and subsequently a summary of the reports of several research projects were published in the PAHO Epidemiological Bulletin.6,7,8
At the Regional meeting the need to be able to analyze causes of death according to different epidemiological crite-ria was discussed, and also the fact that the groups of causes of death which are used in the analyses generally reflect the epidemiological criteria applied. Different analytical objec-tives usually require different groupings of causes, and short lists differ depending, for example, on whether the purpose of the analysis is to generate knowledge, to identify leading causes of death, or to define priorities and orient actions at political and technical levels. It was acknowledged that sev-eral lists are probably needed for use at national level, and the recommendation was made that a short list be developed by PAHO for Regional use, to facilitate comparisons between countries.
First used in the 1992 edition of Health Statistics from the Americas, the 6/61 list is used by PAHO for summary pre-sentation of mortality data. Designed specifically for mortal-ity data coded according to the ICD-9, its main purpose was to facilitate inter-country comparisons, and thereby to assist PAHO in undertaking mortality analysis from a Regional perspective. A broad process of consultation with selected analysts and experts in the Region was followed in its prepa-ration, with the hope that the list, as finally adopted, would be useful at country level as well. Ultimately, it was intended to be a PAHO contribution to the countries as a tool for mor-tality analysis— a short list that could serve the needs of countries as well as those of PAHO.
Of necessity, however, the 6/61 list reflects the data restric-tions imposed by the PAHO mortality questionnaire. This was the instrument used by PAHO for many years for col-lecting ICD-9 data from the countries of the Region, and is essentially a condensed version of the ICD-9 Basic Tabula-tion List.9,10 In recent times the questionnaire has gradually been replaced by diskette transmission of data at the level of individual deaths. However, the list of cause groups on the questionnaire, called the "A9 list", is still the maximum level
New PAHO List 6/67 for Tabulation of
ICD-10 Mortality Data
1 PAHO. Revisions of the International Classification of Diseases (ICD-9 and ICD-10): Impact on Health Statistics. Epidemiological Bulletin. Vol. 17, No. 2. Washington, D.C., July 1996.
2 PAHO. Implementation of the International Classification of Diseases and Related Health Problems, Tenth Revision (ICD-10). Epidemiological Bulletin. Vol. 18, No. 1. Washington, D.C., March 1997.
3 PAHO. Health Statistics from the Americas, 1992 edition. Washington, D.C., 1992. 4 PAHO.Health Statistics from the Americas, 1995 edition. Washington, D.C., 1995.
5 WHO.International Statistical Classification of Diseases and Related Health Problems, Tenth Revision. Vol. 1, pp. 1207-1214. Geneva, 1992. 6 PAHO. Regional Meeting on Guidelines and Procedures for Mortality Analysis.Epidemiological Bulletin. Vol. 9, No. 2. Washington, D.C., 1988. 7 PAHO.Health Profiles, Brazil, 1984.Epidemiological Bulletin. Vol. 9, No. 2. Washington, D.C., 1988.
of detail available in the PAHO mortality database.
As shown on Table 1, the 6/61 list consists of six broad groups of causes and 61 more detailed groups nested within those six. Deaths due to signs, symptoms and ill-defined con-ditions are presented in a separate category that precedes the 6/61 cause groups.
The six broad groups are defined as follows:
• Group l, "Communicable diseases," comprises all infec-tious and parasitic diseases, i.e. all the categories in ICD-9 chapter I, and in addition, meningitis, acute respiratory infections, and pneumonia and influenza. It should be noted that deaths due to AIDS are not included in this group. A few countries use ICD-9 codes 042-044 for AIDS, and report AIDS deaths to PAHO under these codes. However, a WHO Expert Group recommended use of codes 279.5 and 279.6, and as a result, upon inclusion in the PAHO database all AIDS deaths are (re)assigned to A9 category 18.9, a residual grouping of ICD-9 cate-gories that includes code 279. Most countries of the Americas use ICD-9 codes 279.5 and 279.6 for AIDS deaths, but some use 279.1 or another subcategory of 279.
• Group 2, "Neoplasms," comprises all of ICD-9 chapter II, i.e. malignant neoplasms, benign neoplasms, carcinoma in situ, neoplasms of uncertain behavior and those of unspecified nature.
• Group 3, "Diseases of circulatory system," comprises all of ICD-9 chapter VII, i.e. acute rheumatic fever, chronic rheumatic heart disease, hypertensive disease, ischemic heart disease, diseases of pulmonary circulation and other forms of heart disease, cerebrovascular disease, and "other" diseases of the circulatory system.
• Group 4, "Certain conditions originating in the perinatal period," comprises all categories in chapter XV, i.e. maternal conditions and obstetric complications affecting the fetus or newborn, slow fetal growth, fetal mal-nutrition and immaturity, birth trauma, hypoxia, asphyxia, other respiratory conditions of fetus or newborn, infec-tions specific to the perinatal period, and other and ill-defined conditions originating in the perinatal period.
• Group 5, "External causes," comprises all of chapter XVII, Code E, i.e., all accidents, suicide, homicide, injury due to legal intervention and operations of war, and injury undetermined whether accidentally or purposely inflicted.
• Group 6, "All other diseases," comprises all other defined causes not included in groups 1 to 4. It is important to
note that Group 6, as a whole, is not a residual category; rather, it contains several subgroups that have major pub-lic health importance but do not belong in any of groups 1 to 4. Examples are: diabetes mellitus, congenital anom-alies, and complications of pregnancy, childbirth and the puerperium.
Preparation of the ICD-10 Short List
In preparing a PAHO short list for tabulation of general mortality under 10 it was clear that several other ICD-10 lists would need to be prepared as well. For example, a second ICD-9 list is already in use for tabulating infant and child mortality, and an ICD-10 version is needed.11 Yet
another list is needed for ascertainment of leading causes of death.
The new ICD-10 short list would not be used for every purpose, but it had to be a list that PAHO could recommend to countries for adoption. It also had to serve a fundamental purpose which the 6/61 list already addressed since it was created: as a point of entry to any mortality analysis. The ICD-10 short list was intended, as was the 6/61, to provide a panoramic view of causes of mortality in any country. It was to be compiled at the earliest stages of any mortality analy-sis undertaken, and it would place causes of death in proper perspective and weight relative to each other. Once this was accomplished, special tabulations for particular analytical purposes would follow.
Several criteria were established in preparing the ICD-10 short list. First, the six broad groups of the 6/61 list would be retained. Second, the groups contained within the broad six would be as similar as possible to those of the 6/61 list, although exact line-by-line equivalences were not impera-tive and, moreover, might not always be possible in light of changes between ICD Revisions. Third, groups could be dropped or new ones included, based on experience with real data from the countries. Finally, it was assumed that ICD-10 mortality data will be provided by countries to PAHO at 4-character level, hence no restrictions would be placed on the level of detail of the ICD codes making up the groups.
A provisional 6/65 ICD-10 list was circulated to the WHO Collaborating Centers for Classification of Diseases in the Region of the Americas. These are the Brazilian Center for Classification of Diseases (for the ICD in Portuguese), the Venezuelan Center for Classification of Diseases (for the ICD in Spanish), and the North American Center, serving Canada and the United States and located at the U.S. National Center for Health Statistics. A number of experts in different countries of the Americas were also consulted, as well as PAHO staff at Headquarters and in the field. After a final internal review which took into account the feedback received, supplemented by data-based considerations, the
6/67 list was agreed upon and is presented in Table 2. A detailed analysis of the differences between the 6/61 and 6/67 lists follows.
Comparison of the PAHO 6/67 (ICD-10)
and 6/61 (ICD-9) Lists
As was the case for the 6/61 list, the 6/67 list was prepared for mortality tabulation. However, the 6/61 list has also been used for tabulation of morbidity, and although less than ideal this will probably continue to happen. In anticipation of this, ICD-10 codes that should not be used for underlying cause of death, which are contained in various chapters, were not excluded. Nonetheless, the two entire chapters (XIX and XXI) that should not be used for coding underlying cause of death were omitted from the 6/67 list.
The 6/67 list, as planned, contains six broad groups of causes; however, it was not possible to attain exact equiva-lence between all the broad groups of both lists. Two broad groups of the 6/67 list are completely equivalent to the cor-responding broad groups of the 6/61 list: 2.00 Neoplasms, and 5.00 External causes. Broad groups 1.00 Communicable diseases, 3.00 Diseases of circulatory system, 4.00 Certain conditions originating in the perinatal period, and 6.00 All other diseases are different as to content. Differences are largely minor, except for a major change that should be high-lighted: a new group, 1.07 HIV disease, was established under broad group 1.00 of the 6/67 list. By contrast, list 6/61 placed it in group 6.14 Residual of all other diseases, and PAHO tabulations place AIDS deaths in 6/61 group 6.14, following WHO recommendations that this cause be coded as a subcategory of ICD-9 code 279.
Based on experience using the 6/61 list, several groups that usually had a very small number of deaths were excluded from the 6/67 list. However, several new groups were added, and the ICD-10 list grew to 67 groups nested within the six broad groups. As an intended result, residual groups should contain fewer deaths under list 6/67 than under the 6/61.
The names of the broad groups remained the same, while the names of several groups nested within the broad six were changed slightly in order to maintain consistency with terms used in ICD-10, or to reflect the changed content of the group. Within each broad group, the groups are placed in increasing ICD-10 code sequence.
Those groups for which there is no exact equivalence between the 6/61 and 6/67 lists are discussed below.
a. Certain vector-borne diseases and rabies (6/67, 1.03)
Group 1.03 of the 6/67 list includes dengue, hence it is not equivalent to group 1.04 Certain vector-borne diseases of
list 6/61, which does not. On list 6/61, dengue is part of group 1.09 Other infectious and parasitic diseases. "Rabies" was added to the name of the group on the 6/67 list, in recog-nition of the fact that it is not a vector-borne disease. Rabies as a cause of death is included in this group under both lists.
b. Certain diseases preventable by immunization (6/67, 1.04)
Group 1.04 of the 6/67 list contains the following diseases, in addition to those included in group 1.03 of list 6/61: neonatal tetanus, obstetrical tetanus, rubella (except congenital), viral hepatitis B, and mumps. On list 6/61 these diseases are included in groups 1.09 Other infectious and parasitic diseases, 4.06 Other conditions originating in the perinatal period, and 6.12 Complications of pregnancy, childbirth and the puerperium.
c. Meningitis (6/67, 1.05)
Group 1.05 of the 6/67 list contains all clinical forms of meningococcal disease (such as meningococcal meningitis and meningococcemia) and also viral meningitis, in addition to bacterial meningitis and meningitis of unspecified cause. On the 6/61 list, group 1.07 Meningitiscontains only bacte-rial meningitis and meningitis of unspecified cause.
d. Syphilis and other venereal diseases (6/61, 1.06)
This group does not appear separately on the 6/67 list; rather, it is part of group 1.09 Other infectious and parasitic diseases. e. HIV disease (AIDS) (6/67, 1.07)
This 6/67 group is a new one. On the 6/61 list, this disease is part of group 6.14 Residual of all other diseases.
f. Other infectious and parasitic diseases (6/67, 1.09)
As a result of the changes mentioned above, this 6/67 group is not equivalent to 6/61 group 1.09.
g. Malignant neoplasm of uterus (6/67, 2.07, 2.08, 2.09)
The three components of list 6/61 group 2.07 Malignant neo-plasm of cervix uteri, and of body and unspecified parts of uterus appear separately on list 6/67. These are 6/67 groups 2.07 Malignant neoplasm of cervix uteri, 2.08 Malignant neoplasm of corpus uteri, and 2.09 Malignant neoplasm of uterus, part unspecified.
h. Malignant neoplasm of lymphoid, hematopoietic and related tissue (6/67, 2.12 and 2.13)
List 6/61 group 2.10 Malignant neoplasm of lymphatic and hematopoietic tissuewas separated into two groups on the 6/67 list: 2.12 Leukemiaand 2.13 Malignant neoplasm of lymphoid, other hematopoietic and related tissue.
i. Pulmonary heart disease, diseases of pulmonary cir-culation and other forms of heart disease (6/67, 3.04)
into three 6/67 groups. One of them is 3.04 Pulmonary heart disease, diseases of pulmonary circulation and other forms of heart disease; the other two are 3.05 Cardiac arrestand 3.06 Heart failure, which are mentioned below.
j. Cardiac arrest (6/67, 3.05)
This group was not identified separately on the 6/61 list; it was included on list 6/67 to offer users the possibility of interpreting it as an ill-defined cause or keeping it within group 3.00 Diseases of the circulatory system.
k. Heart failure (6/67, 3.06)
This group was not identified separately on the 6/61 list, where this cause of death is part of group 3.04 Diseases of pul-monary circulation and other forms of heart disease.
l. All other diseases of the circulatory system (6/67, 3.09)
This residual group of the 6/67 list is not equivalent to the residual 6/61 group 3.07 Other diseases of circulatory sys-tem, because the 6/67 group excludes polyarteritis nodosa. ICD-10 places this cause of death in Chapter XIII Diseases of the musculoskeletal system and connective tissue, which is a part of 6/67 group 6.14 Remainder of diseases.
m. Bacterial sepsis of newborn (6/67, 4.05)
On the 6/61 list this is not a separate group; rather, it is included in 4.06 Remainder of certain conditions originating in the perinatal period.
n. Hemolytic disease of fetus or newborn (6/61, 4.05)
This 6/61 group does not appear as a separate group on the 6/67 list. Instead, it is included in the residual 6/67 group 4.06 Remainder of certain conditions originating in the peri-natal period.
o. Remainder of certain conditions originating in the perinatal period (6/67, 4.06)
As a result of the changes mentioned above, this 6/67 group is not equivalent to 6/61 group 4.06.
p. Land transport accidents (6/67, 5.01)
Under ICD-9, motor vehicle traffic accidents are grouped in E810-E819 and appear as group 5.01 of the 6/61 list, whereas under ICD-10 they are scattered among the trans-port accidents, which are organized quite differently. Under ICD-10 the first axis is the type of vehicle, followed by two other axes: type of accident and person involved, which are not always placed in the same sequence. Use of the group
Land transport accidents, which corresponds to an entire range of ICD-10 codes (V01-V89) provides a good approxi-mation to motor vehicle traffic accidents.
q. Other and unspecified transport accidents (6/67, 5.02)
This group refers to water transport accidents, air and space transport accidents, and other and unspecified transport acci-dents. It is not exactly equivalent to any group on the 6/61 list.
r. Falls (6/67, 5.03)
This 6/67 group excludes fracture, cause unspecified, which was part of 6/61 group 5.05 Accidental falls. Under ICD-10, fracture, cause unspecified does not have an individual code but is assigned to residual category X59 Exposure to unspec-ified factor. Hence this group is not equivalent to 6/61 group 5.05.
s. Misadventures during medical care, abnormal reac-tions and late complicareac-tions, and drugs and medica-ments causing adverse effects in therapeutic use (6/61, 5.04)
This 6/61 group does not appear on the 6/67 list as a separate group. Rather, it is part of the residual 6/67 group 5.10 All other accidents.
t. Accidental threats to breathing (6/67, 5.06)
This group did not appear on the 6/61 list.
u. Exposure to electric current (6/67, 5.07)
This group did not appear on the 6/61 list.
v. Accidents caused by machinery, and by cutting and piercing instruments (6/61, 5.08)
This 6/61 group does not appear on the 6/67 list as a separate group. Rather, it is part of the residual 6/67 group 5.10 All other accidents.
w. All other accidents (6/67, 5.10)
This residual 6/67 group is not equivalent to the 6/61 resid-ual group 5.10 Other accidents, including late effects. In view of the fact that different accidental cause groups were established in the 6/61 and 6/67 lists, the residuals are also different.
x. Assault (homicide) (6/67, 5.12)
This 6/67 group is not equivalent to group 5.12 of the 6/61 list, in that the 6/67 group excludes deaths due to legal inter-vention and operations of war, whereas the 6/61 group includes them.
y. All other external causes (6/67, 5.14)
This group does not appear separately on list 6/61. It includes legal intervention and operations of war, as well as sequelae of external causes.
z. Nutritional deficiencies and nutritional anemias (6/67, 6.02)
This group differs from 6/61 group 6.02 Nutritional defi-ciencies and anemias, which includes anemias that are not nutritional in nature (hemolytic and aplastic, for example).
aa. Chronic lower respiratory diseases (6/67, 6.05)
Table 1. PAHO 6/61 Mortality Tabulation List (ICD-9)
0.00 Symptoms, signs and ill-defined conditions (780-799)
1.00 Communicable diseases (001-139, 320-322, 460-466, 480-487)
1.01 Intestinal infectious diseases (001-009) 1.02 Tuberculosis (010-018)
1.03 Certain diseases preventable by immunization (032, 033, 037, 045, 055)
1.04 Certain vector-borne diseases (020, 060, 062-064, 071, 080-088)
1.05 Septicemia (038)
1.06 Syphilis and other venereal diseases (090-099) 1.07 Meningitis (320-322)
1.08 Acute respiratory infections (460-466, 480-487)
1.09 Other infectious and parasitic diseases (remainder of 001-139)
2.00 Neoplasms (140-239)
2.01 Malignant neoplasm of stomach (151) 2.02 Malignant neoplasm of colon (153)
2.03 Malignant neoplasm of digestive organs and peritoneum, other than stomach and colon (150, 152, 154-159)
2.04 Malignant neoplasm of trachea, bronchus and lung (162) 2.05 Malignant neoplasm of respiratory and intrathoracic organs,
except trachea, bronchus and lung (160, 161, 163-165) 2.06 Malignant neoplasm of female breast (174)
2.07 Malignant neoplasm of uterus (179, 180, 182) 2.08 Malignant neoplasm of prostate (185)
2.09 Malignant neoplasm of bladder and other genitourinary organs (183, 184, 186-189)
2.10 Malignant neoplasm of lymphatic and hematopoietic tissue (200-208)
2.11 Other malignant neoplasms (remainder of 140-208) 2.12 Benign neoplasms, carcinoma in situ and neoplasms of
uncertain behavior and of unspecified nature (210-239)
3.00 Diseases of circulatory system (390-459)
3.01 Acute rheumatic fever and chronic rheumatic heart disease (390-398)
3.02 Hypertensive disease (401-405) 3.03 Ischemic heart disease (410-414)
3.04 Diseases of pulmonary circulation and other forms of heart disease (415-429)
3.05 Cerebrovascular disease (430-438) 3.06 Atherosclerosis (440)
3.07 Other diseases of circulatory system (441-459)
4.00 Certain conditions originating in perinatal period (760-779)
4.01 Maternal conditions affecting fetus or newborn (760) 4.02 Obstetric complications affecting fetus or newborn, and birth
trauma (761-763, 767)
4.03 Slow fetal growth, fetal malnutrition and immaturity (764, 765)
4.04 Hypoxia, birth asphyxia and other respiratory conditions (768-770)
4.05 Hemolytic disease of fetus or newborn (773)
4.06 Other conditions originating in perinatal period (766, 771, 772, 774-779)
5.00 External causes of injury and poisoning (E800-E999)
5.01 Motor vehicle traffic accidents (E810-E-819) 5.02 Other transport accidents (E800-E807, E820-E848) 5.03 Accidental poisoning (E850-E869)
5.04 Misadventures during medical care, abnormal reactions and late complications, and drugs and
medicaments causing adverse effects in therapeutic use (E870-E879, E930-E949)
5.05 Accidental falls (E880-E888)
5.06 Accidents caused by fire and flames (E890-E899) 5.07 Accidental drowning and submersion (E910)
5.08 Accidents caused by machinery, and by cutting and piercing instruments (E919-E920)
5.09 Accidents caused by firearm missile (E922)
5.10 Other accidents, including late effects (E900-E909, E911-E918, E921, E923-E929)
5.11 Suicide and self-inflicted injury (E950-E959)
5.12 Homicide and injury purposely inflicted by other persons, injury due to legal intervention, and injury
resulting from operations of war (E960-E969, E970-E978, E990-E999)
5.13 Injury undetermined whether accidentally or purposely inflicted (E980-E989)
6.00 All other diseases (remainder of 001-779)
6.01 Diabetes mellitus (250)
6.02 Nutritional deficiencies and anemias (260-269, 280-285) 6.03 Mental disorders (290-319)
6.04 Diseases of nervous system, other than meningitis (323-359) 6.05 Chronic and unspecified bronchitis, emphysema and asthma
(490-493)
6.06 Other chronic pulmonary disease, pulmonary diseases due to external agents, and other diseases of respiratory system (494-496, 500-508, 510-519)
6.07 Appendicitis, hernia of abdominal cavity, and intestinal obstruction without mention of hernia
(540-543, 550-553, 560)
6.08 Chronic liver disease and cirrhosis (571)
6.09 Diseases of other parts of digestive system (remainder of 530-579)
6.10 Diseases of urinary system (580-599) 6.11 Hyperplasia of prostate (600)
6.12 Complications of pregnancy, childbirth and the puerperium (630-676)
6.13 Congenital anomalies (740-759) 6.14 Residual (remainder of 001-779)
bb. Remainder of diseases of the respiratory system (6/67, 6.06)
This group is not equivalent to any on the 6/61 list. Jointly with 6/67 groups 6.05 Chronic lower respiratory diseasesand 1.08
Acute respiratory infections, the three groups make up all of ICD-10 Chapter X Diseases of the respiratory system.
cc. Pregnancy, childbirth and the puerperium (6/67, 6.12)
This 6/67 group is not exactly equivalent to 6/61 group 6.12, partly because the 6/67 list places obstetrical tetanus in
group 1.04 Certain diseases preventable by immunization.
As is the case with ICD-9, under ICD-10 several causes of death that may be maternal are excluded from the chapter. These include HIV disease; injury, poisoning and certain other consequences of external causes; and mental and behavioral disorders associated with the puerperium.
dd. Remainder of all other diseases (6/67, 6.14)
Table 2. PAHO 6/67 Mortality Tabulation List (ICD-10)
4.00 Certain conditions originating in the perinatal period (P00- P96)
4.01 Fetus and newborn affected by certain maternal conditions (P00, P04)
4.02 Fetus and newborn affected by obstetric complications, birth trauma (P01-P03, P10-P15)
4.03 Slow fetal growth, fetal malnutrition, short gestation, low birth weight (P05, P07)
4.04 Respiratory disorders specific to the perinatal period (P20-P28) 4.05 Bacterial sepsis of newborn (P36)
4.06 Remainder of certain conditions originating in the perinatal period (rest of P00-P96, i.e. P08, P29, P35, P37-P96)
5.00 External causes (V01-Y89)
5.01 Land transport accidents (V01-V89)
5.02 Other and unspecified transport accidents (V90-V99) 5.03 Falls (W00-W19)
5.04 Accidents caused by firearm discharge (W32-W34) 5.05 Accidental drowning and submersion (W65-W74) 5.06 Accidental threats to breathing (W75-W84) 5.07 Exposure to electric current (W85-W87) 5.08 Exposure to smoke, fire and flames (X00-X09)
5.09 Accidental poisoning by and exposure to noxious substances (X40-X49)
5.10 All other accidents (W20-W31, W35-W64, W88-W99, X10-X39, X50-X59, Y40-Y84)
5.11 Intentional self-harm (suicide) (X60-X84) 5.12 Assault (homicide) (X85-Y09)
5.13 Event of undetermined intent (Y10-Y34) 5.14 All other external causes (Y35-Y36, Y85-Y89)
6.00 All other diseases (D50-D89, E00-E90, F00-F99, G04-G98, H00-H59, H60-H95, J30-J98, K00-K93, L00-L99, M00-M99, N00-N99, O00-O99, Q00-Q99)
6.01 Diabetes mellitus (E10-E14)
6.02 Nutritional deficiencies and nutritional anemia (E40-E64, D50-D53)
6.03 Mental and behavioral disorders (F00-F99)
6.04 Diseases of the nervous system, except meningitis (G04-G99) 6.05 Chronic lower respiratory diseases (J40-J47)
6.06 Remainder of diseases of the respiratory system (rest of J00-J99, i.e. J30-J39, J60-J98)
6.07 Appendicitis, hernia of abdominal cavity and intestinal obstruction (K35-K46, K56)
6.08 Cirrhosis and certain other chronic diseases of liver (K70, K73, K74, K76)
6.09 All other diseases of the digestive system (rest of K00-K93, i.e. K00-K31, K50-K55, K57-K66, K71, K72, K75, K80-K93) 6.10 Diseases of the urinary system (N00-N39)
6.11 Hyperplasia of prostate (N40)
6.12 Pregnancy, childbirth and the puerperium (O00-O99) 6.13 Congenital malformations, deformations and chromosomal
abnormalities (Q00-Q99)
6.14 Remainder of all other diseases (rest of A00-Q99, i.e. D55-D89, E00-E07, E15-E34, E65-E90, H00-H59, H60-H95, L00-L99, M00-M99, N41-N99)
0.00 Symptoms, signs and ill-defined conditions (R00-R99)
1.00 Communicable diseases (A00-B99, G00-G03, J00-J22)
1.01 Intestinal infectious diseases (A00-A09) 1.02 Tuberculosis (A15-A19)
1.03 Certain vector-borne diseases and rabies (A20, A44, A75-A79, A82-A84, A85.2, A90-A98, B50-57)
1.04 Certain diseases preventable by immunization (A33-A37, A80, B05, B06, B16, B17.0, B18.0-B18.1, B26)
1.05 Meningitis (A39, A87, G00-G03) 1.06 Septicemia, except neonatal (A40-A41) 1.07 HIV disease (AIDS) (B20-B24) 1.08 Acute respiratory infections (J00-J22)
1.09 Other infectious and parasitic diseases (remainder of A00-B99, i.e. A21-A32, A38, A42-A43, A46-A74, A81, A85.0-A85.1, A85.8, A86, A88-A89, A99-B04, B07-B15, B17.1-B17.8, B18.2-B19.9, B25, B27-B49, B58-B99)
2.00 Neoplasms (C00-D48)
2.01 Malignant neoplasm of stomach (C16)
2.02 Malignant neoplasm of colon and rectosigmoid junction (C18-C19)
2.03 Malignant neoplasm of digestive organs and peritoneum, except stomach and colon (C15, C17, C20-C26, C48) 2.04 Malignant neoplasm of trachea, bronchus and lung (C33-C34) 2.05 Malignant neoplasm of respiratory and intrathoracic organs,
except trachea, bronchus and lung (C30-C32, C37-C39) 2.06 Malignant neoplasm of female breast (C50 in women) 2.07 Malignant neoplasm of cervix uteri (C53)
2.08 Malignant neoplasm of corpus uteri(C54)
2.09 Malignant neoplasm of uterus, part unspecified (C55) 2.10 Malignant neoplasm of prostate (C61)
2.11 Malignant neoplasm of other genitourinary organs (C51-C52, C56-C57, C60, C62-C68)
2.12 Leukemia (C91-C95)
2.13 Malignant neoplasm of lymphoid, other hematopoietic and related tissue (C81-C90, C96)
2.14 Malignant neoplasm of other and unspecified sites (remainder of C00-C97, i.e. C00-C14, C40-C47, C49, C50 in men, C58, C69-C80, C97)
2.15 Carcinoma in situ, benign neoplasms and neoplasms of uncertain or unknown behavior (D00-D48)
3.00 Diseases of the circulatory system (I00-I99)
3.01 Acute rheumatic fever and chronic rheumatic heart diseases (I00-I09)
3.02 Hypertensive diseases (I10-I15) 3.03 Ischemic heart diseases (I20-I25)
3.04 Pulmonary heart disease, diseases of pulmonary circulation and other forms of heart disease (I26-I45, I47-I49, I51) 3.05 Cardiac arrest (I46)
3.06 Heart failure (I50)
3.07 Cerebrovascular diseases (I60-I69) 3.08 Atherosclerosis (I70)
Rationale for Surveillance
Measles
Introduction: In 1994, the Pan American Sanitary
con-ference established the goal of measles eradication from the Western Hemisphere by the year 2000.
Great progress has been made towards interrupting measles transmission in most countries of the Americas. However, as of September, 1999, with only 15 months remaining until the target date for achieving the goal of hemispheric measles eradication, measles virus continues to circulate in some areas of the Region.
To obtain information that can be used to prevent and control future outbreaks, appropriate investigations and analysis must be conducted for all measles outbreaks. Efforts are needed to determine sources of measles virus introduction, transmission patterns and specific risk fac-tors for acquiring measles.
Surveillance: Measles surveillance is critical for mea-suring progress towards the goal of measles eradication in the Americas and for detecting problem areas. Efforts that are urgently needed to improve the quality of measles surveillance throughout the Region include:
• All suspected measles cases should be investigated within 48 hours of illness onset, and a serum sample should be collected from the patient upon initial contact with the health provider. This sample must be collected within 30 days of rash onset to be considered adequate. • To monitor progress toward the achievement of measles eradication, all countries should provide data on a weekly basis to the Region-wide measles eradica-tion surveillance system (MESS)
• Each country should periodically have its measles sur-veillance system objectively evaluated using the stan-dardized evaluation protocol developed by PAHO. Countries should constantly work to improve the qual-ity of the reporting system.
• Virologic surveillance and molecular epidemiology can provide important information to an eradication pro-gram. Appropriate clinical specimens for viral isolation should be obtained from every chain of measles trans-mission, including all sporadic cases and approxi-mately 5-10 cases from every outbreak. Urine, the most practical specimen to collect for measles virus isola-tion, should be obtained within 7 days of rash onset and forwarded to a reference laboratory capable of per-forming measles virus isolation.
• In all countries, measles and rubella surveillance should be integrated.
Rubella
Introduction: Rubella virus continues to circulate freely in most countries of the region. After a complete investigation, many suspected measles cases are ulti-mately found to be rubella. Moreover, cases of the Con-genital Rubella Syndrome (CRS) have been found in all countries of the Region that have established CRS sur-veillance systems. This suggests that CRS is a major pub-lic health problem in all countries of the Americas.
Surveillance:Rubella surveillance should be integrated with measles surveillance. The purpose of rubella surveil-lance is to detect circulation of rubella virus, not to detect every case of rubella. A separate rubella surveillance sys-tem is not needed. All sera from suspected rubella cases which test negative for rubella IgM antibodies should be tested for measles IgM antibodies and vice versa.
Recommended Case Definitions
The measles eradication and rubella control/elimination programs should use the following standardized case defi-nitions, revised from PAHO’s Measles Eradication Field Guide, 1999, and the WHO Recommended Surveillance Standards from the 2nd. Ed., June 1999, revised by PAHO’s Communicable Diseases Program.
Suspected measles case: any patient in whom a health care provider suspects the possibility of measles.
Suspected rubella case: any patient in whom a health care provider suspects the possibility of rubella.
In suspected measles or rubella cases, a serum sample should be collected from the patient upon initial contact with the health provider. This sample must be collected within 30 days of rash onset to be considered adequate.
Laboratory-confirmed case: a suspected measles or rubella case that after complete investigation is:
1. Confirmed as either measles or rubella using commer-cially available enzyme immunoassays (EIA) for measles or for rubella IgM antibodies, and/or
2. Confirmed by isolation of measles or rubella virus and/or
3. Epidemiologically linked to another laboratory-con-firmed case (the epidemiological link is established if any contact between the suspected case and the labo-ratory-confirmed case has occurred anytime during the month prior to rash onset).
Clinically-confirmed case:a suspected measles or rubella case that is not completely investigated for any reason. This could include: patients that died before the investi-gation was complete, patients lost to follow-up, or patients without adequate specimens submitted for labo-ratory analysis.
Discarded:a suspected measles or rubella case that has been completely investigated, including an adequate blood specimen, which lacks serologic evidence of infec-tion, has no virus isolated, and does not have epidemio-logical link to a laboratory-confirmed case. If laboratory results indicate another viral infection compatible with the clinical symptoms, such as dengue, the case should be discarded as well.
Imported Measles Case: a confirmed measles case in a person who traveled to another country with documented measles circulation during the possible exposure period (7-18 days prior to rash onset). The possibility of local exposure must be ruled out through careful investigation.
Recommended Surveillance Measures
Testing of rubella and dengue suspected cases for measles:
• Blood samples from all rubella suspected cases that are IgM negative for rubella should be tested for measles within 24 hours.
• Blood samples from at least 10% of the dengue sus-pected cases with rash that are IgM negative for dengue should be regularly tested for measles.
• In the case of laboratory–confirmed rubella or dengue out-breaks, the total number of samples that are negative for either rubella or dengue might be overwhelming. In such a case, the surveillance team, in conjunction with the lab-oratory, should decide which samples to test for measles.
Investigation and reporting:
• The reporting system must cover health facilities, pri-vate practitioners, hospitals and laboratories and have at least one reporting source for every geopolitical unit. • Written material should be provided to all health per-sonnel describing their responsibilities and how to report cases, collect samples and send them for labora-tory confirmation.
• Investigation of all suspected cases should take place within 48 hours of rash onset. It should include: • Filling the case report form.
• Investigation of contacts of the suspected case to determine if other cases have occurred.
• taking blood samples and samples for viral isolation (usually urine) from all sporadic cases and from 5-10 cases from each outbreak.
• Weekly reporting of data, even in the absence of cases, is critical.
• Timely feedback to all participants of the surveillance system, keeping them informed of where and when cases are occurring, is essential.
• The reporting system must be monitored monthly using the surveillance indicators.
• Cooperation from the private medical community by reporting suspected cases to the system is essential for all surveillance efforts.
Recommended Minimum Data Elements
Case-based data(to be linked using the unique identifier to specimen-based data for analysis): (I) unique identifier; (II) geographical area (district and province); (III) name; date of birth (IV); date of rash onset (V); date of notification (VI); date of case investigation (VII); date of specimen col-lection (VIII); date when specimens were sent to the labora-tory (IX); number of doses of measles-containing vaccine received (X); (XI) date of last doses of measles-containing vaccine; (XII) if source of infection was identified; (XIII) results of serology; (XIV) results of viral isolation; (XV) final classification and (XVI) name of investigator.Specimen-based data(to be linked to case-based data for analysis): (I) unique identifier (MESS number when available); (II) specimen number; (III) date of rash onset; (IV) date of blood (or urine, nasopharyngeal secretion) specimen collection; (V) date specimen sent to labora-tory; (VI) date specimen received in laboralabora-tory; (VII) results of serology; (VIII) results of viral isolation.
Principal Uses of Data for Decision-Making
• Track measles/rubella virus circulation (in an eradication process, one case must be considered as an outbreak). • Detect and investigate outbreaks to ensure proper case
management and determine reasons for its occurrence. Efforts should be made to determine sources of measles virus introduction, transmission patterns and specific risk factors for acquiring measles.
• Monitor routine coverage for immunizations in all munic-ipalities and focus efforts in high-risk municmunic-ipalities (those where vaccination coverage is lower than 95%) for planning mopping up and other immunization activities. • Identify when next follow-up campaign is due. • Monitor performance of surveillance using standard
indi-cators and strengthen surveillance in low performing areas. • Provide evidence for measles-free certification.
Main Surveillance Indicators
• % of reporting sites that report each week.
• % of reported suspected cases investigated within 48 hours of rash onset.
• % of suspected cases with complete report form. • % of suspected cases with blood specimen collected
within 30 days of rash onset (nonetheless, when out-breaks occur, cases epidemiologically linked to labora-tory-confirmed case are confirmed without needing blood specimens).
Health Statistics from the Americas, 1998 Edi-tion, is the fourth in a series begun in 1991 to complement the quadrennial publication Health Condi-tions in the Americas(now titled Health in the Ameri-cas). This edition is the first to include a section devoted to a special topic—health during early child-hood—which comprises Part I of the book and repre-sents the collaborative efforts of several technical programs, specialized centers, and divisions of PAHO. Part II of the volume contains data on registered mor-tality in specific age groups, by sex and cause of death, by country and year. As in previous editions the book also includes, in Part III, the mortality data received and processed in PAHO, following publication of the 1995 edition. These data are presented by country and year, and by age and sex, using the PAHO 6/61 list of groups of causes of death. The PAHO Special Program for Health Analysis (previously named the Health Situ-ation Analysis Program) had overall responsibility for the technical content of the book, and prepared all the material in Parts II and III as well as several of the chapters included in Part I.
As a contribution to the study of health during early childhood, a new PAHO tabulation list was developed for summary presentation of causes of death among children under 5 years old. This list—called the 8/30 list—was used for the first time in Part II of the book. Mortality data for several age groups immediately fol-lowing early childhood were also included in Part II: 5 to 9 years of age, 10 to 14, and 15-19 years. These data were tabulated using the six broad groups of the PAHO 6/61 list.
Selection of the subject-matter areas included in the special topic was made on the basis of their relatedness to the goals of the World Summit for Children and of
Health for All by the Year 2000; their inclusion in res-olutions of the Governing Bodies of PAHO; their rele-vance to the child health areas that are the purpose of programs in the countries and the Organization; the availability of useful, detailed statistical information that had not been disseminated previously; and the pos-sibility of producing information that is deemed essen-tial for analysis of mortality during early childhood. The chapters included are:Population Dynamics in the Age Group under 5 Years Old; Mortality among Chil-dren under 5 Years Old, by Groups of Causes; and
Selected Health Topics of Importance during Early Childhood. The latter contains the following sub-chap-ters: breast-feeding, nutritional status, prevalent child-hood illnesses, diseases preventable by immunization, cancer, AIDS, andaccidents. It should be pointed out that the chapter on mortality among children under 5 years old by groups of causes includes trends in esti-mated quinquennial death rates for children under 1 year and children 1-4 years of age, by broad groups of causes and by sex and country.
The large number of country-years included—121 data years from 29 countries—not only complements the series published in earlier editions, but once more shows the wide availability of detailed mortality data in the countries of the Americas.
This book represents another step in PAHO’s efforts to bring the full richness of the statistical information about health that is available in the Region of the Amer-icas to the attention of analysts, researchers, and poli-cymakers everywhere.
This book may be purchased through the PAHO/WHO Representative in any country, local sales agents, or directly from PAHO Headquarters, by fax: (301) 206-9789 or e-mail: [email protected]. Direct purchases may be made via the Internet at the PAHO site: http://publications.paho.org.
Publication
Health Statistics from the Americas. 1998 Edition
PAHO. Washington, D.C., 1998, 476 pp., ISBN 92 75 11567 1 Code: SP 567, US $34 / $24 in developing countries.
Also available in Spanish: Estadísticas de salud de las Américas. Edición de 1998.
Washington, D.C.: OPS, 1998.
Epidemiological Calendar 2000
EW Mo Su M T W Th F Sa Mo
1 Jan 2 3 4 5 6 7 8 Jan
2 Jan 9 10 11 12 13 14 15 Jan
3 Jan 16 17 18 19 20 21 22 Jan
4 Jan 23 24 25 26 27 28 29 Jan
5 Jan 30 31 1 2 3 4 5 Feb
6 Feb 6 7 8 9 10 11 12 Feb
7 Feb 13 14 15 16 17 18 19 Feb
8 Feb 20 21 22 23 24 25 26 Feb
9 Feb 27 28 29 1 2 3 4 Mar
10 Mar 5 6 7 8 9 10 11 Mar
11 Mar 12 13 14 15 16 17 18 Mar
12 Mar 19 20 21 22 23 24 25 Mar
13 Mar 26 27 28 29 30 31 1 Apr
14 Apr 2 3 4 5 6 7 8 Apr
15 Apr 9 10 11 12 13 14 15 Apr
16 Apr 16 17 18 19 20 21 22 Apr
17 Apr 23 24 25 26 27 28 29 Apr
18 Apr 30 1 2 3 4 5 6 May
19 May 7 8 9 10 11 12 13 May
20 May 14 15 16 17 18 19 20 May
21 May 21 22 23 24 25 26 27 May
22 May 28 29 30 31 1 2 3 Jun
23 Jun 4 5 6 7 8 9 10 Jun
24 Jun 11 12 13 14 15 16 17 Jun
25 Jun 18 19 20 21 22 23 24 Jun
26 Jun 25 26 27 28 29 30 1 Jul
27 Jul 2 3 4 5 6 7 8 Jul
28 Jul 9 10 11 12 13 14 15 Jul
29 Jul 16 17 18 19 20 21 22 Jul
30 Jul 23 24 25 26 27 28 29 Jul
31 Jul 30 31 1 2 3 4 5 Aug
32 Aug 6 7 8 9 10 11 12 Aug
33 Aug 13 14 15 16 17 18 19 Aug
34 Aug 20 21 22 23 24 25 26 Aug
35 Aug 27 28 29 30 31 1 2 Sep
36 Sep 3 4 5 6 7 8 9 Sep
37 Sep 10 11 12 13 14 15 16 Sep
38 Sep 17 18 19 20 21 22 23 Sep
39 Sep 24 25 26 27 28 29 30 Sep
40 Oct 1 2 3 4 5 6 7 Oct
41 Oct 8 9 10 11 12 13 14 Oct
42 Oct 15 16 17 18 19 20 21 Oct
43 Oct 22 23 24 25 26 27 28 Oct
44 Oct 29 30 31 1 2 3 4 Nov
45 Nov 5 6 7 8 9 10 11 Nov
46 Nov 12 13 14 15 16 17 18 Nov
47 Nov 19 20 21 22 23 24 25 Nov
48 Nov 26 27 28 29 30 1 2 Dec
49 Dec 3 4 5 6 7 8 9 Dec
50 Dec 10 11 12 13 14 15 16 Dec
51 Dec 17 18 19 20 21 22 23 Dec
52 Dec 24 25 26 27 28 29 30 Dec
In order to carry out epidemiological sur-veillance activities, disease outbreaks or epidemiological events must be grouped around a given period of time. Ordinarily, this is a seven-day period known as the epidemiological week. Likewise, the 365 days of the calendar year are divided into epidemiological weeks, known as the epidemiological calendar, which is a standardization tool of the time variable for the purpose of epidemiological sur-veillance.
The importance of these divisions, espe-cially the epidemiological week, is that they provide a means to compare the epi-demiological events occurring in a given year, or period within a year, with those of previous years. Moreover, because the international community has officially adopted this methodology, epidemiologi-cal data can be compared between coun-tries.
The epidemiological week begins on Sunday and ends on Saturday. The first epidemiological week of the year ends on the first Saturday of January, provided that it falls at least four or more days into the month. Therefore, the first epidemio-logical week may actually begin in December of the previous year. To illus-trate this point, the following correspond to the first epidemiological weeks of recent and future years:
1998 January 4 – 10 1999 January 3 – 9 2000 January 2 – 8
2001 December 31 – January 6 2002 December 30 – January 5
total annual pop urban life literate pop with access to gross national national health population physicians hospital birth attended population growth rate population expectancy population (%) services (%), 1996-98, lay* product expenditure as below poverty per beds per by trained
(%) (%) (%) at birth (15 + years old) drinking excretal (US$ per capita) a % of GDP** line (%) 10,000 pop 1,000 pop personnel 1999 1999 1999 1999 1995 water disposal 1997, ppp value 1994 1989-94, lay* c1997 c1995 (%)
Anguilla 8 1.3 11.8 74.3 a 95.4 … … … 17.5 ... 100.0 c
Antigua & Barbuda 67 0.5 36.6 74.3 a 88.5 … … 8,720 5.4 12.0 11.5 ... …
Argentina 36,577 1.2 89.1 73.3 96.2 78.1 84.3 10,100 9.7 25.5 26.8 4.6 97.2 g
Aruba 98 4.5 … 77.2 a 97.0 … … … 12.8 3.7 98.0 a
Bahamas, The 301 1.7 88.1 74.2 98.2 96.4 93.3 10,080 4.2 … 16.3 3.6 99.9 c
Barbados 269 0.4 49.5 76.7 97.4 100.0 99.0 10,220 6.8 … 13.7 7.4 …
Belize 235 2.3 46.5 75.1 70.3 76.0 40.3 4,110 8.0 35.0 7.4 2.5 …
Bermuda 64 0.8 100.0 75.0 a 98.5 … … … 3.5 b … 17.7 ... …
Bolivia 8,142 2.3 63.9 62.2 83.1 73.5 63.5 2,810 6.5 … 3.2 1.1 42.7 a
Brazil 167,988 1.3 80.7 67.2 83.3 90.4 57.9 6,350 6.8 17.4 12.7 3.5 96.8 h
Canada 30,857 1.0 77.0 79.2 99.0 … … 21,750 9.2 c 11.7 22.9 6.7 99.4 c
Cayman Islands 37 3.5 100.0 77.0 a 98.0 … … … 4.1 … 21.5 2.2 99.8 a
Chile 15,019 1.3 84.5 75.2 95.2 91.6 78.4 12,240 7.9 23.2h 13.0 3.1 99.6 c
Colombia 41,564 1.8 74.4 71.0 91.3 76.4 52.2 6,570 7.4 17.7 9.3 1.1 89.2 a
Costa Rica 3,933 2.3 51.4 76.3 94.8 72.2 49.6 6,510 8.5 11.0 15.0 1.6 97.5 a
Cuba 11,160 0.4 77.5 76.0 95.7 92.1 92.0 … … … 56.8 5.5 99.9 a
Dominica 71 0.0 70.7 77.3 a 82.0 … … 4,470 6.3 33.0 4.9 3.6 95.0 a
Dominican Republic 8,364 1.6 64.5 71.1 82.1 71.4 89.5 4,690 5.7 20.6 10.2 1.0 …
Ecuador 12,411 1.9 61.7 69.9 90.1 70.3 58.0 4,700 5.3 35.0 13.2 1.6 70.9 c
El Salvador 6,154 2.0 46.3 69.6 71.5 59.3 68.3 2,860 5.9 48.3 11.8 1.3 58.0 a
French Guiana 174 4.1 77.8 76.4 a 83.0 … … … 13.9 ... …
Grenada 93 0.4 37.5 71.4 a 98.0 … … 4,760 5.2 20.0 8.1 5.5 100.0 a
Guadeloupe 450 1.3 99.6 77.7 90.1 … … … 13.8 ... …
Guatemala 11,090 2.6 40.1 64.6 64.2 67.4 71.9 4,060 3.2 58.0 9.6 0.7 78.4 a
Guyana 855 0.7 37.6 65.1 98.1 91.6 84.7 2,890 5.2 43.0 1.8 3.1 …
Haiti 8,087 1.7 34.3 54.1 45.0 … … 1,260 3.6 d 65.0f 2.5 0.8 …
Honduras 6,316 2.6 46.3 69.8 72.7 81.1 49.4 2,260 5.6 e 50.0 8.3 0.7 63.7 a
Jamaica 2,560 0.9 55.6 75.2 85.0 86.0 89.0 3,330 4.9 34.2 14.0 2.1 …
Martinique 392 0.8 94.6 79.0 92.8 … … … 19.7 ... …
Mexico 97,365 1.5 74.2 72.5 89.6 86.5 72.5 8,110 4.7 c 34.0 15.6 1.2 64.0 c
Montserrat 11 -0.2 18.0 76.0 a 97.0 … … … 1.8 ... …
Netherlands Antilles 215 1.0 70.2 75.8 95.2 … … … 4.8 b … 14.0 ... …
Nicaragua 4,938 2.7 64.2 68.5 65.7 53.0 60.0 1,820 8.6 50.3 6.2 1.2 71.2 c
Panama 2,812 1.6 57.3 74.0 90.8 86.9 93.2 6,890 6.7 0.2 12.1 2.2 89.5 a
Paraguay 5,358 2.5 55.3 70.0 92.1 43.6 41.0 3,860 5.1 21.8 4.9 1.5 84.7 c
Peru 25,230 1.7 72.4 68.9 88.7 78.5 73.7 4,580 3.7 49.0i 10.3 1.8 56.4 h
Puerto Rico 3,839 0.8 74.8 74.2 89.6 … … … 17.5 ... …
Saint Kitts & Nevis 39 -0.7 34.1 67.6 a 97.3 … … 7,730 5.3 15.0 11.7 6.4 …
Saint Lucia 152 1.4 37.7 70.4 a 81.5 … … 5,030 3.8 25.0 5.8 3.3 …
Saint Vincent &
the Grenadines 113 0.7 53.5 73.4 a 96.0 … … 4,320 7.0 17.0 8.8 ... 98.0 a
Suriname 415 0.4 51.6 70.5 93.0 85.0 60.0 2,740 4.0 … 5.0 3.1 95.0 h
Trinidad & Tobago 1,289 0.5 73.6 74.2 97.9 97.0 79.0 6,460 3.4 21.0 7.5 3.8 99.0 c
Turks & Caicos Islands 16 3.5 44.9 75.0 a 98.5 … … … 7.3 ... …
United States of America 276,028 0.8 77.0 77.0 99.5 99.4 99.9 29,080 14.1 c 19.1 27.9 5.2 98.3 g
Uruguay 3,313 0.7 91.1 74.3 96.8 97.8 94.4 9,110 8.5 14.5 37.0 4.5 98.0 c
Venezuela 23,706 1.9 87.1 72.8 93.5 75.9 59.1 8,660 7.5 31.3 24.0 2.0 95.7 c
Virgin Islands (UK) 21 2.6 60.1 72.8 a 98.2 … … … 11.5 ... 100.0 a
Virgin Islands (US) 94 -0.8 46.1 75.0 a … … … 16.5 ... …
(a) 1998 figure (b) 1992-94 figures (c) 1997 figure (d) 1990-94 figures (e) 1991-94 figures (f) 1987 figure (g) 1995 figure (h) 1996 figure * lay: latest available year ** GDP: gross domestic product ... data not available
Source: PAHO, Health Situation in the Americas. Basic Indicators 1999. Special Program for Health Analysis, PAHO/SHA/99.01
Basic Indicators 1999: Selected basic indicators by country: Mortality
maternal infant deaths from mortality mortality rates (100.000 pop) (1990-94, lab*)
mortality mortality ill-defined under- general from communicable from malignant from diseases of the from external (100.000 lb) (1.000 lb) cause registration (%) (all causes) diseases neoplasms circulatory system causes Country rate rate (%) 1990-97 estimated adjusted estimated adjusted estimated adjusted estimated adjusted estimated adjusted
Anguilla – b, m 35.5 b, m 12.5 m ... 771.6 ... 103.6 ... 124.3 ... 370.3 ... 31.1 ...
Antigua & Barbuda … … 13.4 k ... ... ... ... ... ... ... ... ... ... ...
Argentina 38.0 b, m 18.4 b, m 3.5 l 4.1 804.6 706.5 53.1 47.9 157.3 138.2 361.2 302.6 55.6 51.6
Aruba … … 20.4 n – ... ... ... ... ... ... ... ... ... ...
Bahamas, The 63.0 b, m 12.1 b, m 1.4 m ... 546.8 700.2 35.6 47.1 84.6 119.1 144.8 207.8 57.1 59.2
Barbados … 11.8 c, n 2.6 k – 902.6 683.0 46.8 34.1 179.5 138.1 375.8 258.9 40.3 36.6
Belize 142.8 b, m 28.4 c, n 5.1 m 12.3 ... ... ... ... ... ... ... ... ... ...
Bermuda … … … ... ... ... ... ... ... ... ... ... ... ...
Bolivia 390.0 b, j 73.0 b, n … n ... 1,012.6 1,230.2 ... ... ... ... ... ... ... ...
Brazil 44.4 b, l 37.5 b, l 16.2 k 18.4 701.9 921.3 81.7 110.7 93.8 125.1 245.3 334.2 85.4 86.8
Canada 5.5 b, m 5.5 b, m 1.5 k 0.7 698.0 492.9 30.3 20.0 199.4 143.2 275.1 180.4 46.4 39.7
Cayman Islands 19.3 a 9.1 b, n 3.0 n – ... ... ... ... ... ... ... ... ... ...
Chile 22.3 b, m 10.0 b, m 5.3 j 0.9 542.0 602.2 62.6 69.7 118.3 132.7 163.9 184.4 65.3 68.5
Colombia 78.2 b, j 28.0 b, k 6.5 j 24.8 583.6 779.9 44.1 64.1 82.8 122.6 178.8 276.2 151.3 131.5
Costa Rica 15.6 b, n 12.6 b, n 2.1 k – 357.7 507.4 23.9 32.6 75.0 112.9 111.2 173.4 41.5 46.9
Cuba 26.5 b, n 7.1 b, n 0.5 l – 665.9 593.2 46.4 42.9 127.6 114.1 282.7 241.4 79.3 72.3
Dominica .– b, n 14.5 b, n 8.7 n ... ... ... ... ... ... ... ... ... ... ...
Dominican Republic … 33.2 c, n 15.0 f 48.0 544.9 755.6 ... ... ... ... ... ... ... ...
Ecuador 59.6 b, m 29.4 b, m 15.9 k 26.4 614.5 789.9 115.9 144.0 78.3 107.0 141.7 197.6 88.3 85.6
El Salvador 62.6 b, n 35.0 b, n 17.5 i 18.6 629.2 790.1 80.4 106.5 58.0 76.6 141.2 190.2 121.6 125.4
French Guiana … … … ... ... ... ... ... ... ... ... ... ... ...
Grenada .– b, n 19.5 b, n 22.3 n ... ... ... ... ... ... ... ... ... ... ...
Guadeloupe … 8.8 c, n … ... ... ... ... ... ... ... ... ... ... ...
Guatemala 100.8 b, n 35.7 b, n 9.6 n ... 604.9 830.4 ... ... ... ... ... ... ... ...
Guyana … 56.6 c, n 2.7 j ... ... ... ... ... ... ... ... ... ... ...
Haiti 457.0 b, g 66.6 c, n 42.6 n ... 1,114.5 1,427.9 ... ... ... ... ... ... ... ...
Honduras 147.0 b, m 36.0 b, k 58.9 n 52.1 544.9 758.3 ... ... ... ... ... ... ... ...
Jamaica 110.0 b, n 21.6 c, n 5.0 n ... ... ... ... ... ... ... ... ... ... ...
Martinique … 7.0 c, n … ... ... ... ... ... ... ... ... ... ... ...
Mexico 47.0 b, m 23.9 b, m 1.7 k 7.2 511.7 702.9 63.5 83.6 57.1 82.9 111.4 168.7 72.7 79.3
Montserrat … … 4.4 j ... ... ... ... ... ... ... ... ... ... ...
Netherlands Antilles … 3.8 c, n … ... ... ... ... ... ... ... ... ... ... ...
Nicaragua 139.0 b, m 45.2 b, d 4.7 j 47.1 652.8 870.6 148.8 161.9 58.6 93.4 143.5 242.3 88.2 103.7
Panama 60.0 b, m 17.2 b, m 4.5 m 20.0 517.8 649.1 ... ... ... ... ... ... ... ...
Paraguay 101.8 b, m 40.0 b, m 19.1 m 43.7 607.0 854.6 86.6 111.6 75.1 107.6 246.3 379.8 53.9 58.4
Peru 265.0 b, l 43.4 c, n 23.9 m 42.0 676.1 867.8 ... ... ... ... ... ... ... ...
Puerto Rico … 11.8 c, n 0.8 h ... 747.1 625.2 52.3 42.3 123.1 101.1 244.6 191.6 69.2 64.2
Saint Kitts & Nevis … … 2.2 k ... ... ... ... ... ... ... ... ... ... ...
Saint Lucia … … 7.6 k ... ... ... ... ... ... ... ... ... ... ...
Saint Vincent &
the Grenadines .– b, n 17.2 b, n 1.6 n ... ... ... ... ... ... ... ... ... ... ...
Suriname 31.9 b, l 16.4 b, l 14.8 h ... 494.7 649.6 62.9 76.1 63.8 88.7 173.1 254.9 55.9 60.1
Trinidad & Tobago 38.9 b, l 16.2 b, l 2.1 j – 696.9 800.7 42.0 47.4 92.2 106.8 ... 318.9 ... 55.3
Turks & Caicos Islands … … 8.8 k ... 489.0 579.0 46.6 53.0 29.9 50.5 179.6 218.0 56.6 62.2
United States
of America 8.4 b, m 7.3 b, m 1.1 l 2.8 851.6 584.8 44.1 28.5 206.2 142.5 363.5 228.5 57.6 50.8
Uruguay 29.3 b, m 17.7 b, n 6.5 m 2.3 1,000.9 724.9 ... ... ... ... ... ... ... ...
Venezuela 59.6 b, m 21.4 b, m 1.5 j 2.4 465.2 670.7 57.1 71.6 63.8 103.9 147.8 257.6 70.8 73.6
Virgin Islands (UK) .– b, n 10.8 b, n 2.3 n ... ... 1,072.3 ... 62.6 ... 213.7 ... 430.3 ... 91.1
Virgin Islands (US) … .e, b, m … m ... ... ... ... ... ... ... ... ... ... ...
(a) 1989-1998 pooled figure (d) 1989-1998 averaged rate (f) 1985 registered figure(i) 1993 registered figure(l) 1996 registered figure
(b) country-estimated or registered rate (e) 26 infant deaths (rates not calculated (g) 1991 registered figure (j) 1994 registered figure (m) 1997 registered figure (c) UN estimated rate it fewer than 30 events registered) (h) 1992 registered figure (k) 1995 registered figure (n) 1998 registered figure
* lab: latest available biennium - magnitude zero ... data not available
PAHO’s Epidemiological Bulletin is published quarterly in English and Spanish.
Catalogued and indexed by the United States National Library of Medicine.
Printed on acid-free paper. PAN AMERICAN HEALTH ORGANIZATION
Pan American Sanitary Bureau, Regional Office of the
WORLD HEALTH ORGANIZATION
525 Twenty-third Street, N.W.
Washington, DC 20037
Internet: http://www.paho.org/english/sha/beindexe.htm
For the fifth consecutive year, a cooperative effort has produced the brochure Basic Indicators, as part of the PAHO Core Health Data Initiative. This initiative aims to increase the capability of Member States to collect and ana-lyze health information that, while showing who benefits and where the gains in health are to be found, highlights dis-parities in health that may be inequalities and identifies the results of interventions aimed at their reduction.
Previous versions of this brochure have circulated widely in the Americas and have become a major refer-ence on health indicators for health ministries, universi-ties, research centers, and nongovernmental and international organizations. A growing number of coun-tries is producing and disseminating their brochures of Basic Indicators, with data disaggregated at the subna-tional level, which is a major contribution to the analysis of their health situation and to public health surveillance.
The 1999 edition contains quantitative information of a set of indicators that is divided into two sections. The first is descriptive, and contains 58 indicators grouped into five categories, namely: demographic; socio-economic; mor-tality; morbidity; and resources, access, and coverage. The second section is analytical, and shows secular trends for 38 of the indicators, aggregated at the subregional level.
The material presented herein was produced under the technical coordination of the Special Program for Health Analysis (SHA), using the information provided by the national health authorities to the PAHO regional programs and the PAHO/WHO Country Offices, as well as from other international specialized agencies. Selection of the indicators is part of an ongoing consultative process; the term "basic" refers to their essential nature for character-izing the health situation and to their strategic importance for planning collective actions for improving health. The sources of data are in the public domain and have been selected carefully, adhering to the principle of compara-bility.
For more information contact:
Dr. Carlos Castillo-Salgado, Chief
Special Program for Health Analysis, SHA Pan American Health Organization 525 Twenty-third St. N.W.
Washington, DC 20037; U.S.A.
Health Situation in the Americas: Basic Indicators 1999
(PAHO/SHA/99.01).
Bilingual edition: spanish-english. Free distribution
Figure 4: Estimated infant mortality rates Latin America, Caribbean and Argentina, 1960–2000
Source: Technical Information System. PAHO / SHA
Figure 5:Mortality in children younger than 1 year, by broad groups of causes, in countries grouped according GNP. 1980–1984,
1985–1989 and 1990–1994
Note: *Rate per 100,000 children under 1 year old. Source: PAHO. Health in the Americas. 1998, Vol. 1.
GRUPO III Chile
Figure 8:Inequalities in life expectancy, Region of the Americas, summary distribution of frequencies, 1994
Source: Basic Indicators 1996. Health Situation in the Americas.
Figure 6: Highest 20% / lowest 20% income ratio by countries, Region of the Americas, 1993–1996*
Note: *Latest available year