19
02
- 200
2
Pan American Health Organization:
Vol. 22, No. 3
September 2001
IN THIS ISSUE...
Intentional Use of Biological and Chemical Agents:
Risks and Recommendations
The terrorist acts of 11 September 2001 in the United States have generated a sense of vulnerability that is now being enhanced by the widespread concern of bioterrorist attacks. The discovery of several cases of anthrax in the United States, and additional malicious attempts to spread the bac-teria by mail have made this threat very real. This is an oppor-tunity for countries to detect, investigate and respond to the occurrence of potentially epidemic diseases.
Background
Putting aside the use of chemical weapons in war situa-tions around the world since the beginning of the 20th centu-ry, only three incidents involving biological or chemical at-tacks have been documented in the last 16 years. The first one was a deliberate salmonella poisoning in Oregon (United States) in 1984, which resulted in thousands of sick people but no death. The other two involved the use of sarin gas in Japan in 1994 and 1995, and resulted in fewer than 20 casual-ties.1 While there have not been large-scale terrorist attacks
with biological agents in the past, the recent events have highlighted the need for local public health surveillance sys-tems to be ready to identify, confirm and intervene in acute communicable disease outbreaks. This need is enhanced by dramatic increases in the volume and speed of travel and commerce that further complicates infection control efforts by creating new scenarios for the international spread of in-fectious diseases. In effect, any local outbreak is considered a threat to all nations. Also, advances in biotechnology in-crease concern for bioterrorism relating to the possible mis-use of genetic research for the development of more potent biological weapons and the spread of new infectious diseases. However, as public awareness of the threat of chemical and biological terrorism grows, it is important to consider that the actual risk of these forms of terrorism remains small. The reason this risk remains low is the inherent technical limitations involved in acquiring, producing and turning ical and biological agents into viable weapons. Firstly, chem-ical and biologchem-ical agents are difficult to come by. Their ac-quisition and transport are often complicated and require spe-cial equipment. Biological agents, because they are living organisms, require certain handling conditions to survive and
be effective agents of disease. Security procedures to curtail access to these agents differ from country to country. Al-though some strains of dangerous microbes such as Bacil-lus anthracis (anthrax) can be found in natural sources (in-fected cattle, sheep and camels), it would take great effort to weaponize this agent.
Secondly, there are extreme obstacles to disseminating biological and chemical agents to specific targets. Biological agents must be kept alive and potent and both types of agents must be delivered in quantities sufficient to cause illness. Large quantities of agents would be needed to effectively contaminate drinking water or food and cause disease in many people. Large scale effects might be more efficiently achieved if the agent was delivered in the form of water or aerosol cloud that would then be inhaled by its victims. How-ever, many variables, such as the equipment used and weath-er conditions could effect the outcome of such a strategy.2
For all the above-mentioned limitations, the risk of bio-logical and chemical terrorism remains low. However, the pub-lic needs to be educated about the possibilities of this type of warfare, and public health systems must be prepared to identify and contain such outbreaks. Some situations have been defined by the United States military as “epidemiologi-cal clues” for the intentional use of biologi“epidemiologi-cal agents, which when seen together can help in determining if further inves-tigation is needed. These include: more severe disease than expected for a given pathogen, as well as unusual routes of exposure, such as a preponderance of inhalational disease; a disease that is unusual for a given geographic area, that is found outside the normal transmission season, or that is im-possible to transmit naturally in the absence of the normal vector for transmission; and unusual strains or variants of organisms or antimicrobial resistance patterns disparate from those circulating.3
Biological and chemical agents
Several microorganisms have been identified as serious enough threats to warrant preparation by the public health system: B. anthracis (anthrax), variola virus (smallpox), Yers-inia pestis (plague), Clostridium botulinum (botulism),
Fran-• Intentional Use of Biological and Chemical Agents: Risks and Recommendations
• Health Analysis:
- SIGEpi: Geographic Information System in Ep-idemiology and Public Health
- Influenza: Basic Epidemiological Aspects for the Development of Vaccines
- Diphtheria Outbreak in Cali, Colombia, August-October 2000
ciscella tularensis (tularemia) and hemorrhagic fever virus-es.4 Chemical agents include mustard and sarin gas.
There has not been any case of smallpox in the Ameri-cas since its eradication from the Region in 1971. Some of the diseases mentioned above occur in endemic form in the Re-gion. The natural form of anthrax is relatively frequent in South America and is present in cattle in the United States and Canada. Countries that report plague in the Region in-clude Brazil, Peru, Bolivia and the United States.5 It is known that Tularemia occurs throughout much of North America (every state in the United States has reported human cases although most cases occur in the South Central and Western states.)6 Finally, the botulinum toxin can be found worldwide.7 Points regarding anthrax8
Anthrax does not spread from person to person, but can be made into a powder that can, with relative ease, be made into a form that is easily dispersed. It requires that cases be detected as early and as quickly as possible; emergency room personnel must be trained and alert. The public health sys-tem must be strengthened and include knowledgeable staff in infectious diseases, in more or less the same way as re-quired for emerging infectious diseases. A network of labo-ratories is necessary to identify the infectious agent.
Currently, a good anthrax vaccine is not available. The United States of America has stepped up its research on new anthrax vaccines. Now the best response to exposure is pro-phylaxis with antibiotics for 60 days after exposure. Anthrax is greatly sensitive to a wide array of antibiotics other than ciprofloxacine. Penicillin and doxycycline are recommended. Points regarding smallpox8
Currently, large populations have no immunity to small-pox; the number of individuals susceptible to the infection is larger than ever, given that immunization stopped over a quar-ter of a century ago, and very few people may have natural immunity. Although smallpox is more difficult to release, if it were released, its hazard potential would be much higher than that of anthrax. Smallpox would become an immediate inter-national problem. Countries which in the past had the capac-ity to produce smallpox vaccine can no longer do so, and regaining that capacity would require training and revision of production procedures. An international initiative is nec-essary to re-establish capacity for smallpox vaccine produc-tion if it were needed.
The United States has decided to restart the production of smallpox vaccine. The strain to be used is the traditional one, i.e., the New York Board of Health strain. Two or maybe three sites will produce the vaccine. See Box 1 for sources of information on the other agents mentioned above.
The Pan American Health Organization (PAHO)’s response
Following the terrorist acts of 11 September, PAHO re-ceived numerous inquiries from the Organization’s Member States about the response that countries should prepare for in case additional events of this nature should occur. In re-sponse to these concerns, PAHO’s Director, Dr. George A.O. Alleyne, convened a consultation meeting of experts on
bio-terrorism from the Region of the Americas. The purpose of the consultation was to examine current and future challeng-es and opportunitichalleng-es facing PAHO and to provide recom-mendations for the Organization’s technical cooperation in regard to prevention, control and response to threats or acts of bioterrorism. This meeting took place at PAHO Headquar-ters on 24 October 2001. The themes discussed during the meeting generated the following conclusions and recommen-dations.8
Conclusions
− Preparedness for the threat of natural and man-made di-sasters and the surveillance of emerging and reemerging infectious diseases provides some guidelines on how to deal with bioterrorism. Part of the role of the public health system of any country is to be prepared for mass casual-ties of any cause and kind. In particular, containment of the source of contamination should be managed by the disas-ter preparedness structure in each country.
− It is the health sector at the local level (hospitals, emergen-cy personnel) that must deal with consequences of a biot-errorist attack. Indeed, it is possible that biological damag-es will not be apparent until the affected population seeks emergency room services due to sickness. First respon-dents in these cases will be hospitals, especially emergen-cy health care personnel. Therefore, the health sector must be included early in the planning for these situations. Al-though the hospital capacity may be a concern in a bioter-rorism situation, emergency plans in some countries in-clude procedures to make beds available during emergencies.
− Epidemics, of known or unknown etiology, often induce panic and cause damage beyond the disease itself. In 1994, an outbreak of plague in India led to hundreds of thou-sands of people fleeing the city of Surat. Other conse-quences included embargoed flights to and from India, and restrictions on importation of Indian goods.9 Therefore,
public information is a key part of the response to emer-gency situations and governments must provide complete and accurate information to prevent panic and maintain viable and effective public health surveillance networks.
Recommendations
Two sets of recommendations were issued by the PAHO consultation group. The first addressed national prepared-ness and the second, PAHO’s technical cooperation.
Regarding national preparedness, recommendations deal with general preparedness, public health surveillance, and laboratory capacity:
General
− The threat of bioterrorism should be included in every country’s plan and structure to deal with disasters. These plans should be multisectoral and supported by training of all sectors and desktop simulation exercises.
− These plans should cover detection, diagnosis and re-sponse.
− Plans should include an inventory of the human and physical resources available.
accurate information relevant to the protection of public health.
− Countries should share information on results of epide-miological investigations and cooperate with each other in response to events.
− Countries should have expert commissions on bioterror-ism by creating new ones or preferably by using and expanding existing disaster preparedness bodies. Surveillance
− Countries should take steps to enhance their ability to detect, identify, investigate and respond rapidly to re-ports of emerging infectious diseases. This may include the establishment of rapid response teams.
− Health care providers should receive training in diagno-sis and reporting of clinical presentations condiagno-sistent with man made epidemics, beginning with emergency room personnel, followed by primary health care staff.
− There should be specific written procedures for the safe handling and transportation of infectious disease mate-rials.
− Treatment guidelines should be available to address the biological agents discussed.
Laboratory capacity
− Laboratory networks should be improved for the diag-nosis of potential agents used in bioterrorism.
− Laboratory biosecurity should be strengthened to pre-vent theft, misuse, contamination or improper handling of these agents.
− There should be national and international quality con-trol of laboratory diagnosis.
− Laboratory personnel should be trained in the
recogni-References
(1) Geiger H. Terrorism, Biological Weapons, and Bonanzas: Assess-ing the Real Threat to Public Health. Am J Public Health. 2001;91:708-709
(2) WHO. Health Aspects of Biological and Chemical Weapons. (Un-official Draft). Geneva. August 2001
(3) Pavlin A. Epidemiology of Bioterrorism. Emerging Infectious Diseases. 1999;15:4.
(4) MMWR, 21 April 2000/49(RR04), 1-4
(5) CDC Plague Home Page. Available at: http://www.cdc.gov/nci-dod/dvbid/plague/index.htm. October 2001.
(6) Dennis D et al. Tularemia as a Biological Weapon. JAMA
2001;285:21:2763-2773
(7) Arnon et al. Botulinum Toxin as a Biological Weapon. JAMA
2001;285:8:1059-1070
(8) PAHO. Report of the Consultation Meeting on Bioterrorism. Washington, DC. 24 October 2001
(9) Tucker J. Historical Trends Related to Bioterrorism: An empiri-cal Analysis. Emerging Infectious Diseases. 1999;15:4.
Source: Prepared by Ms. Anne Roca, Mr. Byron Crape, Ms. Genevieve Chase, Dr. Enrique Loyola and Dr. Carlos Castillo-Salgado of PAHO’s Special Program for Health Analysis (SHA).
tion of findings suggestive of bioterrorism agents.
− Transfer of infectious samples among laboratories should be done according to established guidelines and confirmed by sending and receiving institutions.
PAHO’s technical cooperation PAHO should:
− Provide authoritative, current information to countries on events related to bioterrorism, which could be used in the preparation of national plans.
− Make recommendations for prophylaxis and treatment of anthrax.
− Together with countries of the Region, explore the po-tential for production of smallpox vaccine, to include up-date of good manufacturing practices (GMP) for produc-tion.
− Support countries in the development of national plans to address bioterrorism.
− Provide training to countries in the surveillance, labora-tory and information aspects related to the response to agents used in bioterrorism.
− Identify reference laboratories for confirmation, training, and provision of reagents.
− Promote the development of rapid diagnostic tests and availability of diagnostic reagents for anthrax and other potential agents of bioterrorism.
− Support quality control and proficiency testing in the laboratory for diagnosis of agents of bioterrorism, in-cluding the provision of an inventory of reagents avail-able for this purpose.
− Support cooperation among countries, including through subregional networks.
− Coordinate rapid response to support countries to deal with bioterrorism.
Health aspects of biological and chemical weapons (World Health Organization):http://www.who.int/emc/pdfs/
BIOWEAPONS_FULL_TEXT2.pdf
The Public Health Response to Biological and Chemical Terrorism (CDC): http://www.bt.cdc.gov
Guidelines for the Anthrax, Botulism, Smallpox and Plague: Hopkins Antibiotic Guide (Johns Hopkins University Center for Civilian Bio-defense studies): http://www.hopkins-biodefense.org
The Global electronic reporting system for outbreaks of emerging infectious diseases and toxins: http://www.promedmail.org
Assessing the Health Consequences of Major Chemical Accidents: Epidemiological Approaches (WHO): http://www.who.int/disasters/ tg.cfm?doctypeID=19
INTOX Databank on toxic agent (International Programme on Chemical Safety (IPCS): http://www.who.int/pcs.index.htm
Responding to the deliberate use of biological agents and chemicals as weapons (World Health Organization): http://www.who.int/emc/ deliberate_epi.html
Frequently-asked questions on bioterrorism and chemical terrorism (World Health Organization): http://www.who.int/emc/questions.htm Box 1: Selected Sources of Information on Biological and
SIGEpi: Geographic Information System
in Epidemiology and Public Health
Introduction
Since 1995, in response to the health services needs of the countries of the Americas, the Special Program for Health Analysis (SHA) of the Pan American Health Organization (PAHO) developed a technical cooperation project, the pur-pose of which is the dissemination and use of Geographic Information Systems (GIS) as a tool for analysis and problem-solving in epidemiology and public health1(SIG-SP for its
Spanish name).
Generating a series of activities, this project promotes development of low-cost computer systems, among them the software package SIGEpi. The SIGEpi package offers simpli-fied tools and interfaces to efficiently carry out biostatistical and geographical analysis to support decision-making in public health.
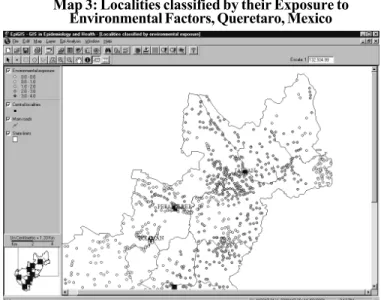
Background information is presented here on the devel-opment of SIGEpi, its characteristics and general functions, as well as an example of how its analytical tools can be used. In this article, SIGEpi is applied to identify populations ex-posed to environmental risks in Mexico.
Background
Resulting from meetings, seminars, consultation work-shops and requests made directly to the SIG-SP Project, some of the most common problems in the use of GIS in public health were defined as: high costs of commercial GIS soft-ware packages, making them inaccessible to the majority of users; insufficiency of epidemiological and public health anal-ysis tools in GIS; and lack of integration between statistical and epidemiological programs and GIS.
To address such limitations, development componentsa from commercial programs were taken advantage of, particu-larly those handling cartographic data which allow the user to create products that can be distributed at a low cost and respond to the specifications and requirements proposed in the Project. With this consideration, SIGEpi was built based on ESRI’s2 MapObjectsTM.
SIGEpi’s Beta version is currently used as an analytical tool for the surveillance and control of malaria in Brazil, and in a project to prevent the reintroduction of DDT for malaria control in Mexico and Central America.
Principal characteristics of SIGEpi
Developed for personal computers (PC) on the Windows platform, SIGEpi was designed following the conceptual ele-ments and general systemic framework of the PAHO GIS3 proposal.
SIGEpi’s graphic interface permits the management of multiple types of programs (from this point on they will be referred to as documents), each in independent windows.
Typical documents consist of: Projects, Maps, Tables, Graphs, Results, and Presentations; each with its own functions, menus, buttons, and tools (see Figure 1).
Project controls all other documents and forms of data pre-sentation, and guarantees that the current work session can be recovered in future sessions in the same state as was saved.
Data presentation and visualization are rendered through maps, tables and graphs. A dynamic link is maintained be-tween them, allowing for simultaneous queries among the table, map, and graph registries. The Map document is the central document in a GIS, allowing the incorporation, manip-ulation, classification and visualization of cartographic data. The Tables document enables the presentation and handling of the databases’ cartographic layers and attributes, while the Graph document shows alternate representations of the map layers attribute data.
The “Results” section, visualizes in HTML format the results from processing and statistical analysis of data, ducing data that can be managed in a word processor pro-gram or published on the Internet. The “Presentations” sec-tion prepares documents for high quality printing.
Functionality of SIGEpi
From a data management standpoint, SIGEpi follows an open approach and does not require the establishment of an a priori structure. This approach offers greater versatility in a framework where the user decides on the type of applica-tion and data necessary for its development, allowing the user to take advantage of data existing in other information systems.
Management of the digital maps is based on the vector model. It has the capacity to read and process files in Shape-file and ArcInfo coverage formats from ESRI; other formats include Vector Product Format (VPF) (.pft, .lat, .aft, .tft); CAD (.dwg, .dxf) and EpiMap (.bnd).
Figure 1: SIGEpi Interface
a Component: a block of programs that brings together a set of
The SIGEpi system also can integrate different image formats and display them as a background image for a map. In addition, SIGEpi’s database management system handles MS Access’97 (.mdb) databases as the native format, and allows for the importing/exporting of data tables from other popular formats such as Excel, Dbase, Btrieve, EpiInfo, ASCII delimited text, etc. Database tables can be linked through an index to cartographic bases and overlaid on a map. Other operations and calculations also can be carried out for epide-miological analysis.
The design and selection of analytical procedures in SIGE-pi are the product of a systematic and shared effort with the project’s collaborating groups, and other professionals and experts in public health. Following are the principal process-ing and analytical functions, accordprocess-ing to their areas of ap-plication, offered by SIGEpi.
a. Basic functions and spatial data processing (geo-pro-cessing)
Data management and processing functions are: inte-gration of attributes from data tables with digital cartograph-ic bases (layers of spatial data), for visualization on a map through the superposition of multiple data layers; selection and querying of spatial data to generate new layers based on attributes and spatial operations between layers; geo-refer-encing or plotting points on a map from data tables with x, y coordinates; geo-processing operations such as the creation of catchment areas (“buffers’’) to delineate areas of impact or influence, and production of radial schemes (spider-dia-grams) to measure linear distances between origin and desti-nation.
Another essential function of SIGEpi is the creation of thematic maps, such as unique value or dot-density maps, bar and pie graphs, and intervals or ranges calculated with different classification methods.
b. Quantitative methods in Epidemiology
The functions include measures for quantitative analy-sis in epidemiology, which are particularly useful in explor-atory data analysis. Among them are: descriptive statistics
to calculate the set of measures of central tendency and scat-ter and prepare frequency distributions; correlation analy-sis; and both simple and multiple linear regression. Some functions for the calculation of rates, ratios, and proportions are included, as well as adjustment using direct and indirect methods4 and spatial smoothing5.
c. Useful methods for Public Health Practice
Some methods useful in analysis and decision-making processes in Public Health have been incorporated in SIGE-pi. These include: identification of critical and priority areas; construction of a composite health index —such as basic unmet health needs or poverty - or identification and detec-tion of spatial and time-space clusters6; measurement of the association between environmental exposure factors and health events for case-control or cohort epidemiological stud-ies7; and evaluation methods for access to health services (based on the radial schemes technique), such as a simple measure of accessibility using linear origin-destination dis-tances. An example of the use of SIGEpi in the area of envi-ronmental health is presented below.
Problem under study
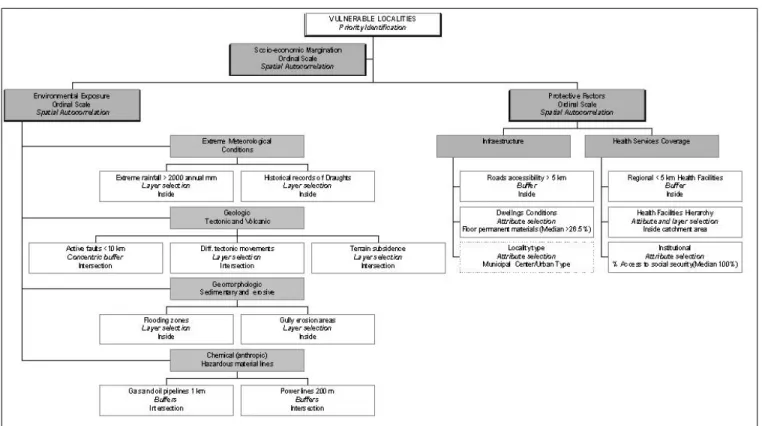
In various areas of Central Mexico, in the state of Queréta-ro in particular, a gQueréta-roup of localities with high levels of mar-ginalization1 can be found. They are potentially vulnerable to the influence of extreme environmental risks or events de-rived from land dynamics of the region. These risks fall into several categories, depending on their origin2: 1) Hydromete-orological risks: disasters derived from severe droughts or high levels of rainfall; 2) Geological risks: proximity to active fault lines, with regard to differential tectonic movements, or terrain subsidence; 3) Geomorphologic risks: Dynamics of different relief types, some prone to erosion and in others, flooding and sedimentation; 4) Chemical risks, resulting from human activity: proximity to electric lines or pipelines trans-ferring hazardous materials, such as gas or oil.
Use of SIGEpi for the Identification of Localities Vulnerable to
Environmental Risks in Mexico
The vulnerability of a locality to environmental risks is understood as the occurrence of emergencies or demands that exceed the capacity of the health sector to respond.3 Lack of resources or distance to infrastructure and services increase the problem. Indeed, a large number of communities do not have health care centers in close proximity, are far from principal transportation routes, and lack sufficient re-sources in case of environmental disaster, the latter due to the precarious and temporary nature of the materials used to build their dwellings.
In order to enhance the measurement of vulnerability, a five-level socioeconomic “marginalization” index officially used in Mexico, was adopted as a synthetic measure. This index was constructed using the method of principal
compo-Source: Prepared by Eng. Ramon Martinez, Mr. Manuel Vidaurre, Geog. Patricia Najera, Dr. Enrique Loyola, Dr. Carlos Castillo-Salgado and Mr. Charles Eisner from PAHO’s Special Program for Health Analysis (SHA).
References
(1) PAHO. PAHO Technical Cooperation in Geographic
Information Systems Applied to Epidemiology (GIS-Epi) in the Americas. Epidemiological Bulletin. 1996; 17(2):8-10. (2) ESRI. http://www.esri.com.
(3) PAHO/Special Program for Health Analysis. Geographic Information System in Health. Basic Concepts. Washington, DC.: PAHO, 2000: 92.
(4) Fleiss JL. Statistical Methods for Rates and Proportions. 2nd ed, New York John Wiley, 1981.
(5) Kafadar K. Smoothing Geographical Data, Particular Rates of Disease. Statistics in Medicine 1996; 15(23):2539-60. (6) Pike MC, Smith PG. Diseases clustering: a generalization of
Knox’s approach to the detection of space time clustering. Biometrics 1968; 24: 541-556.
Figure 1: Conceptual and Operational Framework for the Identification of Vulnerable Localities: Application of Consultation, Selection and Spatial Analysis Tools in SIGEpi
nents, and is used to differentiate states, municipalities and localities according to the global impact of deficiencies in access to elementary education, conditions and size of the dwellings, population distribution and an income insufficient to acquire the basic basket of food4.
The magnitude and distribution of vulnerability in cen-tral Mexico is partially known in different sectors of the pub-lic administration. However, given the diversity of informa-tion sources and the lack of adequate methodological tools, it is difficult to prepare a comprehensive diagnosis including environmental, social and economic data. The data associat-ed with the health system’s response capacity are particular-ly difficult to include in the diagnosis.
As a first approach to the problem of identifying, quan-tifying and locating areas exposed to environmental risks in the state of Querétaro, an application was developed using geo-processing and statistical/spatial analysis tools avail-able in SIGEpi. Production took into account marginalization, access to protective factors, and the presence of environ-mental risks, and was carried out under the operational model shown in Figure 1. It is important to point out that this frame-work was the basis for the construction of criteria, classifica-tion of variables and analysis of its relaclassifica-tions.
Methods
1. Sources of Information
Various layers of digital cartographic information and attributes were compiled from different sources. They were incorporated into the project by their geometric characteris-tics: point files (localities5, with or without health services);
lines (roads, pipelines6) and polygons (municipalities7, layers of environmental risks8,9). Environmental risks were defined in relation to the criteria established by the agencies that provided the information.
Base maps were prepared previously using the Univer-sal Transverse Mercator projection (UTM), zone 14Q, where the state of Querétaro is located, in order to carry out the measurements of areas and distances with greater precisionb. To simplify geo-processing and structuring of the attribute table and data analysis, two separate layers were formed us-ing information on localities in each state: those considered as headquarters for public health services and the remaining localities without public health services. There are a total of 2,112 localities of different sizes in the 18 municipalities of the State of Querétaro, but 28.3% are communities with two dwell-ings or less, for which no population nor socioeconomic in-formation exists. For purposes of this study, these were elim-inated from the analysis.
2. SIGEpi tools used for processing and analysis Creation of point layers
Through this procedure, the geo-referencing of the clin-ics and hospitals not belonging to the Ministry of Health of the State of Querétaro10 (SESEQ) was carried out, based on the geographical coordinates of the headquarter locali-ties11,12,13. These health service units were added to the ser-vices of the SESEQ in a single layer in order to cover all public health services available in the state of Querétaro.
b The projection module has not been incorporated in the Beta
Creation of areas of influence
Influence areas were set up to identify catchment area reach of two types of phenomena: 1) impact areas of environ-mental risks, such as fault lines, or those of electric lines (200 m) or gas/oil pipelines (one km), and 2) an area 5 km from both health centers and transportation routes available all year, according to PAHO’s definition.14
Access to services (radial schemes)
With this tool, the shortest linear distance was drawn between a central point (health centers), and satellite or pe-ripheral localities.
Selection by attributes and by layers
These techniques were applied to place localities in rela-tion to environmental risks, or influenced by the protecrela-tion of services and infrastructure. Through this process and geoprocessing, environmental risk zones were geographical-ly delimited.
Criteria used to select localities with protective factors included the following conditionsc: percentage of the popu-lation with social security (median value was 0%); dwellings with some floor covering (the median value was 26.5%) and level of urbanization (more than 10,000 inhabitants). Also, they had to fulfill some categorical value, such as whether they were a municipal government center or not.
In the same way, a selection by layers identified locali-ties within areas of influence or risk, or localilocali-ties intersecting areas near electric lines or fuel ducts. Once identified, dichot-omous values (0,1) were assigned to those localities meeting the conditions established within the operational framework. Frequency distribution and exploratory data analysis
Exploratory data analysis was carried out for the vari-ables under analysis. Median values were calculated in or-der to establish cut-off values for the selection of critical localities.
Identification of critical areas (critical localities)
Localities were classified depending on an expected (cut-off) value. The dichotomous score assigned to the communi-ties was added in order to generate an ordinal scale, ranging from 0 to 4, depending on the number of exposure factors.
A similar process was followed for protective factors, with criteria such as the proportion of dwellings built with permanent materials, proximity to roads, or social security coverage; other criteria included the availability of health services located within 5 km and classified by levels of care: hospitals, clinics, and health centers.
Subsequently, we selected localities of greater vulnera-bility that fulfilled all conditions at the same time, i.e., expo-sure to risk factors, lowest level of protective factors and greatest marginalization (based on the original official classi-fication).
Spatial autocorrelation
This method is used to determine if an indicator’s value shows a tendency to form geographical clusters or if its
dis-Map 1: Environmental Risk Zones in the State of Queretaro, Mexico
tribution is random. Moran’s global autocorrelation index (I) is calculated for a global test to determine the existence of significant clusters in the distribution of data without indi-cating where it is located.15 With the local test, it is possible to identify the location of the clusters.
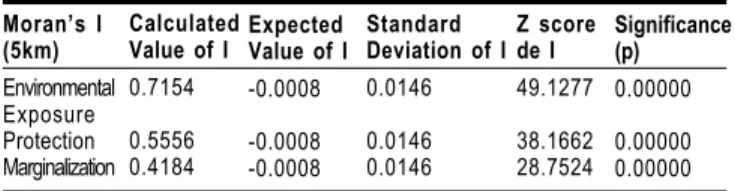
For this particular study, Moran’s global I was calculat-ed for the following variables: exposure to environmental fac-tors, access to protective facfac-tors, and marginalization, using a radius of 5 km as criterion for vicinity.
Results
The limit, extent, and overlap of environmental risk areas are shown in Map 1. Nine municipalities were found with historical records of drought, the majority located in the Sier-ra Gorda (Northeast of the state). Small areas with reports of extreme rains and floods were found in the Southern and Northeastern end of the state. Active faults concentrations also were detected in the area of the Sierra Gorda (NE) and in the Neovolcanic Axis range located in the Southwestern ex-treme of the State. Geological risk zones (areas of subsidence
Map 2: Protective factors and Relation of localities with health services, Queretaro, Mexico
c The cutting points correspond to the median values for each
and tectonic movements) also were found to the Southwest of the state. Furthermore, areas of environmental changes due to human activity were identified, such as areas close to high-voltage lines or pipelines of hazardous materials (gas and oil) in the zone known as the industrial corridor of San Juan del Río – Querétaro.
In contrast, the distribution of protective factors, as seen in Map 2, includes both areas with roads and health care units, classified by health care capacity (hospitals, clinics and health care centers). These catchment areas are delineat-ed within a distance of 5 km, equivalent to a hour-long walk on flat terrain. In addition, parts of the state not covered by this infrastructure are shown. The distances between locali-ties and health centers greater than 5km are highlighted by the radial schemes.
Among the 1,447 communities with socioeconomic in-formation, 172 have health units with different levels of ca-pacity - hospitals, clinics, and health centers - and 1,275 do not, the latter having an average population of 254 inhabit-ants (range from 5 to 3,392 inhabitinhabit-ants).
Of the 1,275 localities under study (without health care units), we find that 1,110 (91.5%) are exposed to at least one risk factor in the surrounding environment, either natural or human-made. In only 7 of the analyzed localities, do all four environmental risk elements appear together (Table 1).
With regard to protective factors, 849 localities repre-senting 42.7% of those under observation register spatial concurrence in at least four of the seven existing levels. It is notable that only 47 communities (3.7%) have all protective factors.
Finally, we find that 626 localities (49.1% of the total without health services) are classified as communities of high and very high marginalization, defined as values of 4 and 5
Table 1: Frequency Distribution for a Selection of Variables
Environmental Exposure 0.0 1.0 2.0 3.0 4.0 Absolute Frequency 121 506 610 31 7 Relative Frequency (%) 9.5 39.7 47.8 2.4 0.6 Cumulated Frequency (%) 9.5 49.2 97.0 99.5 100.0 Protective Factors 0.0 1.0 2.0 3.0 4.0 5.0 6.0 7.0 Absolute Frequency 3 71 74 233 350 460 37 47 Relative Frequency (%) 0.2 5.6 5.8 18.3 27.5 36.1 2.9 3.7 Cumulated Frequency (%) 0.2 5.8 11.6 29.9 57.3 93.4 96.3 100.0 Marginalization Values 1.0 2.0 3.0 4.0 5.0 Absolute Frequency 44 76 231 298 626 Relative Frequency (%) 3.5 5.9 18.1 23.4 49.1 Cumulated Frequency (%) 3.5
9.4 27.5 50.9 100.0
according to the official categories use by the Mexican agen-cies CONAPO-PROGRESA.
The map classifying localities by environmental expo-sure level, identified several areas in the state where various risk factors coincided (map 3). Areas of interest include the industrial corridor of San Juan del Río Querétaro (to the South-west of the state), with four factors; Amealco (to the South) with three coincidental risk factors; vicinity of Jalpan in the Sierra Gorda (Northeast of the state) with combinations of two environmental factors; and Peñamiller and Cadereyta, in the center of the state.
Additional thematic maps were constructed to analyze the regional distribution of localities under certain conditions of protection and marginalization (not included).
Based on a classification of protective factors with an ordinal scale, it was possible to recognize groups of localities with high values as determined by the weight of the classifi-cation of health care units. The highest values appear to the South Southwest of the state, coinciding again with the in-dustrial corridor of San Juan del Río – Querétaro. The follow-ing lower values are found around the other central localities (government headquarter and/or urban).
In addition, the analysis of the regional distribution of localities with high marginalization showed an important con-centration in the Northeastern area of the State—correspond-ing to the Sierra Gorda – however, other concentrations are found toward the periphery, in areas far from the principal lines of communication.
The statistical significance of Moran’s I for risk expo-sure is showing that its distribution is not random and that the exposure values tend to concentrate in certain places of the state. It also shows that there exists groups of neighbor-ing localities with similar values of exposure (Table 2), within the 5km limit. The levels of protection and marginalization show a clustering of neighboring communities, similar to the environmental exposure.
As a result of applying criteria analysis to synthesize the three groups of factors, a group of 379 critical localities
Moran’s I (5km) Environmental Exposure Protection Marginalization Calculated Value of I
0.7154
0.5556 0.4184
Expected Value of I
-0.0008
-0.0008 -0.0008
Standard Deviation of I
0.0146 0.0146 0.0146 Z score de I 49.1277 38.1662 28.7524 Significance (p) 0.00000 0.00000 0.00000
Table 2: Global Spatial Correlation Indices for Factors Associated to Vulnerability
were identified, where 55,083 people (4.4% of the state popu-lation) live, under greater environmental exposure, very little protection and high marginalization. Map 4 shows the ele-vated concentrations of these localities to the Northeast of the state, in the Sierra Gorda zone.
For purposes of estimating population and determining necessary resources to serve the populations in each health jurisdiction, the total of all localities in each administrative unit was calculated. The lowest concentration of critical com-munities is located in health jurisdiction I (Southeast), with 9 vulnerable localities and 953 inhabitants representing 0.1% of the jurisdiction’s population (Table 3). At the other ex-treme, jurisdiction IV (Northeast or Sierra Gorda), registers 242 vulnerable localities and 33,993 inhabitants (42.2% of the jurisdiction’s total population).
In absolute terms, we observe that the jurisdiction with the highest level of development and largest population (I) has a very small vulnerable population. In contrast, the health jurisdiction with the smallest population, fewest resources, and lowest level of development (IV) shows a highest num-ber of vulnerable localities and population.
Jurisdiction
I. Querétaro II. San Juan del Río III. Cadereyta IV. Pinal de Amoles State Total Critical Localities 9 7 121 242 379 Vulnerable Population 953 2,579 17,558 33,993 55,083 Total Population by Jurisdiction 706,566 340,821 122,503 80,586 1,250,470 Vulnerable Pop./ Total Pop. (%)
0.1 0.8 14.3 42.2 4.4
# First-level Units 50 58 49 35 192
# . Hospital Units 4 4 3 1 12 Vulnerable Pob./Unit Level Ratio 19.1 44.5 358.3 971.2 286.9
Table 3: Distribution of Critical Localities in each Jurisdiction
The health services response are limited by the avail-ability and specialization of health care facilities. The ratio of vulnerable population per unit of first level care is 50 times higher in Jurisdiction IV that in Jurisdiction I. Also, the num-ber of available care units with high specialization is lower in Jurisdiction IV.
Conclusions
Within a vulnerability analysis framework, tools such as SIGEpi allow the integration of measures and indicators from different sources, and place them in a common space for sta-tistical and geographical analysis. Using this, it is possible to delineate natural hazards in a geographical region, approxi-mate the scale of situations requiring response capacity which exceeds that of the health services and accordingly, evaluate some approaches to mitigate the vulnerability of populations and infrastructures exposed to environmental risks and di-sasters. This analysis is necessary to support and direct the decision-making process on priorities and interventions. Al-though not an exhaustive analysis, factors related to risk exposure were weighted according to their potential impact. This allows both the recognition and ability to take advan-tage of those procedures that determine risk. To this end, traditional univariate and multivariate analytical tools were used, including the value of spatial perspective.
Prospects for SIGEpi
With many issues concerning requirements and needs still facing GIS applications in public health, the solutions presented by SIGEpi, through its analytical tools for epidemi-ology and public health, open a favorable perspective for this GIS package.
Prior to its launching, SIGEpi, currently in its Beta ver-sion, has been tested by various Latin American and Span-ish institutions. Their suggestions are being incorporated into the program, and a series of functions still have to be incorporated into the package in the near future. Overall, the design of this SIGEpi has followed a systematic and evolu-tionary development whereby corrections, suggestions, and observations from internal and external reviewers have been incorporated.
The distribution of SIGEpi will be done by interinstitu-tional agreements between SHA/PAHO and health/academic institutions interested in its use for diagnosis and evaluation projects, or research in the area of public health and epidemi-ology. For more information contact Dr. Carlos Castillo-Sal-gado, Special Program for Health Analysis, PAHO; E-mail sha@paho.org.
Source: Prepared by Geog. Patricia Najera, Eng. Ramón Mártinez, Mr. Manuel Vidaurre, Dr. Enrique Loyola, Dr. Carlos Castillo-Salgado and Mr. Charles Eisner from PAHO’s Special Program for Health Analysis (SHA).
References:
(1) CONAPO. http://www.conapo.gob.mx. October 2001. (2) Sistema Nacional de Protección Civil. http://
www.proteccioncivil.gob.mx. October 2001.
(3) PAHO. Mitigación de desastres naturales en sistemas de agua potable y alcantarillado sanitario. Guías para el análisis de vulnerabilidad. Washington, D.C.; OPS, 1998:110.
(4) CONAPO-PROGESA. CD ROM/La Marginación en México, 1998. INEGI. Conteo de Población y Vivienda, 1995. Actualización de los datos del Censo Nacional de Población y Vivienda, 1990.
(5) INEGI. Conteo de Población y Vivienda, CD ROM / Resultados del Estado de Querétaro, 1995
(6) SEMARNAT. Página electrónica http://www.semarnat.gob.mx / Información estadística y geográfica del medio ambiente / información geográfica y biblioteca digital; http:// www.centrogeo.org.mx / biblioteca_dig/. October 2001. (7) INEGI. Conteo de Población y Vivienda, 1995. Actualización
de los datos del Censo Nacional de Población y Vivienda, 1990. (8) SEMARNAT. http://www.semarnat.gob.mx / Información
estadística y geográfica del medio ambiente / información geográfica y biblioteca digital. http://www.centrogeo.org.mx/ biblioteca_dig/. October 2001.
(9) Sistema Nacional de Protección Civil. Vínculos / información y clasificación de desastres. http://www.proteccioncivil.gob.mx/ index.html. October 2001.
(10) Secretaría de Salud del Estado de Querétaro. Regionalización Operativa de los Servicios de Salud del Estado de Querétaro. Dirección de Planeación. SESEQ. Documento de Trabajo, 1999. (11) IMSS. Página Electrónica. Directorio de unidadades médicas,
Querétaro. http://www.imss.gob.mx/organiza.htm/. October 2001.
(12) ISSSTE. Página Electrónica. Prestaciones, unidades médicas, distribución geográfica de clínicas y hospitales del ISSSTE en el país, Querétaro. http://www.issste.gob.mx/. October 2001. (13) Lic. Edna Ruiz. Secretaría de Extensión Universitaria,
Universidad Autónoma de Querátaro (UAQ); Octubre, 2001. Comunicación personal (edna@sunserver.dsi.uaq.mx) (14) Organización Panamericana de la Salud. Extensión de la
cobertura de los servicios de salud con las estrategias de atención primaria a la salud y participación de la comunidad. Bol Oficina Sanit Panam 1977; 83 (6):479.
(15) Moran PAP. The interpretation of statistical maps. J R Stat Soc [B] 1948;10:243-51.
The Special Program for Health Analysis (SHA) of the Pan American Health Organization (PAHO) and the Universidad Abierta de Cataluña (UOC) of Spain, recipient of the best virtual university award, are organizing theII Distance Learning Course on the Bases of Epidemiology and Biostatistics, offered in Spanish through the Internet starting in July of 2002. This second version has been created as a continuing education program in Epidemiology and Public Health Services. The characteristic of this program is that it is based on the development of professional skills for the practice of epidemiology. Accordingly, the process of learning is oriented to the resolution of real-life problems addressed by professionals in their daily work.
General objectives: It is expected that after completing the course, students will be capable of: 1) recognizing
the theoretical and practical bases of Epidemiology and Biostatistics in the health sciences, 2) Using the basic terminology in Epidemiology and in Biostatistics, 3) Formulating the epidemiological and statistical description of scientific information, 4) Posing and solving basic problems of inferential statistics in the area of health, 5) Recognizing and using the measures and main designs used in Epidemiology, 6) Applying the concepts and practices of Epidemiology and Biostatistics to different public health scenarios.
Organization of the Course: The course’s thematic units are organized in 7 modules. Two of them are
devoted to online learning methods and computational tools, while the rest includes concepts and fundamental methods of epidemiology and basic tools of biostatistics required for the epidemiological analysis of the health status and its determinants. The participants who pass the course will receive an academic certificate with credit value corresponding to 9 virtual units (equivalent to 6 traditional credit hours).
The course has an approximate duration of 6 months, initiating on the 1st of July 2002. There will be participation of international tutors devoted to a maximum of 7-8 students. There will be a limit of 35 students, who will be selected by an internal committee, in accordance with their qualifications, on a first-come first-served basis. The tuition consists of a recovery cost of $1,500 that covers administrative, registration costs and all materials.
Application: Applications should include name, age, address, current position, degree, previous
courses, and a recent photograph, in accordance with the application form (available at: http:// www.paho.org). Each student should have access to a computer and to the Internet. Applications will be received from this date until 1 May 2002. Admitted students will be informed of their selection in May. Applications indicating commitment and sources of financing (SHAdoes not grant fellowships) should be sent to the following address: Special Program for Health Analysis, Pan American Health Organization, 525 23rd Street, NW - Washington, DC 20037 U.S.A., Email: sha@paho.org
The Disease
Influenza (the “flu”) is one of the most notorious human ailments. First described by Hippocrates in 412 BC, it is one of the oldest and most common human diseases, affecting large portions of the world population in seasonal epidemics each year. While the symptoms of the flu are often mild in nature, the ever-changing influenza virus can lead to deadly pandemics. Surveillance and vaccine preparation - two im-portant activities of influenza control - are therefore indis-pensable to prevent its potentially deadly effects.
Influenza virus
Influenza viruses are classified as A, B and C. Influenza A and B are the two types that cause epidemic human dis-ease. Influenza A viruses are further categorized into sub-types on the basis of two surface antigens: hemagglutinin (H) and neuraminidase (N). The development of antigenic variants through a process called antigenic drift is the viro-logic basis for seasonal flu epidemics.
Clinical Signs and Symptoms
Influenza viruses are spread from person-to-person pri-marily through the coughing and sneezing of infected per-sons. The incubation period for influenza is 1-4 days, with an average of 2 days. Persons can be infectious starting with the first symptoms through approximately 5 days after illness onset; children can be infectious for a longer period. Uncom-plicated influenza illness is characterized by the abrupt onset of constitutional and respiratory signs and symptoms (e.g., fever, myalgia, headache, severe malaise, nonproductive cough, sore throat, and rhinitis). It typically resolves after several days for most persons, although cough and malaise can persist for more than 2 weeks. In some persons, the dis-ease can exacerbate underlying medical conditions (e.g., pul-monary or cardiac disease), lead to secondary bacterial pneu-monia or primary influenza viral pneupneu-monia, or occur as part of a co-infection with other viral or bacterial pathogens.
Epidemiology of Influenza
Seasonality
In the temperate and cold climates, the flu usually caus-es winter epidemics: December-March in the Northern Hemi-sphere; June-September in the Southern Hemisphere. In trop-ical and subtroptrop-ical areas, influenza epidemics can occur ei-ther twice a year or even throughout the year. As mentioned before, these seasonal epidemics occur due to antigenic drift. More rarely, major antigenic changes occur in the virus-es that can cause pandemics (worldwide outbreaks of an in-fluenza virus subtype to which the human population has no protection). The most severe infectious disease disaster of the 20th century was the “Spanish” influenza pandemic of
1918, which killed more than 40 million persons worldwide. Other more recent pandemics were the 1957 “Asian” flu and the 1968 “”Hong-Kong” flu.
Influenza: Basic Epidemiological Aspects for the
Development of Vaccines
Surveillance
Respiratory illness caused by influenza is difficult to dis-tinguish from illness caused by other respiratory pathogens on the basis of symptoms alone. The reported sensitivity and specificity of clinical definitions for influenza-like illness that include fever and cough have ranged from 63% to 78% and 55% to 71%, respectively, compared with viral culture. Sensitivity and predictive value of clinical definitions can vary, depending on the degree of cocirculation of other res-piratory pathogens and the level of influenza activity. For these reasons and because the influenza strains identified during one season are useful to help define the influenza strains to be recommended for the next season, virologic surveillance is the most important element of influenza sur-veillance. The recommended case definition of influenza is presented in Box 1.
Groups at highest risk
Although influenza viruses cause disease among all age groups, severe complications and death are highest among the elderly and among persons of any age suffering from chronic respiratory and cardiac conditions. The main tool for prevention of influenza is the yearly vaccination of persons at high risk with the inactivated influenza vaccine. Accord-ing to the United States Centers for Disease Control and Prevention (CDC)’s Advisory Committee on Immunization Practices (ACIP), the primary target groups recommended for annual vaccination in the U.S. are a) groups that are at increased risk for influenza-related complications: persons aged 65 years or older, residents of nursing homes and other chronic-care facilities that house persons of any age who have chronic medical conditions; adults and children who have chronic disorders of the pulmonary or cardiovascular systems, including asthma; adults and children who have required regular medical follow-up or hospitalization during the preceding year because of chronic metabolic diseases (including diabetes mellitus), renal dysfunction, hemoglobin-opathies, or immunosuppression (including immunosuppres-sion caused by medications); children and teenagers (aged 6
Clinical case definition
A person with sudden onset of fever of >38°C and cough or sore throat in the absence of other diagnoses.
Laboratory criteria for diagnosis*
Virus isolation:Swab or aspirate from the suspected individual, or Direct detection of influenza viralantigen
Serology:Four-fold rise in antibody titre between early and late serum.
Case classification
Suspected: A case that meets the clinical case definition.
Confirmed: A case that meets the clinical case definition and is laboratory
confirmed (used mainly in epidemiological investigation rather than surveillance).
*Rapid commercial diagnostic tests are available and are useful for outbreak investigations, but their sensitivity and specificity need to be better studied.
months to 18 years) who are receiving long-term aspirin ther-apy and therefore might be at risk for developing Reye syn-drome after influenza; and women who will be in the second or third trimester of pregnancy during the influenza season; b) the group aged 50-64 years because this group has an elevated prevalence of certain chronic medical conditions; and c) persons who live with or care for persons at high risk (e.g., health-care workers and household members who have frequent contact with persons at high risk and can transmit influenza infections to these persons at high risk). Vaccina-tion of these high-risk groups has shown to be among the most cost-effective interventions in public health.
The ACIP recommendations described above have been the basis for influenza vaccination recommendations in most countries where this vaccine is provided. Depending on their epidemiologic characteristics, some countries may consider the vaccination of other high risk groups, including indige-nous communities living in isolation. However, financial or logistic limitations can constrain some countries to limit the recommendations to the groups at highest risk or to those high-risk groups easier to identify.
Work absenteeism due to influenza could be a problem among otherwise healthy adults. Although this and other low-risk groups can also benefit from vaccination, C. Bridges and others, in a two years cost analysis of influenza vaccina-tion in a work setting found that, from a public health per-spective, there were no savings when giving the flu shot to healthy adults.
Flu vaccine
A person’s immunity to the surface antigens reduces the likelihood of infection and severity of disease if infection occurs. Antibody against one influenza virus type or sub-type confers limited or no protection against another influen-za virus type or subtype. Furthermore, antibody to one anti-genic variant of influenza virus might not protect against a new antigenic variant of the same type or subtype. Antigenic drift is the reason for the incorporation of one or more new strains in each year’s influenza vaccine. It is also the basis for the recommendation of yearly influenza vaccination.
Because manufacturers need at least 6 months to pre-pare a new vaccine, the World Health Organization (WHO) meets every year (usually in March) to recommend the influ-enza strains to be included in the vaccine for the Northern Hemisphere’s winter (usually December to March). Until 1998, the vaccine recommended for the Northern Hemisphere was used for the Southern Hemisphere winter half a year later. Studies by Regnery, Savy et al. have shown that, for eight out of ten winters analyzed, the vaccine recommended for the Northern Hemisphere did not match the strains that cir-culated during the following Southern Hemisphere winter. For this reason, since 1998, WHO holds a second yearly meet-ing (usually in September), to recommend influenza vaccine strains for the Southern Hemisphere. Because of the often-unusual patterns of virus circulation in these areas, deciding the best time for vaccination in tropical and subtropical areas is more challenging and needs to be studied on a case-by-case basis.
The Northern Hemisphere 2001-2002 trivalent vaccine virus strains recommended are A/Moscow/10/99 (H3N2)-like, A/New Caledonia/20/99(H1N1)-like, and B/Sichuan/379/99-like strains. Although the recommended optimal time period for vaccinating individuals is usually October-November in the Northern Hemisphere, due to delays in the manufactur-ing and distribution of the vaccine, the ACIP made the fol-lowing recommendations regarding flu vaccination strategies for the upcoming flu season in the U.S.: For providers: 1) target vaccine available in September and October to those at high risk and health-care workers; and 2) continue vacci-nation through December and as long as vaccine is available. For the public: 1) if at high risk, seek vaccine in September or October, or as soon as it is available and throughout the season; and 2) if not at high risk, seek vaccine in November or later. The vaccine components recommended for the 2002 Southern Hemisphere’s season are, in this opportunity, the same as those recommended for the 2001-2002 Northern Hemi-sphere season.
Antiviral agents
The use of influenza-specific antiviral drugs for chemo-prophylaxis or treatment of influenza is an important adjunct to vaccination. However, antiviral medications are not a sub-stitute for vaccination. Four currently licensed influenza an-tiviral agents are available in the United States: amantadine, rimantadine, zanamivir, and oseltamivir. Amantadine and rimantadine are chemically-related antiviral drugs effective for treatment and prophylaxis of influenza A but not influen-za B viruses. Rimantadine has the advantage of fewer side effects than amantadine. Both drugs are available as gener-ics. Zanamivir and oseltamivir are recently approved neuraminidase inhibitors with activity against both influenza A and B viruses. Both zanamivir and oseltamivir were ap-proved for the treatment of uncomplicated influenza infec-tions. Zanamivir is approved for treatment for persons over 7 years of age, and oseltamivir is approved for treatment for persons more than one year old and for prophylaxis of per-sons over 13. To be effective for treatment, antiviral drugs have to be used within 48 hours of onset of the respiratory symptoms.
Future issues
Live intranasal vaccine
A nasal spray flu vaccine has been shown in clinical tests to prevent influenza in healthy children. It consists of live, attenuated viruses that may have the advantage over the inactivated vaccine of inducing a broad mucosal and sys-temic immune response, ease of administration, and the ac-ceptability of an intranasal, painless route of administration compared with injectable vaccines.
vac-cinated children by 30% compared with unvacvac-cinated chil-dren. In a follow-up study during the 1997-1998 season, the trivalent live, cold-adapted influenza vaccine was 86% effec-tive in preventing culture-posieffec-tive influenza among children, despite a poor match between the vaccine’s influenza A(H3N2) component and the predominant circulating influ-enza A(H3N2) virus. A study conducted among healthy adults during the same season found a 9%-24% reduction in febrile respiratory illnesses and 13%-28% reduction in lost work days.
Should young children be recommended for vaccination? Studies indicate that rates of hospitalization are higher among young children than older children when influenza viruses are in circulation. However, the interpretation of these findings has been confounded by cocirculation of respirato-ry syncytial viruses, which are a cause of serious respiratorespirato-ry
viral illness among children and which frequently circulate during the same time as influenza viruses. Recent studies by Izurieta et al and by Neuzel et al have attempted to separate the effects of respiratory syncytial viruses and influenza vi-ruses on rates of hospitalization among children under 5 who do not have high-risk conditions. Both studies indicate that otherwise healthy children under 2 years of age are at in-creased risk for influenza-related hospitalization compared with older healthy children. Because very young healthy children are at increased risk for influenza-related hospital-ization, the ACIP is studying the benefits, risks, economic consequences and logistical issues associated with routine immunization of this age group in the U.S.
Source: Prepared by Dr. Hector Izurieta from PAHO’s Division of Vaccines and Inmunization (HVP).
Background
The incidence of diphtheria has declined in recent years in countries such as Cuba, Canada, or the United States that have a functional vaccination program where effective cov-erage with diphtheria toxoid and Diphtheria-Tetanus-Pertus-sis (DTP) vaccines have been achieved, especially in the infant population. In addition to the reduction in incidence, a change in the epidemiological profile of the disease was also registered. Indeed, its marked predilection for infants and young children has shifted in the last decade, to involve more young and older adults. On another hand, although mortality has increased during pandemics, the relation of this phenomenon to the causes of the pandemics is not known. Hypothesis on these changes include possible transforma-tions in the microorganism or in the host population that diminish the protective antibodies as age increases.
Santiago de Cali, the capital of the “Valle del Cauca” province, is located at 995 meters above sea level. The aver-age temperature is 25 degrees Celsius. It is the city that at-tracts the most people in Southwestern Colombia. It has a population of two million people distributed in 20 urban and 3 rural districts (“comunas” or communes), with marked dif-ferences in their socioeconomic levels and living conditions. For health services delivery, Cali relies on a public net-work of institutions that are part of the local health systems (Silos), of which 6 are urban and one rural, and on “Empresas Promotoras de Salud”, or health promoting companies, with their own network of servicesa.
The Municipal Public Health Service is the regulatory entity for surveillance and control in the city. It follows the guidelines and policies laid out by PAHO/WHO and the Min-istry of Health with regard to the activities of the Expanded Program on Immunization and Surveillance of vaccine-pre-ventable diseases that are object of eradication, elimination and control. There exists a network of Reporting Units formed
by all institutional health service providers.
The last diphtheria case recorded in Cali itself was in 1988. However, an outbreak occurred at the level of the prov-ince, in the municipality of Buenaventura, in 1992. On that occasion, a total of 88 people with symptoms compatible with diphtheria were examined. The ages ranged between 1 and 47 years. Laboratory tests were conducted in only 51 of these patients. The bacteriological results were as follows: virulent Corynebacterium diphtheriae was identified in 28 (54.9%) of the patients, and non-virulent C. diphtheriae was identi-fied in 4 (7.8%) of them. Of the total of cases, 4 were fatal.
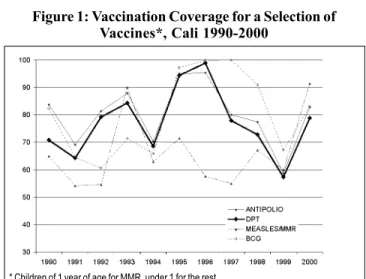
Figure 1 shows the coverage of a selection of vaccines in children under 1 year in Cali between 1990 and 2000. It can be observed that an increase in the coverage had been achieved between 1990 and 1996, but starting in 1997, the coverage began to decline until 1999, when they reached around 60% in all the biologicals shown here. The reasons for this decline cannot be determined with certainty without a more in-depth study of the factors that had an influence on the vaccination coverage. However, a possible factor in this
a The “Empresas Promotoras de Salud” are denominations created by
law in the new Colombian Social Security System. They are companies that manage the ressources of their affiliates and beneficiaries.
Figure 1: Vaccination Coverage for a Selection of Vaccines*, Cali 1990-2000
Diphtheria Outbreak in Cali, Colombia, August-October 2000
decline may have been the change in the health services de-livery in general - and of immunization in particular - intro-duced after the application of a law called “Ley 100” in Co-lombia. The purpose of this law, which was enacted in 1993, is to transform the old National Health System into a mixed general social security system with two contribution regi-mens (contributory and subsidized). Before 1997, when the new National Health System was consolidated, the public network was responsible for children immunization, which guaranteed an effective coverage with massive strategies, channeling and extramural activities. Starting in 1997, other actors of the social security system, among them nonprofit or for-profit private or semipublic companies, entered the network of service providers. Regardless of whether or not the vaccination services were appropriate in the years pre-ceding the law, it is certain that the resulting change in ser-vices - shown by the vaccination coverage - does not meet the vaccination needs. This can explain in part the observed decline in coverage.
On the other hand, the economic crisis that affected the national and local health sector worsened in recent years and affected the Expanded Program on Immunization. This im-pact is reflected in the lack of supplies, and also resulted in the decline of vaccination coverage at the end of the 1990s.
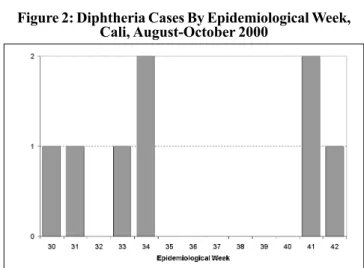
Materials and results of the investigation
In 2000, an outbreak of diphtheria occurred in Cali be-tween epidemiological weeks 30 and 42, with 8 confirmed cases. The first reported case was a 3 year-old girl. It was the only fatal case. A bacteriological study of a total of 458 sus-pected cases was carried out. Operational definitions used during the outbreak investigation can be found in Box 1. These cultures were completed for symptomatic persons who consulted health services spontaneously and to direct and indirect contacts of suspected cases. In 1.8% (8) of these samples, C. diphteriae was isolated with positive toxigenic-ity test. In 32 cases (7%), non-toxigenic C. pseudodiphtheri-cum was isolated. No bacteria of the Corynebacterium sp. was found in the remainder of the patients. All clinically-compatible cases were confirmed by laboratory with isola-tion of the bacteria. The populaisola-tion under 20 was the most affected by the outbreak (65%).
Of the 8 confirmed cases, 75% were younger than 10 years of age and 25% were 11 to 18 years old. In addition, 5 cases were found in men and 3 in women. In 2 cases (25%)
non-virulent C. diphtheriae was found and as a result they were classified as healthy carriers.
The death of the 3 year-old occurred in a neighborhood of a district located in the eastern part of the city. A total of 26 related contacts were found, who shared the same overcrowded dwelling and livovercrowded in precarious hygienic conditions -factors that led to the outbreak.
In spite of the immediate interventions that were carried out as part of the field investigation, 4 more cases with epide-miological link to the fatal case (brothers) were presented in weeks 31 to 34. In week 41, 2 cases (2 brothers) were report-ed, without epidemiological link to the previous ones. Those were located in a commune of the northeast of the city. This implies that there were multiple sources of infection, indicat-ing the possibility that additional cases were not detected. The last case of the outbreak appeared in week 42, in a 19 year-old adolescent residing in a commune of the southeast-ern area of the city. It did not have any epidemiological link with any of the previous cases (Figure 2).
The case-fatality rate of the outbreak was of 12.5% (1/8). The proportional distribution by age was as follows: 25% (2/ 8) in the 0-4 years group; 50% (4/8) in the 5-9 years group, 12.5% (1/8) in the 10-14 years group, and 12.5% (1/8) in the 15-19 age group (Table 1). The proportion of vaccinated among the cases was 12.5% (1/8), at the expense of a child vaccinat-ed with three doses of DPT. Of the cases, 62% had incom-plete series of vaccination and 75% (6/8) did not have access to social security.
The 8 cases belong to a socioeconomic stratum charac-terized by a high percentage of unmet basic needs, shown in overcrowded dwelling conditions, unhealthy conditions, in-adequate excreta disposal and difficult access to drinking
Suspected Case: Patient of any age with upper respiratory tract disease (pharynx, larynx, tonsils, nose), characterized by throat pain, light fever, which may be accompanied by adhering membrane and/or difficulty to swallow or breathe.
Confirmed Case: Symptomatic or asymptomatic case that is confirmed by isolation of toxigenic Corynebacterium diphteriae, or any suspected case that has an epidemiological link with a laboratory-confirmed case.
Contact: Any person living with a confirmed case, or frequenting his/her household or having some link (occupational, academic, social etc.) with a confirmed case.
Box 1: Operational Definitions Used during the Outbreak Investigation
Age
0-4 5-9 10-14 15-19
Total
Sex
M F
0 2
3 1
1 0
1 0
5 3
%
25 50 12.5 12.5
100
Rate x 100,000
14.8 31.2 31 31
7.9
Table 1: Distribution of Diphtheria Cases by Age and Sex Figure 2: Diphtheria Cases By Epidemiological Week,