journal homepage: www.scielo.br/ne
ISSN: 1519-566X
ECOLOGY, BEHAVIOR AND BIONOMICS
Popula
Ɵ
on Dynamics, Life Stage and Ecological Modeling in
Chrysomya
albiceps
(Wiedemann) (Diptera: Calliphoridae)
GS R
ÊÝ
1, MIS C
ÊÝã
2, JE C
ÊÙÙÄã
3, LVA S
®½ò®Ù
3, WAC G
ÊÊù
41Depto de Parasitologia, 3Depto de BioestaƟ sƟ ca. InsƟ tuto de Biociências, Univ Estadual Paulista, Rubião Junior, Botucatu, SP, Brasil 2Lab Nacional de Computação Cienơfi ca – LNCC – MCT, Petrópolis, RJ, Brasil
4Depto de Entomologia e Acarologia, Escola Superior de Agricultura Luiz de Queiroz, USP, Piracicaba, SP, Brasil
Keywords
PopulaƟ on ecology, stage matrix, blowfl y
Correspondence
Wݽù A C GÊÊù, Depto de Entomologia e Acarologia, Escola Superior de Agricultura Luiz de Queiroz, USP, 13418-900 Piracicaba, São Paulo, Brasil; [email protected]
Edited by Kleber Del Claro – UFU
Received 18 December 2009 and accepted 11 March 2010
Abstract
In this study we investigated the population dynamics of Chrysomya albiceps (Wiedemann)with laboratory experiments, employing
survival analysis and stage structure mathematical models, emphasizing survival among life stages. The study also assessed the theoretical in luence of density dependence and cannibalism during immature stages, on the population dynamics of the species. The survival curves were similar, indicating that populations of C. albiceps
exhibit the same pattern of survival among life stages. A strong nonlinear trend was observed, suggesting density dependence, acting during the irst life stages of C. albiceps. The time-series simulations
produced chaotic oscillations for all life stages, and the cannibalism did not produce qualitative changes in the dynamic behavior. The bifurcation analysis shows that for low values for survival, the population reaches a stable equilibrium, but the cannibalism results in chaotic oscillations practically over all the parametric space. The implications of the patterns of dynamic behavior observed are discussed.
Introducti on
One important attribute of insects is the existence of age classes and life stages. Within each age class, the individuals of a species behave differently, and have different types of dependence on the environment and resource needs (Cushing et al 2003, Dilão 2006). Several
studies have attempted to investigate age-structure problems by examining life tables in which the age of individual insects is determined and used to assess the standing population age structure (Gabre et al 2005, Liu et al 2008). To describe a population with age classes or
life-stages, a discrete formalism can be adopted, where the transition between different age classes or stages is described in a matrix form. One of the advantages of this
type of model is that it can be naturally related to ield or laboratory data (Caswell 2001, Dilão 2006).
The Leslie matrix model (Leslie 1945, 1948) has been frequently used to describe the dynamics of age- or stage-structured populations. The Leslie matrix approach leads the modeller to describe the population life history as a sequence of equal-duration age classes, thus effectively precluding the identi ication of these age classes with functional categories, instars, developmental stages, etc. (Leslie 1945, 1948, Tuljapurkar & Caswell 1997).
small, short-lived, and highly mobile organisms such as insects (Pitts & Wall 2004). An alternative solution for this problem is to attempt to evaluate life-history parameters in the laboratory or in semi-natural microcosms, where conditions can be controlled and detailed measurements made (Bonsall & Hassell 2005).
Blow lies are characterized by the ability of their larvae to develop in the lesh of vertebrates; some species parasitize invertebrates, while others can complete their larval development in animal detritus (Goodbrod & Goff 1990). However, the overall de ining characteristic of blow lies is the requirement for a protein-rich substrate, as provided by animal tissues or by-products, in which the larvae can complete their development (Goodbrod & Goff 1990).
The distribution of immatures in discrete breeding sites occurs through random dispersal of adult females (Blackith & Blackith 1990). This distribution may in luence the level of competition for food and space among immatures, with consequences for the viability of the resulting adults (De Jong 1979) and with a marked effect upon the population dynamics, as the density of the animals may differ between patches (De Jong 1979, Ives & May 1985, Turchin 1998). This means of distribution makes the blow ly community a complex system, including many simultaneous processes such as intra- and interspeci ic competition, besides intraguild predation, cannibalism and parasitism (Rueda & Axtell 1985, Wells & Greenberg 1992a,b,c, Faria et al 2004a,b,
Rosa et al 2006). All of these interactions have a strong
impact on the dipteran community, mainly under high larval densities (Goodbrod & Goff 1990, Wells & Greenberg 1992a,c).
High densities may have negative effects on the life history of blow lies (Faria et al 1999, 2004a,b, Rosa et al 2006). These effects have direct consequences for the
development and dynamics of the species (Godoy et al
2001, Serra et al 2007). A global analysis of population
dynamics involving life history parameters is important to evaluate dynamic patterns of temporal oscillation. However, the results produced by this kind of approach do not permit detailed analyses capable of associating the effect produced with the speci ic life stage in which the event takes place.
Old World lies of the genus Chrysomya are important
mechanic vectors of pathogenic organisms, causers of myiasis and forensic indicators (Zumpt 1965, Baumgartner & Greenberg 1984, Arnaldos et al 2005).
They have become widespread and abundant in the Neotropical region, displacing native species (Guimarães
et al 1978). Of all the exotic species, Chrysomya albiceps
(Wiedemann) deserves special attention because it is an intraguild predator of other blow ly species and is also cannibalistic during larval stage (Faria et al
1999, 2004a,b). Intraguild predation and cannibalism
in blow lies have affected not only the native blow ly fauna in Brazil (Rosa et al 2006, Gião & Godoy 2007),
but in several areas, C. albiceps and a similar species, Chrysomya ruϔifacies (Macquart), have in luenced the
local fauna (Wells & Greenberg 1992a,b,c, Grassberger
et al 2003, Shiao & Yeh 2008). Cannibalism has been
considered particularly in luential on the population dynamics of insects (Costantino et al 1995), affecting
population stability, and altering competitive interactions by decreasing the number of competitors or increasing the food quality (Dong & Polis 1992).
Several aspects of the biology and ecology of C. albiceps have been investigated with respect to population
dynamics and interspeci ic interactions (Faria et al 1999,
2004a,b, Serra et al 2007). However, no systematic study
of the stage structure and distribution of immatures has been performed in blow lies, especially combining laboratory experiments with ecological modelling.
The objective of the present study was to investigate the population dynamics of C. albiceps, employing a
combination of mathematical models, survival analysis, and laboratory experiments, focusing on survival among life stages and their structure. The study also considered the theoretical in luence of density dependence and cannibalism during immature stage on the population dynamics of C. albiceps.
Material and Methods
Laboratory populations of C. albiceps were founded from
specimens collected on the campus of the Universidade Estadual Paulista, Botucatu, São Paulo, Brazil. Adult lies were maintained at 25 1oC in cages (30 cm x 30 cm x 30
cm) covered with nylon, and were fed water and sugar ad libitum. Adult females were fed fresh beef liver to allow
the complete development of the gonotrophic cycle. The experiments were performed using the F2 generation, which is the progeny of one generation that completed its life cycle in laboratory.
Survival was estimated for each life stage, including egg, larva, pupa, and adult. Three larval stages were investigated, which correspond to three instars, L1, L2, and L3. The instars were determined using accepted morphological characters to identify the various developmental stages (Prins 1982). The survival rate was estimated by recording the number of individuals recovered in each life stage.
separation and recording. The eggs were returned to Petri dishes containing a 0.85% NaCl solution to allow them to hatch. They were maintained at 25 ± 1oC, 70% relative
humidity, and 12h photophase.
The number of larvae and pupae recovered in each development stage was recorded. After the adults emerged, males and females were also recorded. Adult females were fed fresh beef liver to permit the complete development of the gonotrophic cycle (Linhares 1988). Fecundity was measured by recording the number of eggs per female, expressed as mean fecundity per ive females.
StaƟ sƟ cal analysis
A survival analysis was run to compare survival curves from each replicate, using Kaplan-Meier survival curves and a Log-Rank test. The general equation for the Kaplan-Meier survival probability at failure time t(j) can be written as
) ) (j t T (j) t T ( ) (j (t S ) (j) (t
S Pr 1
1 > > −
∧ × − ∧ = ∧
This equation gives the probability of surviving past the previous failure time t(j-1), multiplied by the conditional probability of surviving past time t(j), given survival to at least time t(j). All analyses were performed using SAS for Windows, v. 9.2. A density-dependence test was applied to the data obtained from matrix simulations (see Matrix model section) in order to investigate if the population dynamics of each life stage was density-independent (Roughgarden 1998). To detect this response, a Chi-square test was applied to estimate whether the geometric growth factor (R) in each life stage
was dependent on population size (N). Basically, the test
consisted of checking whether the low R´s matched up
with high N´s and the high R´s with low N´s. The mean N
and the geometric mean of all the R´s for each life stage,
over all the data generated by the matrix simulations, were estimated. The results were expressed as a contingency table (Zar 1999). Exponential and linear regressions were also itted to the survival data, to investigate its negative decrease pattern as a function of the transition among life stages (Sokal & Rohlf 1981).
Matrix model
We used MATLAB 5.0 (The Mathworks 2004) to de ine a hundred-generation stage-classi ied model, where S is the mean constant probability of survival from x to x + 1. Six stages were de ined as follows: egg, L1, L2,
L3 (larval instars), pupa, and adult, where gj =
stage-speci ic transition (or ‘growth’) probabilities and fk =
stage-speci ic reproduction. Therefore, the population projection matrix takes the form:
M =
0 0
0 0 0 0
0 0 0
0 0 0
0 0 0 0
0 0
0 0 0 0 0
0
0 0 0 0 0 0
0 0 0 0 0 0
0 0 0 0 0
g6 g5 g4 g3 g2 g1
f7 f6
0 0 0 0 0 0
f8
g7
0 0 0 0
0 0 0
Survival among life stages and fecundity estimated in the laboratory were used as parameter values in the simulations. Fecundity was assumed to be constant.
A deterministic and density-dependent matrix model was employed to project blow ly populations through time (Caswell 2001). Non-linearity was introduced into the matrix model based on the formulations of Ricker (1952) and Prout & McChesney (1985), which employed exponential functions to describe the nonlinear decrease of demographic parameters as a function of immature densities.
Cannibalism between life stages was incorporated into the matrix model by introducing the exponential term based on the LPA model (Costantino et al 1995) into
the matrix model. By using an exponential function, the introduced term described the cannibalism by third-instars on second-instars, an intraspeci ic interaction previously demonstrated for C. albiceps in the laboratory (Faria et al
2004b). The estimate of the cannibalism rate (0.13) was obtained from the study by Faria et al (2004b). The matrix
model was structured to analyze the population dynamics of C. albiceps, considering life stages as follows:
M =
0 0
0 0 0 0
0 0 0
0 0 0
0 0 0 3 0 0 0
0 0 0 0 3 2 0 0
0 0 0 0 0 2 1 0
0 0 0 0 0 0 1
0 0 0 0 0
SAA SPA P L L L L L EL
F F
where F = fecundity
EL1 = S exp (-0.01 n(1)): survival probability from egg to L1 including density dependence
L1L2 = S exp (-0.01 n(1)): survival probability from L1 to L2
L2L3 = S exp (-c): survival probability from L2 to L3 including cannibalism by L3 on L2
SAA = survival probability from adult to adult c = cannibalism rate
A sensitivity analysis was applied to investigate the parametrical space of survival and cannibalism. The values used in these simulations were chosen based on the encounter of parametrical regions where the changes of equilibrium takes place. The analysis was conducted by employing the bifurcation theory (May & Oster 1976). The bifurcation theory provides an important analysis by using bifurcation diagrams to show the behaviour of systems in response to changes of parameter values (May & Oster 1976). Usually, different values of demographic parameters may produce different equilibria. In bifurcation diagrams, the horizontal axis gives the parameter value (survival or cannibalism in the current study) and the vertical axis represents the magnitudes of the steady state of the equation. Bifurcations represent new steady states (May & Oster 1976). Two stable branches indicate the existence of a stable period two orbit, four stable branches a period four orbit, and so on.
Results
The experiments designed to estimate the mean survival (between life stages) and fecundity (F) of C. albiceps
resulted in F = 281, EL1 (survival from egg to L1) = 0.88, L2L3 (from L2 to L3) = 0.86, L3P (from L3 to pupa) = 0.81, PA (from pupa to adult) = 0.79, and AA (young adult to
mature adult) = 0.77. The survival curves were similar, and the statistical analysis suggested no signi icant difference among replicates. The results also indicate that the most important mortality occurred between the egg and the irst instar. The exponential function produced a better it (r2= 0.84, P < 0.01) than the linear (r2 = 0.81,
P < 0.01) in response to a decrease in mortality among immature stages, con irming the non-linear association between mortality and trajectory of life stages.
The histogram shown in Fig 1 describes the theoretical
C. albiceps stage distribution over a hundred generations.
A strong non-linear trend can be seen in the decrease of the bars. The density-dependence test shows that the
1 2 3 4 5 6 7 0 100 200 300
1 2 3 4 5 6 7 0 100 200
1 2 3 4 5 6 7 0 50 100 150
1 2 3 4 5 6 7 0 50 100 150
1 2 3 4 5 6 7 0 50 100
1 2 3 4 5 6 7 0 1 2 3
x 104
1 2 3 4 5 6 7 0 1 2 3
x 104
1 2 3 4 5 6 7 0 1 2
x 104
1 2 3 4 5 6 7 0 1 2
x 104
1 2 3 4 5 6 7 0 5000 10000 15000
1 2 3 4 5 6 7 0 5000 10000 15000
1 2 3 4 5 6 7 0 1 2 3
x 106
1 2 3 4 5 6 7 0 2 4 6
x 106
1 2 3 4 5 6 7 0 2 4
x 106
1 2 3 4 5 6 7 0 2 4
x 106
1 2 3 4 5 6 7 0 1 2 3
x 106
1 2 3 4 5 6 7 0 1 2
x 106
1 2 3 4 5 6 7 0 1 2
x 108
1 2 3 4 5 6 7 0 2 4 6
x 108
1 2 3 4 5 6 7 0 2 4 6
x 108
1 2 3 4 5 6 7 0 2 4 6
x 108
1 2 3 4 5 6 7 0 2 4 6
x 108
1 2 3 4 5 6 7 0 2 4
x 108
1 2 3 4 5 6 7 0 1 2
x 1010
1 2 3 4 5 6 7 0 5 10
x 1010
1 2 3 4 5 6 7 0 5 10 15
x 1010
1 2 3 4 5 6 7 0 5 10
x 1010
1 2 3 4 5 6 7 0 5 10
x 1010
1 2 3 4 5 6 7 0 5 10
x 1010
1 2 3 4 5 6 7 0 1 2
x 1012
1 2 3 4 5 6 7 0 5 10
x 1012
1 2 3 4 5 6 7 0 1 2
x 1013
1 2 3 4 5 6 7 0 1 2
x 1013
1 2 3 4 5 6 7 0 5 10 15
x 1012
1 2 3 4 5 6 7 0 5 10 15
x 1012
1 2 3 4 5 6 7 0 5 10 15
x 1013
1 2 3 4 5 6 7 0 5 10
x 1014
1 2 3 4 5 6 7 0 1 2 3
x 1015
1 2 3 4 5 6 7 0 1 2 3
x 1015
1 2 3 4 5 6 7 0 1 2 3
x 1015
1 2 3 4 5 6 7 0 1 2 3
x 1015
1 2 3 4 5 6 7 0 5 10 15
x 1015
1 2 3 4 5 6 7 0 5 10
x 1016
1 2 3 4 5 6 7 0 1 2 3
x 1017
1 2 3 4 5 6 7 0 2 4 6
x 1017
1 2 3 4 5 6 7 0 2 4 6
x 1017
1 2 3 4 5 6 7 0 2 4
x 1017
1 2 3 4 5 6 7 0 5 10 15
x 1017
1 2 3 4 5 6 7 0 5 10
x 1018
1 2 3 4 5 6 7 0 2 4
x 1019
1 2 3 4 5 6 7 0 5 10
x 1019
1 2 3 4 5 6 7 0 5 10
x 1019
1 2 3 4 5 6 7 0 5 10
x 1019
1 2 3 4 5 6 7 0 5 10 15
x 1019
1 2 3 4 5 6 7 0 5 10
x 1020
1 2 3 4 5 6 7 0 2 4
x 1021
1 2 3 4 5 6 7 0 5 10
x 1021
1 2 3 4 5 6 7 0 5 10 15
x 1021
1 2 3 4 5 6 7 0 5 10 15
x 1021
1 2 3 4 5 6 7 0 1 2
x 1022
1 2 3 4 5 6 7 0 5 10
x 1022
1 2 3 4 5 6 7 0 2 4 6
x 1023
1 2 3 4 5 6 7 0 5 10 15
x 1023
1 2 3 4 5 6 7 0 1 2
x 1024
1 2 3 4 5 6 7 0 1 2 3
x 1024
1 2 3 4 5 6 7 0 1 2 3
x 1024
1 2 3 4 5 6 7 0 5 10 15
x 1024
1 2 3 4 5 6 7 0 2 4 6
x 1025
1 2 3 4 5 6 7 0 5 10 15
x 1025
1 2 3 4 5 6 7 0 1 2 3
x 1026
1 2 3 4 5 6 7 0 2 4
x 1026
1 2 3 4 5 6 7 0 2 4 6
x 1026
1 2 3 4 5 6 7 0 1 2
x 1027
1 2 3 4 5 6 7 0 5 10
x 1027
1 2 3 4 5 6 7 0 1 2
x 1028
1 2 3 4 5 6 7 0 2 4
x 1028
1 2 3 4 5 6 7 0 5 10
x 1028
1 2 3 4 5 6 7 0 5 10
x 1028
1 2 3 4 5 6 7 0 1 2
x 1029
1 2 3 4 5 6 7 0 2 4 6
x 1029
1 2 3 4 5 6 7 0 2 4
x 1030
1 2 3 4 5 6 7 0 5 10
x 1030
1 2 3 4 5 6 7 0 5 10
x 1030
1 2 3 4 5 6 7 0 5 10 15
x 1030
1 2 3 4 5 6 7 0 1 2 3
x 1031
1 2 3 4 5 6 7 0 5 10
x 1031
1 2 3 4 5 6 7 0 1 2 3
x 1032
1 2 3 4 5 6 7 0 5 10
x 1032
1 2 3 4 5 6 7 0 5 10 15
x 1032
1 2 3 4 5 6 7 0 1 2 3
x 1033
1 2 3 4 5 6 7 0 2 4
x 1033
1 2 3 4 5 6 7 0 5 10
x 1033
1 2 3 4 5 6 7 0 1 2 3
x 1034
1 2 3 4 5 6 7 0 5 10
x 1034
1 2 3 4 5 6 7 0 1 2
x 1035
1 2 3 4 5 6 7 0 2 4
x 1035
1 2 3 4 5 6 7 0 2 4 6
x 1035
1 2 3 4 5 6 7 0 5 10 15
x 1035
1 2 3 4 5 6 7 0 2 4
x 1036
1 2 3 4 5 6 7 0 5 10
x 1036
Life stages of C. albiceps N
most susceptible period between life stages to density dependence is from egg to irst instar (2 = 10.87, df =
1, P < 0.05).
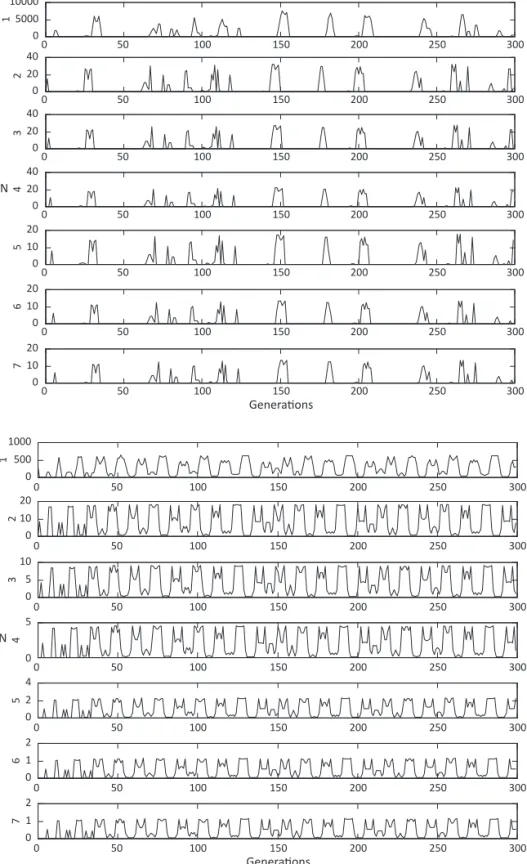
The simulations using the Matrix model produced seven graphs showing the luctuations for each life stage over 300 generations (Fig 2). The largest population sizes were found for the estimates from egg to irst instar, and the highest abundance through the generations were followed by dramatic decreases, produced in response
to density dependence (Fig 2).
Following the decreases, the population sizes remained at low levels over several generations. Introduction of the cannibalism term into the matrix model, using laboratory estimates obtained by Faria et al (2004a),
produced no qualitative change in the dynamic behavior for all life stages (Fig 2). Only an arbitrary reduction of survival in this study to 0.5 produced oscillations, tending to periodicity with double peaks (Fig 3). The
Fig 2 Population dynamics of Chrysomya albiceps life stages (1-7) produced by the Matrix model, with survival and fecundity estimated in the laboratory. F = 281; EL1 = 0.88, including density dependence; L2L3 = 0.86, cannibalism by L3 on L2; L3P = 0.81; SPA = 0.79; SAA = 0.77.
Fig 3 Population dynamics of Chrysomya albiceps life stages (1-7) produced by the Matrix model, with survival set to 0.5 in all life stages. F = 281; EL1 = 0.5, including density dependence; L2L3 = 0.5, cannibalism by L3 on L2; L3P = 0.5; SPA = 0.5; SAA = 0.5.
0 50 100 150 200 250 300
0 5000 10000
1
0 50 100 150 200 250 300
0 20 40
2
0 50 100 150 200 250 300
0 20 40
3
0 50 100 150 200 250 300
0 20 40
4
0 50 100 150 200 250 300
0 10 20
5
0 50 100 150 200 250 300
0 10 20
6
0 50 100 150 200 250 300
0 10 20
7
GeneraƟons N
0 50 100 150 200 250 300
0 500 1000
1
0 50 100 150 200 250 300
0 10 20
2
0 50 100 150 200 250 300
0 5 10
3
0 50 100 150 200 250 300
0 5
4
0 50 100 150 200 250 300
0 2 4
5
0 50 100 150 200 250 300
0 1 2
6
0 50 100 150 200 250 300
0 1 2
7
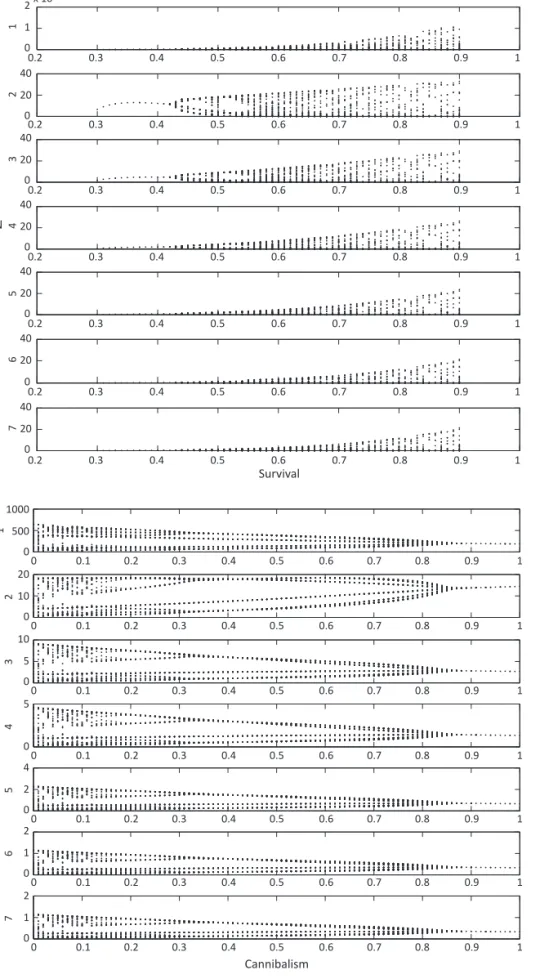
bifurcation diagram shows that low values of survival lead the population to a stable equilibrium, and survival higher than 0.45 produces unpredictable oscillations
(Fig 4). The bifurcation diagram for cannibalism suggests unpredictable oscillations over the entire parametric space, except for values higher than 0.85 (Fig 5).
Fig 4 Bifurcation diagram analyzing the parametric space of survival in Chrysomya albiceps.F = 281; EL1 = including density dependence (-0.01); L2L3 = cannibalism by L3 on L2 (-0.01335).
Fig 5 Bifurcation diagram analyzing the parametric space of cannibalism in Chrysomya albiceps, with survival set to 0.5 in all life stages. F = 281; EL1 = 0.5, including density dependence; L2L3 = 0.5; L3P = 0.5; SPA = 0.5; SAA = 0.5.
Survival
0.2 0.3 0.4 0.5 0.6 0.7 0.8 0.9 1 40
20 0
7
0.2 0.3 0.4 0.5 0.6 0.7 0.8 0.9 1 40
20 0
6
0.2 0.3 0.4 0.5 0.6 0.7 0.8 0.9 1 40
20 0
5
0.2 0.3 0.4 0.5 0.6 0.7 0.8 0.9 1 40
20 0
4
0.2 0.3 0.4 0.5 0.6 0.7 0.8 0.9 1 40
20 0
3
0.2 0.3 0.4 0.5 0.6 0.7 0.8 0.9 1 40
20 0
2
0.2 0.3 0.4 0.5 0.6 0.7 0.8 0.9 1 2
1 0
1
N
x 104
Cannibalism
0 0.1 0.2 0.3 0.4 0.5 0.6 0.7 0.8 0.9 1 1000
500 0
1
N
0 0.1 0.2 0.3 0.4 0.5 0.6 0.7 0.8 0.9 1 20
10 0
2
0 0.1 0.2 0.3 0.4 0.5 0.6 0.7 0.8 0.9 1 10
5 0
3
0 0.1 0.2 0.3 0.4 0.5 0.6 0.7 0.8 0.9 1 5
0
4
0 0.1 0.2 0.3 0.4 0.5 0.6 0.7 0.8 0.9 1 4
2 0
5
0 0.1 0.2 0.3 0.4 0.5 0.6 0.7 0.8 0.9 1 2
1 0
6
0 0.1 0.2 0.3 0.4 0.5 0.6 0.7 0.8 0.9 1 2
1 0
Discussion
The similarity among survival curves indicates that populations of C. albiceps always exhibit the same survival
pattern among life stages, in which survival decreases with each stage. The most important mortality period was observed between the egg and the irst instar, suggesting that the following instars are more resistant. The exponential function produced the best statistical it in response to a decrease in mortality among immature stages. This result was the irst suggestion of nonlinearity in the system.
Survival and fecundity have been investigated previously in blow lies, including C. albiceps, and show
a signi icant exponential decrease as a function of larval densities (Reis et al 1996, Godoy et al 2001). However,
these studies have considered no stage structure in their designs. In any event, demographic factors such as these usually exhibit strong associations with the population dynamics of blow ly species, often in luencing the patterns of dynamic behavior and population persistence (Serra et al 2007).
The histogram time series suggests that a strong non-linear trend, characterized by the decrease of the bars, could take place during successive generations in
C. albiceps. The density-dependence test indicates that
the most susceptible period among life stages to density dependence is from egg to irst instar. The density dependence observed in this life period has commonly been observed in experimental and natural blow ly populations, since during this time many adult lies are attracted to oviposition substrates in order to deposit a large number of eggs (Von Zuben et al 1996). A large
number of larvae is commonly expected in carcasses, leading blow ly populations to compete for food in response to strong density dependence (Carvalho et al
2004, Serra et al 2007).
The Matrix model produced seven graphs showing luctuations apparently chaotic for each life stage over 300 generations. The dynamics of blow lies has historically been viewed as a good example of complex dynamics, characterized by time series with quasi-cycles or chaos observed in the laboratory (Gurney et al 1980,
Godoy 2007). Nevertheless, these results seem to be essentially connected to demographic parameter values, such as survival and fecundity (Gurney et al 1980, Godoy et al 1996).
Up to now, the population dynamics of C. albiceps has
been studied without considering age or stage structure (Godoy et al 2001, Serra et al 2007). Godoy et al (2001)
investigated the population dynamics of C. albiceps by
means of a mathematical model developed by Prout & McChesney (1985), which incorporates fecundity and survival as density-dependent demographic parameters in discrete time, and found a two-point limit cycle for
this species. The estimates of demographic parameters obtained in the laboratory by Godoy et al (2001) showed
that C. albiceps is a species with high sensitivity to change
in its dynamic equilibrium, exhibiting an eigenvalue close to the frontier between stable equilibrium and a limit cycle. This sensitivity could explain the result found in the current study, showing a tendency to change the dynamics in response to different values of demographic parameters.
The interesting point is that both the Prout & McChesney model and the matrix model here employed have the same function to describe the density dependence, i.e., exponential functions, but the dynamic behavior differed between the two formulations. The result obtained for C. albiceps with the Prout & McChesney
model was a two-point limit cycle, and with the matrix model simulations unpredictable luctuations were also observed. The difference could be explained by the magnitude of the survival. In the simulations with the Prout & McChesney model (Godoy et al 2001), the
estimated survival (0.56) was clearly lower than in this study (minimum equal to 0.7).
The bifurcation diagram clearly indicates that low values of survival lead the population to a stable equilibrium. Then, the arbitrary decrease in survival among immature stages in the matrix model gave similar results, making the system more stable. Bifurcation analysis was previously performed by Godoy et al (1996)
by using a density-dependent population growth model in exotic and native blow lies, with results also showing stability associated with low survival values. It is possible to conclude from these indings that the stability of blow ly populations is closely associated with their demography.
Introduction of the cannibalism term into the matrix model, using laboratory estimates obtained by Faria et al
(2004a), produced no qualitative change in the dynamic behavior for all life stages. Cannibalism in C. albiceps is
still a little-studied interaction, but there is clear evidence that it occurs in response to food scarcity (Faria et al
2004a, Rosa et al 2006). The simulation obtained with
the bifurcation diagram for cannibalism indicated that apparently chaotic oscillations can occur. This result suggests that cannibalism is an important interaction for C. albiceps in spite of the low rate estimated by Faria et al (2004a).
Chrysomya albiceps is a blow ly species that exhibits
attributes of organisms highly sensitive to intraspeci ic competition (Rosa et al 2006). This kind of behavior
usually leads insects to show cannibalistic behavior (Costantino et al 1995, Rosa et al 2006). Although
considering demographic and behavioral aspects in insect populations. There is strong experimental evidence indicating that C. albiceps shows a dramatic decline in
the number of survivors under intraspeci ic competition (Rosa et al 2006). In this case, cannibalism could be also
responsible for the stability found in response to low survival rates.
The current study showed through the simulations, that both survival and cannibalism are important parameters for species such as C. albiceps because of
their ability to in luence the dynamic behavior of species that exhibit high sensitivity to competition. In spite of the partial theoretical connotation of this study, most of simulations were performed by using real data obtained from laboratory. The simulations run with arbitrary values were motivated by a plausible ecological scenario commonly observed in the blow ly system, described by intense intraspeci ic competition, which takes place in ephemeral patches where there is food scarcity, as for example carcasses (Ives & May 1985). In any attempt to model a biological system, one must confront a tradeoff between simulations and realism. In this study, we attempted to retain what we feel are the most important aspects of the biology of C. albiceps in relation to its
population dynamics, while keeping the model as simple as possible. The relatively small number of parameters in the matrix model allowed us to retain some generality and to probe the parameter space for insight into the dynamic properties of C. albiceps populations.
Acknowledgments
The authors thank Janet W Reid for revising the English text and an anonymous reviewer for making helpful suggestions to improve the manuscript. GSR received scholarships from CAPES, and WACG was partially supported by CNPq. This research was supported by grants from FAPESP.
References
Arnaldos MI, Garcia MD, Romera E, Presa JJ, Luna A (2005) Estimation of postmortem interval in real cases based on experimentally obtained entomological evidence. Forensic Sci Int 149: 57-65.
Baumgartner DL, Greenberg B (1984) The genus Chrysomya (Diptera: Calliphoridae) in the New World. J Med Entomol 21: 105-113.
Blackith RE, Blackith RM (1990) Insect infestation of small corpses. J Nat Hist London 24: 699-709.
Bonsall MB, Hassell MP (2005) Understanding ecological concepts: the role of laboratory systems, p.1-29. In Desharnais RA (ed) Advances in ecological research: population dynamics and
laboratory ecology. Amsterdam, Elsevier Academic Press, 374p.
Carvalho LML, Thyssen PJ, Goff ML, Linhares AX (2004) Observations on the succession patterns of necrophagous insects on a pig carcass in an urban area of Southeastern Brazil. Aggar Inter J For Med Tox 5: 33-39.
Caswell H (2001) Matrix population models. Sunderland, Sinauer Associates Inc. 722p.
Costantino RF, Cushing JM, Dennis B, Desharnais RA (1995) Experimentally induced transitions in the dynamic behaviour of insect populations. Nature 375: 227-230.
Cushing JM, Costantino RF, Dennis B, Desharnais RA, Henson SM (2003) Chaos in ecology: experimental nonlinear dynamics, Amsterdam, Academic Press, 225p.
De Jong G (1979) The in luence of the distribution of juveniles over patches of food on the dynamics of a population. Neth J Zool 29: 33-51.
Dilão R (2006) Mathematical models in population dynamics and ecology. In Mondaine R P, Pardalos PM (eds) Biomathematics: modelling and simulation. Singapure, World Scienti ic, Publishing Co. Pte. Ltd., 493p.
Dong Q, Polis GA (1992) The dynamics of cannibalistic populations: a foraging perspective, p.13-38. In Elgar MA and Crespi BJ. (eds) Cannibalism, ecology and evolution among diverse taxa. Oxford, Oxford Science, 338p.
Elgar MA, Crespi BJ (1992) Cannibalism, ecology and evolution among diverse taxa. Oxford, Oxford science publications, 338p. Faria LDB, Godoy WAC, Reis SF (2004b) Larval predation on
different instars in blow ly populations. Braz Arch Biol Technol 47: 887-894.
Faria LDB, Orsi L, Trinca LA, Godoy WAC (1999) Larval predation by Chrysomya albiceps on Cochliomyia macellaria, Chrysomya megacephala and Chrysomya putoria.Entomol Exp Appl 90: 149-155.
Faria LDB, Trinca LA, Godoy WAC (2004a) Cannibalistic behaviour and functional response in Chrysomya albiceps (Diptera:Calliphoridae). J Insect Behav 17: 251-261.
Gabre RA, Adham FK, Chi H (2005) Life table of Chrysomya megacephala (Fabricius) (Diptera: Calliphoridae). Acta Oecol 27: 179-183.
Gião JZ, Godoy WAC (2007) Ovipositional behaviour in predator and prey blow lies. J Insect Behav 20: 77-86.
Godoy WAC (2007) Dynamics of blow ly populations. Func Ecosys Comm 1: 129-139.
Godoy WAC, Von Zuben CJ, Reis SF, Von Zuben FJ (1996) Dynamics of experimental blow lies (Diptera : Calliphoridae): mathematical modelling and the transition from asymptotic equilibrium to bounded oscillations. Mem Inst Oswaldo Cruz 91: 641-648. Godoy WAC, Von Zuben FJ, Von Zuben CJ, Reis SF (2001)
Goodbrod JR, Goff ML (1990) Effects of larval population density on rates of development and interactions between two species of Chrysomya (Diptera: Calliphoridae) in laboratory culture. J Med Entomol 27: 338-343.
Grassberger M, Friedrich E, Reiter C (2003) The blow ly Chrysomya albiceps (Wiedemann) (Diptera: Calliphoridae) as a new forensic indicator in Central Europe. Int J Leg Med 117: 75-81.
Guimarães JH, Prado AP, Linhares AX (1978) Three newly introduced blow ly species in Southern Brazil (Diptera: Calliphoridae). Rev Bras Entomol 22: 53-60.
Gurney WSC, Blythe SP, Nisbet RM (1980) Nicholson’s blow lies revisited. Nature287: 17-21.
Ives AR, May RM (1985) Competition within and between species in a patchy environment: relations between microscopic and macroscopic models. J Theor Biol 115: 65-92.
Leslie PH (1945) On the use of matrices in certain population mathematics. Biometrika 35: 183-212.
Leslie PH (1948) Some further notes on the use of matrices in population mathematics. Biometrika 35: 213-245.
Linhares AX (1988) The gonotrophic cycle of Chrysomya megacephala (Diptera, Calliphoridae) in the laboratory. Rev Bras Entomol 32: 383-392.
Liu X D, Zhai BP, Zhang XX (2008) Specialized host-plant performance of the cotton aphid is altered by experience. Ecol Res 23: 919-925.
May RN, Oster GF (1976) Bifurcations and dynamic complexity in simple ecological models. Am Nat 110: 573-599.
Pitts KM, Wall R (2004) Adult mortality and oviposition rates in ield and captive populations of the blow ly Lucilia sericata. Ecol Entomol 29: 727-734.
Prins AJ (1982) Morphological and biological notes on six African blow lies (Diptera, Calliphoridae) and their immature stages. Ann S Afr Mus 90: 201-217.
Prout T, McChesney F (1985) Competition among immatures affects their adult fertility: population dynamics. Am Nat 126: 521-558.
Reis SF, Teixeira MA, Von Zuben FJ, Godoy WAC, Von Zuben CJ (1996) Theoretical dynamics of experimental populations of introduced and native blow lies (Diptera, Calliphoridae). J Med Entomol 33: 537-544.
Ricker EL (1952) Stock and recruitment. J Fish Res Board Can 11: 559-623.
Rosa GS, Carvalho LR, Reis SF, Godoy WAC (2006) The dynamics of intraguild predation in Chrysomya albiceps Wied. (Diptera: Calliphoridae): interactions between instars and species under different abundances of food. Neotrop Entomol 35: 775-780.
Roughgarden J (1998) Primer of ecological theory. Upper Saddle River, Prentice Hall, 456p.
Rueda LM, Axtell RC (1985) Guide to common species of pupal parasites (Hymenoptera: Pteromalidae) of the house ly and other muscoid lies associated with poultry and livestock manure. Technical Bulletin 278. North Carolina Agricultural Research Service, North Carolina State University.
Serra H, Silva ICR, Mancera PFA, Faria LDB, Von Zuben CJ, Von Zuben FJ, Reis SF, Godoy WAC (2007) Stochastic dynamics in exotic and native blow lies: an analysis combining laboratory experiments and a two-patch metapopulation model. Ecol Res 22: 686-695. Shiao SF, Yeh TC (2008) Larval competition of Chrysomya
megacephala and Chrysomya ruϔifacies (Diptera: Calliphoridae): behavior and ecological studies of two blow ly species of forensic signi icance. J Med Entomol 45: 785-799.
Sokal RR, Rohlf FJ (1981) Biometry. New York, Freeman, 859p. The MathWorks Inc (2004) Matlab & Simulink. Massachusetts, The
Mathworks Inc. Natick, 429p.
Tuljapurkar S, Caswell H (1997) Structured-population models, in marine, terrestrial, and freshwater systems. New York, Chapman and Hall, 631p.
Turchin P (1998) Quantitative Analysis of Movement. Sunderland, Sinauer Associates, 396p.
Von Zuben CJ, Bassanezi RC, dos Reis SF, Godoy WAC, Von Zuben FJ (1996) Theoretical approaches to forensic entomology: I. mathematical model of postfeeding larval dispersal. J Appl Entomol 120: 379-382.
Wells JD, Greenberg B (1992a) Rates of predation by Chrysomya ruϔifacies (Macquart) on Cochliomyia macellaria (Fabr.) (Diptera: Calliphoridae) in the laboratory: Effect of predator and prey development. Pan-Pac Entomol 68: 12-14.
Wells JD, Greenberg B (1992b) Laboratory interaction between introduced Chrysomya ruϔifacies and native Cochliomyia macellaria (Diptera: Calliphoridae). Environ Entomol 21: 640-645.
Wells JD, Greenberg B (1992c) Interaction between Chrysomya ruϔifacies and Cochliomyia macellaria (Diptera: Calliphoridae): the possible consequences of an invasion. Bull Entomol Res 82: 133-137.
Zar JH (1999) Biostatistical analysis. Prentice Hall, New Jersey, 620p.