ECOLOGY, BEHAVIOR AND BIONOMICS
Modeling Egg Distribution of
Tinocallis kahawaluokalani
(Kirkaldy)
(Hemiptera: Aphididae) on
Lagerstroemia indica
L. (Lythraceae)
SONIA M.N. LAZZARI
1AND REGINA C. ZONTA-DE-CARVALHO21Depto. Zoologia, Univ. Federal do Paraná, C. postal 19020, 81531-980, Curitiba, PR, [email protected]. CNPq fellowship 2Centro de Diagnóstico Marcos Enrietti – SEAB/PR, Rua Jaime Balão 575, 80040-340, Curitiba, PR
Neotropical Entomology 35(6):762-768 (2006)
Modelo da Distribuição de Ovos de Tinocallis kahawaluokalani (Kirkaldy) (Hemiptera: Aphididae) on
Lagerstroemia indica L. (Lythraceae)
RESUMO - Este é o primeiro registro da ocorrência de ovos de inverno do afídeo holocíclico monoécio Tinocallis kahawaluokalani (Kirkaldy) em Lagerstroemia indica L., no Brasil. Os ovos, pretos brilhantes, foram observados a partir do início do outono, depositados nas dobras da casca e gemas dos ramos. Com o objetivo de avaliar a abundância e distribuição dos ovos, bem como modelar esse evento, quatro ramos dos pontos cardeais de 10 plantas de dois grupos etários, 5-10 e 20-30 anos de idade, foram coletados ao acaso e cortados em oito segmentos de 10 cm, registrando-se o número de ovos, no inverno de 2001. Os ovos estavam depositados principalmente na porção mediana dos ramos, entre 40 cm e 60 cm do ápice nas árvores mais velhas (54%) e entre 30 cm e 60 cm nas jovens (58%). Os dados ajustaram-se a um modelo de regressão longitudinal que expressa a tendência da distribuição dos ovos nos ramos. O número de ovos foi maior nas plantas mais velhas (61%) que nas jovens (39%), e o número médio de ovos (± IC 95%) foi 70,5 r 9,3 e 47,4 r 12,5, respectivamente nos dois grupos etários. Não houve correlação entre a distribuição dos ovos e a posição dos ramos nos pontos cardeais.
PALAVRAS-CHAVE: Pulgão-da-extremosa, afídeo holocíclico, modelo de regressão longitudinal, oviposição
ABSTRACT - This is the fi rst record of winter eggs of the holocyclic monoeceous crapemyrtle aphid Tinocallis kahawaluokalani (Kirkaldy) on Lagerstroemia indica L., in Brazil. The shiny black eggs were observed since early autumn, laid on small folds and crevices of the branches. In order to evaluate and model the egg abundance and distribution, four branches from the cardinal points of 10 plants of two age groups, 5-10 and 20-30 years-old, were collected randomly and cut in eight segments of 10 cm and the number of eggs was registered, in the winter 2001. The eggs were laid mainly on the middle portion of the branch, from 40 cm to 60 cm from the apex on the older trees (54%) and on 30 cm to 60 cm on younger ones (58%). The data fi t in a longitudinal regression model that expresses the tendency of the egg distribution on the branches. The number of eggs was greater on the 20-30 year-old plants (61%) than on younger ones (39%). The average number (± CI 95%) of eggs was 70.5 r 9.3 and 47.4 r 12.5, respectively, for the older and younger tree groups. There was no correlation between egg distribution and the cardinal positions of the branches.
KEY WORDS: Crapemyrtle aphid, holocyclic aphid, longitudinal regression model, oviposition
About 90% of the aphid species are originally monoeceous and holocyclic, however when they are introduced into tropical and subtropical regions they tend to adapt to anholocyclic life cycles (Dixon 1985, Moran 1992, Blackman & Eastop 1994).
The crapemyrtle aphid, Tinocallis kahawaluokalani (Kirkaldy), is monoeceous and holocyclic on Lagerstroemia indica L. wherever it occurs. During the summer it produces several parthenogenetic viviparous generations formed by alate females, followed by a generation of apterous
oviparous females and alate males during the autumn. These reproductive morphs copulate and produce the winter eggs (Pattiet al. 1984, Alverson & Allen 1992).
females, oviparous females, males and the winter eggs) were found on L.indica in southern Brazil, by the authors of this research.
According to Patti et al. (1984) and Alverson & Allen (1992), the eggs of T. kahawaluokalani are oval with a smooth chorion and change from yellow to brownish and
fi nally shiny black and are laid under crevices of the branches. Alverson & Allen (1992) observed that 35% and 54% of the eggs of the crapemyrtle aphid are found, respectively, at 20 cm and 40 cm from the apex of the branches of L.indica,
fi ve years-old and with 2.5 m height, in South Carolina. The mean density was higher at the apical 20 cm (0.63 ± 0.14 eggs/cm2) than at the 81-90 cm basal portion of the branch (0.21 ± 0.08 eggs/cm2).
The crape myrtle tree, L.indica, is an exotic ornamental plant cultivated in Brazil for landscaping. It is pruned when it is a young tree to keep the desired shape, but when it becomes older a radical pruning is done every other winter, leaving only the trunk and the basis of the main large branches. Although it produces viable seeds, cut branches are the main parts of the plant used for grafting and propagation of L. indica (Rotta et al. 1996).
Heavy crapemyrtle aphid infestation causes yellowing and leaf shedding, besides the production of abundant honeydew that drops on cars in parking lots and favors the presence of sooty mold that affects the photosynthesis and turn the trees unsuitable for landscaping (Allen 1992). Thus, it is necessary to obtain basic information for monitoring commercial nursery plants to reduce dispersion of the crapemyrtle aphid.
The objective of this study was to determine the distribution pattern of T. kahawaluokalani eggs on L.indica.
Material and Methods
The study was carried out on the Agronomy Science campus of the Universidade Federal do Paraná, in the city of Curitiba (25º25’04’’S, 40º14’30’’W, 945 m a.s.l.), Paraná State, Brazil. It is an urban area where L. indica trees are used as shade and ornamental trees. The trees in the area were examined for more than one year to follow the species complete life cycle to determine the best period of the year and plant phenology stage for egg searching for this particular experiment.
In the early winter 2001, when the trees were leafl ess because of natural shedding during fall and no aphids were found, ten trees of L.indica belonging to each of two age groups were randomly sorted from the area and examined for eggs. The group of 5-10 year-old trees had never been pruned, while the 20-30 year-old trees had been pruned the year before. Four branches in each cardinal position measuring 80 cm from the apex were randomly cut from each tree group. The material was taken to the laboratory where they were cut into eight segments, each 10 cm long, and examined under a stereomicroscope. The diameter (mm) at the middle of each piece was measured with a caliper and the number of eggs was counted. The size of the branches was defi ned based on the distribution of the T. kahawaluokalani colonies on the plant. This aphid species feeds on the underside of the L.indica leaves that are mainly on the terminal portion of the branches.
The number of eggs (y) on each branch segment was transformed using log (y + 1) and submitted to variance analysis, and the means were compared by the Tukey test at 5% (P < 0.05).
A longitudinal regression model was chosen to describe the egg distribution because the data (number of eggs along the branch) consisted of multiple measurements on the same experimental unit, according to the criteria mentioned by Littellet al. (1996). The data were modeled based on a normal distribution on logarithmic scale (base e).
The notation used to defi ne the longitudinal regression model was as follows:
g index of group: “20-30 year-old trees” and “5-10 year-old trees ”
i index of tree: 1, ... 10 j index of branch: 1, ... 4
d distance, in cm, from each segment to the apex using the middle diameter of the segment for adjusting the model: 5, 15, 25, 35, 45, 55, 65 and 75.
Then, Ygijdis the number of eggs for the distance d along thej-th branch, of i-th tree, belonging to the g-th group. The indicesi and j are not unique, but a combination of the values ofg,i,j and d identify each observation in a unique way.
The fi xed regression coeffi cients (Eg0,Eg1,Eg2) were estimated for both age groups and predicted the random regression coeffi cients (Dg0,i,D1,gi,Dg2,i) for the i-th tree of the g-th group and the random regression coeffi cients (Jg0,i,j,Jg1,i,j ,Jg2,i,j) for the j-th branch of the i-th tree of the g-th group.
According to the longitudinal regression model:
g
ijd =
Υ 0 1 d 2 d2
g g g ⋅ + ⋅
+β β
β 2 , 2 , 1 ,
0 d d
g i g
i g
i + ⋅ + ⋅
+α α α
2 , , 2 , , 1 , ,
0 d d
g j i g j i g j
i + ⋅ + ⋅
+γ γ γ
d j i
g,,,
ε +
with (Dg0,i,Dg1,i,Dg2,i) ~ N3(6D) and (Jg0,i,j,Jg1,i,j,Jg2,i,j) ~ N3 (6J), where N3 is the multivariate normal distribution, implying that the D’s, J’s and H’s are independent. The right side is a quadratic curve indexed by g for the identifi cation of the group where the random effects represent the nature of the tree (D’s) and that of the branch (J’s).
Alternatively, the above regression model may be written as:
g
ijd =
Υ (β0g +αg0,i +γ0g,i,j) ) d
g g
j i i
g + + ⋅
+(β1 α1, γ1,, ( 2, 2, 2.. ) d2
g j i g i g
j + + ⋅
+ β α γ
d j i
g,,,
ε +
Thus, each term in the model with the random coeffi cients results from the sum of three elements: the fi xed part of the population (the two age groups) and the random parts of the tree and of the branch.
Mean number of eggs95% C.I. Cardinal position
20-30 year-old trees 5-10 year-old trees Sum of both age groups
North 47.313.35 a 43.012.76 a 45.19.21 a
South 92.416.80 b 36.217.82 a 64.312.97 a
East 78.419.31 b 62.839.36 a 70.621.88 a
West 80.122.66 b 47.721.99 a 63.915.94 a
Total 74.59.31 A 47.412.52 B 61.07.87
theD’s in the equation below:
2 , 2 ,
1 , 0 2 2 1
0 d d d d
g i g
i g
i g
g
g+β ⋅ +β ⋅ +α +α ⋅ +α ⋅
β
The estimation of the parameters (E’s) was performed using the method of Maximum Likelihood and the prediction of the random effects (D’s e J’s) by a Bayesian approach.
Variations of the model were considered by testing all regression curves for the number of eggs along the branch for each age group. Besides the fi xed coeffi cients, polynomial random coeffi cients up to the third grade for trees and branches were tested.
The position of the branch (North, South, East and West) was investigated after the adjustment of the fi nal model based on the tests of the effect of the branches represented by the J’s and by the Hotelling T2 test and by variance analysis.
The estimation of the population coeffi cient and the signifi cance tests followed the steps of the program S-PLUS (Version 6.0).
Results and Discussion
Thefi rst males and oviparous females appeared by early fall, when L. indica was at the end of fruiting season and starting the senescence stage with the leaves changing color and shedding. The average temperature was about 20oC and photophase of 11½ h. When the majority of trees were leafl ess, the eggs were already laid on the branches and no adults or nymphs were observed. Patti et al. (1984), studying
the biology of T.kahawaluokalani in Europe, noticed that the oviparous females start laying eggs by the fourth day of adulthood and keep it along the fall season, but they did not study egg distribution on the plants.
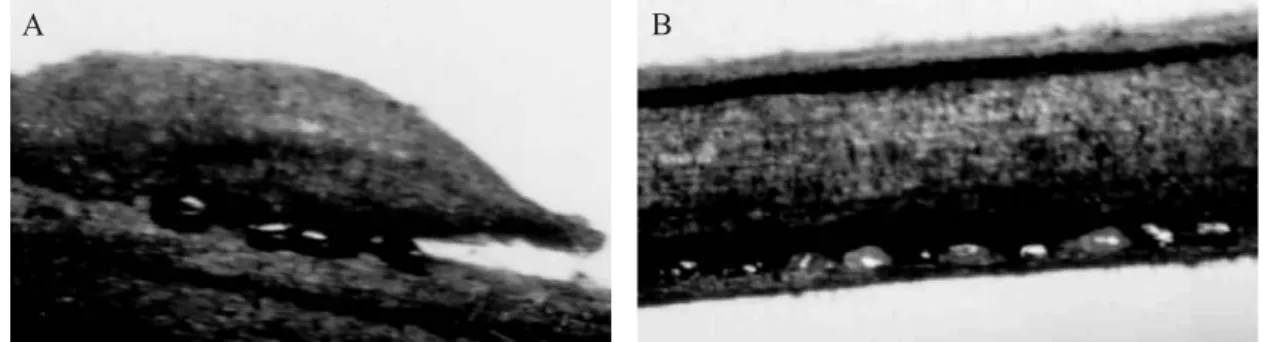
The newly deposited eggs are yellowish, but turn shiny black and maintain this color along the winter until they hatch in early spring. The non-fertilized eggs are yellow and shrunk. The eggs are laid on the buds, under crevices on thin branches or under the bark and bifurcations of thicker branches (Fig. 1). The shape, color, and places where the T. kahawaluokalani eggs were laid, as observed here, match with the data presented by Patti et al. (1984) and Alverson & Allen (1992). The number of eggs varied in the different niches probably in function of the size of the parental population and of the most favorable oviposition site rather than to a random grouping tendency, contrary to the observations by Alverson & Allen (1991), who mention that the eggs are frequently laid in irregular groups of about four eggs.
A total of 39,018 eggs of T.kahawaluokalani were counted on all branches of L.indica evaluated, 61% were on the 20-30 year-old trees and 39% on the 5-10 year-old group. Egg distribution was more homogeneous on the 5-10 year-old trees than on older plants, where the number of eggs was signifi cantly lower on the apical 20 cm (Table 1 and Fig. 2).
T.kahawaluokalani lays eggs, preferentially, on the middle of the branch, from 40 cm to 60 cm from the apex, where one canfi nd about 53% and 47% of the eggs, respectively, on the older and younger trees. Alverson & Allen (1992) found that Fig. 1. Winter eggs of T. kahawaluokalanilaid on the buds (A) and crevices of the bark (B) on branches of L. indica. Curitiba, PR, Brazil, winter 2001.
A B
Means followed by the same small letter in the columns for the four positions and the same capital letters in the line for the total number in the age groups did not differ signifi cantly by the Tukey test at 5%. Data transformed in log (y +1).
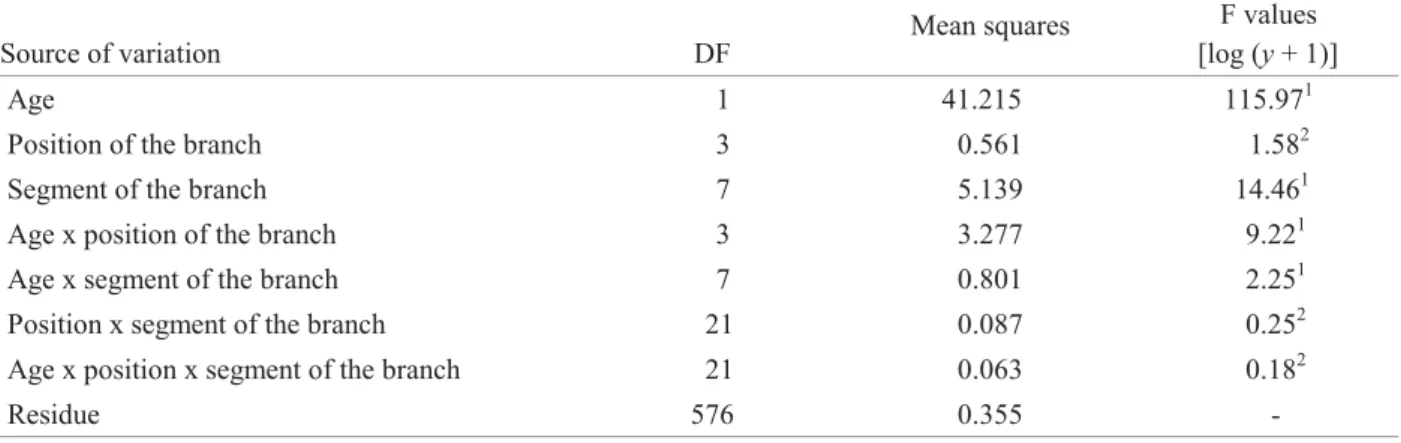
1signi
fi cant at 5% of probability
2non signifi cant
Table 2. Variance analysis comparing the effect of age, position of the branch on the plant and segment of the branch of L. indica on the distribution of T. kahawaluokalani eggs. Curitiba, PR, Brazil, winter 2001.
Fig. 2. Mean number of T. kahawaluokalani eggs on branches of L. indica, considering two age groups. Curitiba, PR, Brazil, winter 2001.
Log (number of eggs + 1)
Segment of branch (cm) 1.8
1.6
1.4
1.2
1.0
0.8
0.6
10 20 30 40 50 60 70 80
20-30 years-old 5-10 years-old 2.0
2.2
54% of the eggs of T.kahawaluokalani are laid on the apical 40 cm of the 5 year-old L. indica branches in South Carolina, different from the present study where the eggs concentrate on the middle of the branch. Considering these results, it can be inferred that the branches of L. indica pruned and used as grafting and for plant propagation can support and may contribute to the dispersion of T.kahawaluokalani. Besides, this information about egg distribution pattern can be used to direct plant monitoring in commercial nurseries.
The position of the branch on the plant and the interactions position x segment of the branch and age x position x segment were not signifi cant when all branches were analyzed (Table 2). The range of the mean number [log (y+1)] of eggs was from 45.1 to 70.6 on the branches in the four positions considering the two age groups (Table 1).
On the other hand, the interactions of age x branch position show signifi cant effect on egg distribution (Table 2). Only the branches at the North quarter of the 20-30 year-old trees presented a signifi cant lower number than that on the other quarters that were not signifi cant different among them (Table 1). The Hotelling T2test confi rmed these results when the two age groups were analyzed together (Table 3). Based on the T2 values and respective P-values, the null hypothesis cannot be rejected because the variable number of eggs in the different positions has a mean equals zero what indicates that the T. kahawaluokalani eggs are distributed equally on the branches of L. indica in all cardinal positions (Fig. 3). For the longitudinal regression model, the outlier values were eliminated, meaning the 10 cm branch segments that had more than 400 eggs. The diameter of the middle part of the
Source of variation DF
The estimated population coeffi cients and the signifi cance tests used to evaluate the model are presented on Table 4. The intercept of the curves for both age groups did not present signifi cant difference (P-value = 0.986) what indicates that the egg distribution on the apical part of the branch is similar for both groups. On the other hand, all other parameters were statistically different for both age groups. The negative estimation of the quadratic coeffi cient (-0.000869) indicates that the curves for both tree groups are concave despite the fact that the egg distribution pattern along the branch was different in each group.
The estimated curves represent the tendency towards the logarithm of the egg number + 1 along the branch in each group. The equations that describe the egg distribution curves on the 80 cm branch appear on Fig. 4.
The egg distribution pattern on the branch obtained with the regression model corroborates the results of the variance analysis (Figs. 2 and 4). The results confi rm that the number ofT. kahawaluokalani eggs is greater on the middle part (40-60 cm from the apex) of the branches of 20-30 year-old L. Table 3. Hotelling T2 values and p-values for the number
of T. kahawaluokalani eggs on the cardinal positions of branches of L. indica. Curitiba, PR, Brazil, winter 2001.
Cardinal position T2 P-values F-values
Fig. 3. Mean number of T. kahawaluokalani eggs on branches of the four cardinal positions of L. indica, considering two age groups 20-30 and 5-10 year-old trees. Curitiba, PR, Brazil, winter 2001.
Log (number of eggs + 1)
Segment of branch (cm) 1.8
1.6
1.4
1.2
1.0
0.8
0.6
10 20 30 40 50 60 70 80
North South East West
Table 4. Estimated population coeffi cients and the signifi cance data for the longitudinal model for the distribution of T. kahawaluokalani eggs on branches of L. indica considering two age groups 20-30 and 5-10 year-old trees. Curitiba, PR, Brazil, winter 2001.
Effects Estimated values Standard deviation DF T-values P-values branch segments presented a high positive correlation with its
Fig. 4. Estimated curves representing the mean tendency for the log of the number of eggs of T.kahawaluokalani on 80 cm of branches of L.indicaof two age groups. Curitiba, PR, Brazil, winter 2001.
Number estimated of eggs (log y + 1)
2.0
2.5 3.0 3.5 4.0
Log (eggs +1) = 1.508797 + 0.11245d− 0.001106d2
Log (eggs +1) = 1.508797 + 0.058116d− 0.000632d2 20 -30 years - old
5- 10 years -old
10 20 30 40 50 60 70
Number of eggs (original scale)
6.4 11.2 19.1 32.1 53.6
Distance from the apex (cm)
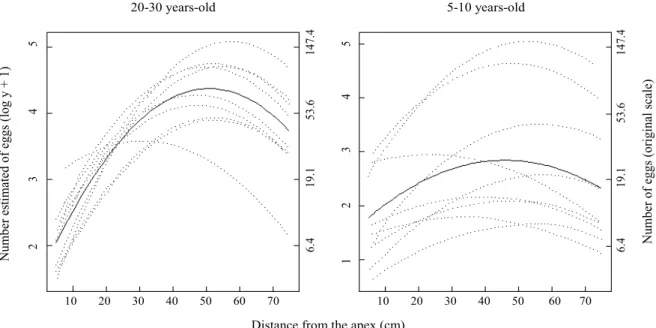
Fig. 5. Estimated curves representing the mean tendency for the log of the number of eggs of T.kahawaluokalani on 80 cm of branches of all sampled trees of L.indica of two age groups. Curitiba, PR, Brazil, winter 2001.
20-30 years-old 5-10 years-old
Distance from the apex (cm)
Number of eggs (original scale)
Number es
ti
mated of eggs
(log y + 1)
10 20 30 40 50 60 70 10 20 30 40 50 60 70
2 3 4 5
1 2 3 4 5
6.4 19.1 53.6 147.4 6.4 19.1 53.6 147.4
indica trees where about 53% of the eggs are laid. On 5-10 year-old trees about 58% of the eggs are laid on 30-60 cm from the apex.
According to the model, the individual curves for the trees are centered around the curve determined for the group showing the variability on the egg distribution pattern
(0.03452 and 0.03642, respectively). The variance of the residue (0.4772) represents a substantial residual variance that is not attributed to the age group, neither to the nature of the tree or of the branch. However, it should be considered that the egg distribution of T. kahawaluokalani on L. indica is surely infl uenced by other factors, such as the population dynamics and climate conditions that should be included in future studies to better explain this event.
Based on the results of this research, we conclude that the longitudinal regression model is an useful tool to demonstrate the tendency of distribution of the T. kahawaluokalani eggs onL. indica, mainly on the middle part of the branches, independently of plant age or position of the branch on the tree.
Acknowledgments
This is contribution nº 1620 of the Departmento de Zoologia of the Universidade Federal do Paraná. We are thankful to Dr. Clarice Azevedo Luna Freire who helped with the mathematical model. To CNPq for the fellowship granted to the fi rst author.
References
Alverson, D.R. & R.K. Allen. 1992. Bionomics of the crapemyrtle aphid (Homoptera: Aphididae). J. Entomol. Sci. 27: 445-457.
Blackman, R.L. & V.F. Eastop. 1994. Aphids on the world’s tree – An identifi cation and information guide. Wallingford, CBA International, 987p.
Cabbete, H.S.R. 1995. Ocorrência de formas gâmicas e ambifásicas deSchizaphis graminum (Rondani) (Homoptera: Aphididae)
em criação de campo e laboratório em São Paulo, Brasil. Revta. Bras. Zool. 12: 655-662.
Costa, C.L., V.F. Eastop & A.S. Costa. 1972. A list of aphids species (Homoptera: Aphidoidea), collected in São Paulo, Brazil. Revta. Peruana Entomol. 15: 131-134.
Dixon, A.F. 1985. Structure of aphid populations. Ann. Rev. Entomol. 30: 155-174.
Lazzarotto, M.C. & S.M.N. Lazzari. 2005. Análise faunística de afídeos (Hemiptera, Aphididae) na Serra do Mar, Paraná, Brasil. Revta. Bras. Entomol. 49: 270-274.
Littell, R.C., A.G. Milliken, W.W. Stroup & R.D. Wolfi nger. 1996. SAS system for mixed models. Cary, 633p.
Menezes, M. 1970. Reprodução sexuada de Aphis spiraecola Patch, 1914 no estado de São Paulo (Homoptera: Aphididae). Biológico 36: 53-57.
Moran, N.A. 1992. The evolution of life cycle. Ann. Rev. Entomol. 37: 321-348.
Patti, I., R.G. Spampinato & M.G. Tornatore. 1984. Note morfologiche e bio-ecologiche sull´afi de della Lagerstroemia, Tinocallis kahawaluokalani (Kirk.) (Rhynchota: Aphidoidea). Phytophaga 2: 87-116.
Rotta, E., F.R. Tavares & V.A. Sousa-Lang. 1996. Produção de mudas por estaquia de Lagerstroemia indica. Comunicado Técnico – Embrapa/Centro Nacional de Pesquisa de Florestas, Nº 11, 3p.