The Importance of a Normal ECG in non-ST Elevation Acute Coronary
Syndromes
Rogério Teixeira, Carolina Lourenço, Natália António, Sílvia Monteiro, Rui Baptista, Elisabete Jorge,
Maria João Ferreira, Pedro Monteiro, Mário Freitas, Luís A Providência
Cardiology Department, Coimbra University Hospitals and Medical School, Coimbra, Portugal
Abstract
Background: Admission ECG has a major impact on the diagnosis and management of non-ST elevation acute coronary syndromes (ACS).
Purpose: To assess the impact of the admission ECG on prognosis over non-ST ACS.
Population: Prospective, continuous, observational study of 80 non-ST ACS patients from a single center. Patients were divided in groups: A (n=58) – Abnormal ECG and B (n=64) – Normal ECG. Normal ECG was synonymous of sinus rhythm and no acute ischemic changes. A one-year clinical follow up was performed targeting all causes of mortality and the MACE rate.
Results: Group A patients were older (68.7±.7 vs. 6.4±.7Y, p<0.00), had higher Killip classes and peak myocardial necrosis biomarkers. Furthermore, they had lower left ventricular ejection fraction (LVEF) (5.0±0.55 vs. 55.4± 9.5%, p<0.00), glomerular filtration rate, initial hemoglobin, and total cholesterol levels. Group B patients were more frequently submitted to invasive strategy (6.6 vs. 46.5%, p<0.00) and treated with aspirin, clopidogrel, beta blockers and statins. They also more often presented normal coronary anatomy (6. vs. 8.0%, p=0.45). There was a trend to higher in-hospital mortality in group A (4.6 vs. .9%, p=0.054). Kaplan-Meyer analysis showed that at one month and one year (95. vs. 89.5%, p=0.0) survival was higher in group B and the result remained significant on a Cox regression model (normal ECG HR 0.45 (0. – 0.97). There were no differences regarding the MACE rate.
Conclusion: In our non-ST elevation ACS population, a normal ECG was an early marker for good prognosis. (Arq Bras Cardiol 00; 94() : 4-)
Key Words: Electrocardiography; Diagnostic; Reference Standards; Prognosis.
Introduction
TheECG represents one of the most important tools in acute coronary syndromes (ACS), differentiating two clinical entities, the ST-elevation and the non-ST elevation ACS, with consequent different management strategies. It remains at the present time an inexpensive, readily available and non-invasive test.
ST-segment depression and T wave changes are electrical markers of unstable coronary artery disease1,2.
According to two risk score analysis for non-ST elevation ACS, ECG variables were an important tool. In TIMI (Thrombolysis In Myocardial Infarction) risk score, an ECG binary variable, the presence or absence of ST depression, was a risk factor for a composite result of death or ischemic events, around 14 days after the ACS3, and in the GRACE (Global
Mailing Address: Rogério Teixeira •
Quinta da Portela, Condominio Zen, lote 3, apt. 332 - 3000-050 – Coimbra, Portugal
E-mail: [email protected]
Manuscript received October 27, 2008; revised manuscript received Febru-ary 07, 2009; aceito em 08/05/09.
Registry of Acute Coronary Events) score, ECG remained at six months an independent predictor for overall mortality4.
The number of leads with ST depression and the magnitude of ST depression on the admission ECG correlated with the severity of ischemia, and was a marker for a worse outcome, as reported by Holmvang et al5in the FRISC II (Fragmin and Fast Revascularization During Instability in Coronary Artery Disease) sub-analysis5.
ST depression was a relatively frequent finding in ACS patients, as almost 40% of a total of 55.000 patients in the Crusade registry presented this ECG abnormality6. Although there are doubts regarding the value of T wave inversion as a marker of ischemia, it has been acknowledged that anterior deep symmetrical T wave inversion was a marker for disease on the left anterior descending artery or main stem territory, as reported by Zwann et al7. Holmvang et al5 concluded that in addition to the female gender, ST depression and T wave inversion in five leads were independent predictors of death or re-infarction, 30 days after randomization, in the TRIM (Thrombin Inhibition In Myocardial Ischemia) sub-study5.
for an invasive strategy in the presence of presumably new ST depression (not T wave inversion) on the admission ECG8,9.
On the other hand, a normal ECG does not exclude an ACS, as previously reported by McCarthy et al, as almost 5% of patients discharged from the emergence room with a normal ECG had an acute ischemic event10.
In this context, we decided to analyze, in a single center coronary care unit, the prognostic value of a normal ECG in non-ST elevation ACS patients.
Population and methods
Study population
The present study was a continuous, observational, and prospective analysis of 1459 consecutive admissions for ACS, between May 2004 and December 2006, on a single coronary care unit. We excluded 130 records as they were readmissions. The final population consisted of 1329 patients. Of these, we selected 802 patients with a diagnosis of unstable angina or non-ST elevation acute myocardial infarction. The remaining population consisted of 445 patients with ST-elevation ACS, and 37 with a paced electrical rhythm ACS. Forty five patients were eliminated due to incomplete data.
Non-ST elevation acute myocardial infarction was defined by the presence of ischemic chest pain lasting more than five minutes, and positive cardiac biomarkers (troponin I) with or without ECG ischemic changes (namely ST depression or T wave inversion).
Unstable angina was defined either by new onset angina (at least class III CCS), progressive angina, or angina at rest, with or without ECG ischemic changes.
We analyzed standardized records during admission that included demographic, clinical, electrical, echocardiographic and laboratorial data. Medical therapy, catheterization data, in-hospital course and discharge medication were also recorded.
The population was divided in two groups, based on the admission ECG. Group A included 538 patients that presented an abnormal ECG; group B included 264 patients that presented a normal ECG. An abnormal ECG had at least one of the following changes: atrial fibrillation, ST depression, ST elevation, T wave inversion, or “de novo” bundle branch block.
This investigation conforms to the principles outlined in the Declaration of Helsinki. The protocol wasapproved by our institutional ethics committee, and all patientsgave written informed consent to participate in the study.
ECG analysis
ST depression had to be at least 1 mm in two contiguous leads to be considered and it was measured 60 ms after the J point. ST elevation had to be at least 2 mm in lead V1-V2 to be considered and 1 mm in any other lead, with the duration of at least 0.08 s. ST depression was not considered in the presence of left ventricular hypertrophy with strain, bundle branch block, paced rhythms, or if they were present on a
previous ECG; T wave inversion had to be also at least 1 mm, and all leads were considered except aVR.
Sinus rhythm was defined by the presence of a positive P wave in I, II, and aVL and negative in aVF, with an axis in the frontal plane between 0º and +90º. Atrial fibrillation was defined by an “irregularly irregular” ventricular rhythm, with associated f waves (irregular baseline undulation with variable amplitude, with a rate of 350 – 600/min).
Left bundle branch block (LBBB) was identified by a typical QRS morphology (R in V6, qRS in V1) with a duration superior to 120 ms, and right bundle branch block was defined by a QRS greater than 120 ms and a RsR’ pattern in V1.
The ECG considered for the analysis was the one performed at the admission in the emergency room, or in the coronary care unit, previous to the start of the treatment.
Electrocardiographic characteristics were classified as “de novo” if they were not present in the most recent electrocardiogram before presentation, or if there was no prior electrocardiogram available. An abnormal ECG was considered in the presence of at least one ischemic change, bundle branch block or atrial fibrillation.
Pace rhythm was not contemplated in this analysis and the presence of Q waves were not considered either, due to missing data in the database.
Follow up
We performed a median clinical follow up of 19 months after hospital discharge. The information was collected by phone call, from hospital records or at the outpatient clinic. The primary endpoints were all-cause mortality and the combined result of cardiovascular death, non-fatal myocardial infarction, re-admission for unstable angina, and unscheduled percutaneous coronary intervention – MACE. We also recorded the occurrence of acute myocardial infarction, re-admission for heart failure and stroke.
Statistical Analysis
Continuous data are presented as mean and standard deviation and compared with the Student t-test. Categorical variables are reported as frequencies and percentages, and the χ2 or the exact Fisher tests were used when appropriate to compare them.
The cumulative survival curves were constructed with the use of the Kaplan-Meier method and groups were compared with the Log rank test. The observational period started at hospital discharge and lasted for one year.
A multivariate Cox regression analysis was performed for the all-cause mortality endpoint at the end of the first year. Variables that were significant at the bivariate level or that had a clinical relevance were included in the model.
Results
Baseline characteristics
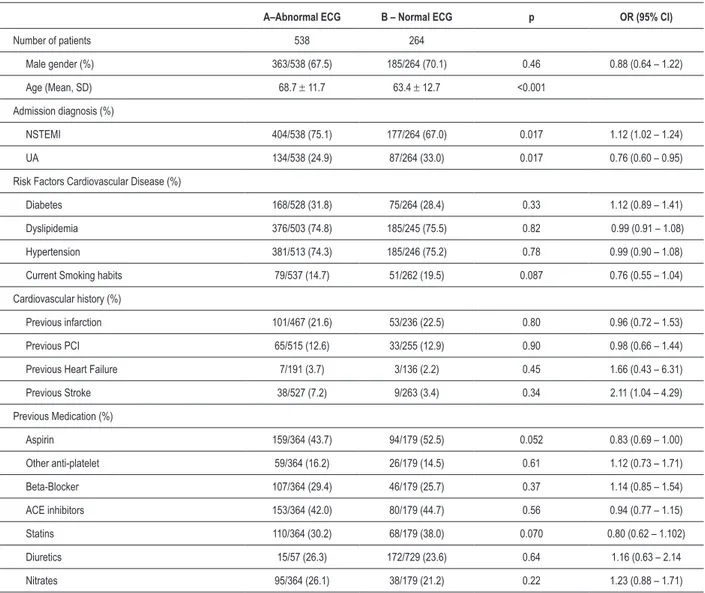
Table 1 presents baseline characteristics for both groups. We observed that patients with a normal ECG were younger (63.4±12.7 vs. 68.7±11.7 years, p<0.001), and more often admitted due to unstable angina (33.0 vs. 24.9 %, p=0.017). There were no significant differences with respect to risk factors for cardiovascular disease, cardiovascular history and previous medication.
Hemodynamic, electrical and laboratory data
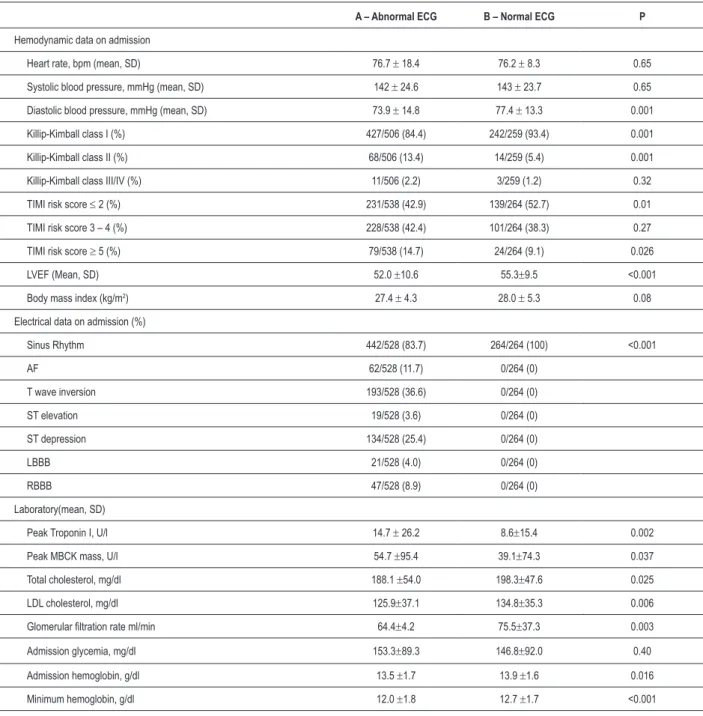
This data is presented in Table 2. Normal ECG patients were more often at lower Killip Kimball classes at admission, had a lower risk profile, and had a higher left ventricular ejection fraction (LVEF) (55.3±9.5 vs. 52.0±10.6%, p<0.001).
Regarding rhythm, 83.7 % of group A patients were in sinus rhythm. The most frequent ischemic finding was T wave inversion (36.6%), as ST depression was only present in a ¼ of patients. An admission left bundle branch block was present in 8.9% of them.
Abnormal ECG patients also had a higher peak value of cardiac biomarkers, lower glomerular filtration rate (assessed by the Cockroft et Gault formula), and lower minimum hemoglobin during hospital stay.
In-Hospital Management
Sixty-three percent of normal ECG patients compared to 46.5% of abnormal ones were submitted to an invasive strategy during admission (p<0.001) – Table 3.
Aspirin, clopidogrel, statins and beta-blockers were more frequently used in normal ECG patients, whereas abnormal
Table 1 - Baseline Characteristics
A–Abnormal ECG B – Normal ECG p OR (95% CI)
Number of patients 538 264
Male gender (%) 363/538 (67.5) 185/264 (70.1) 0.46 0.88 (0.64 – 1.22)
Age (Mean, SD) 68.7 ± 11.7 63.4 ± 12.7 <0.001
Admission diagnosis (%)
NSTEMI 404/538 (75.1) 177/264 (67.0) 0.017 1.12 (1.02 – 1.24)
UA 134/538 (24.9) 87/264 (33.0) 0.017 0.76 (0.60 – 0.95)
Risk Factors Cardiovascular Disease (%)
Diabetes 168/528 (31.8) 75/264 (28.4) 0.33 1.12 (0.89 – 1.41)
Dyslipidemia 376/503 (74.8) 185/245 (75.5) 0.82 0.99 (0.91 – 1.08)
Hypertension 381/513 (74.3) 185/246 (75.2) 0.78 0.99 (0.90 – 1.08)
Current Smoking habits 79/537 (14.7) 51/262 (19.5) 0.087 0.76 (0.55 – 1.04)
Cardiovascular history (%)
Previous infarction 101/467 (21.6) 53/236 (22.5) 0.80 0.96 (0.72 – 1.53)
Previous PCI 65/515 (12.6) 33/255 (12.9) 0.90 0.98 (0.66 – 1.44)
Previous Heart Failure 7/191 (3.7) 3/136 (2.2) 0.45 1.66 (0.43 – 6.31)
Previous Stroke 38/527 (7.2) 9/263 (3.4) 0.34 2.11 (1.04 – 4.29)
Previous Medication (%)
Aspirin 159/364 (43.7) 94/179 (52.5) 0.052 0.83 (0.69 – 1.00)
Other anti-platelet 59/364 (16.2) 26/179 (14.5) 0.61 1.12 (0.73 – 1.71)
Beta-Blocker 107/364 (29.4) 46/179 (25.7) 0.37 1.14 (0.85 – 1.54)
ACE inhibitors 153/364 (42.0) 80/179 (44.7) 0.56 0.94 (0.77 – 1.15)
Statins 110/364 (30.2) 68/179 (38.0) 0.070 0.80 (0.62 – 1.102)
Diuretics 15/57 (26.3) 172/729 (23.6) 0.64 1.16 (0.63 – 2.14
Nitrates 95/364 (26.1) 38/179 (21.2) 0.22 1.23 (0.88 – 1.71)
Table 2 - Hemodynamic, electrical and laboratory data
A – Abnormal ECG B – Normal ECG P
Hemodynamic data on admission
Heart rate, bpm (mean, SD) 76.7 ± 18.4 76.2 ± 8.3 0.65
Systolic blood pressure, mmHg (mean, SD) 142 ± 24.6 143 ± 23.7 0.65
Diastolic blood pressure, mmHg (mean, SD) 73.9 ± 14.8 77.4 ± 13.3 0.001
Killip-Kimball class I (%) 427/506 (84.4) 242/259 (93.4) 0.001
Killip-Kimball class II (%) 68/506 (13.4) 14/259 (5.4) 0.001
Killip-Kimball class III/IV (%) 11/506 (2.2) 3/259 (1.2) 0.32
TIMI risk score ≤ 2 (%) 231/538 (42.9) 139/264 (52.7) 0.01
TIMI risk score 3 – 4 (%) 228/538 (42.4) 101/264 (38.3) 0.27
TIMI risk score ≥ 5 (%) 79/538 (14.7) 24/264 (9.1) 0.026
LVEF (Mean, SD) 52.0 ±10.6 55.3±9.5 <0.001
Body mass index (kg/m2) 27.4 ± 4.3 28.0 ± 5.3 0.08
Electrical data on admission (%)
Sinus Rhythm 442/528 (83.7) 264/264 (100) <0.001
AF 62/528 (11.7) 0/264 (0)
T wave inversion 193/528 (36.6) 0/264 (0)
ST elevation 19/528 (3.6) 0/264 (0)
ST depression 134/528 (25.4) 0/264 (0)
LBBB 21/528 (4.0) 0/264 (0)
RBBB 47/528 (8.9) 0/264 (0)
Laboratory(mean, SD)
Peak Troponin I, U/l 14.7 ± 26.2 8.6±15.4 0.002
Peak MBCK mass, U/l 54.7 ±95.4 39.1±74.3 0.037
Total cholesterol, mg/dl 188.1 ±54.0 198.3±47.6 0.025
LDL cholesterol, mg/dl 125.9±37.1 134.8±35.3 0.006
Glomerular iltration rate ml/min 64.4±4.2 75.5±37.3 0.003
Admission glycemia, mg/dl 153.3±89.3 146.8±92.0 0.40
Admission hemoglobin, g/dl 13.5 ±1.7 13.9 ±1.6 0.016
Minimum hemoglobin, g/dl 12.0 ±1.8 12.7 ±1.7 <0.001
AF – atrial ibrillation; LBBB – left bundle branch block; RBBB – right bundle branch block; LVEF – left ventricular ejection fraction ECG patients were more frequently prescribed diuretics and
nitrates 24 hours after admission.
At discharge there were no differences between groups with the exception of beta-blockers, which were more often used in group B patients.
Cath Lab Data
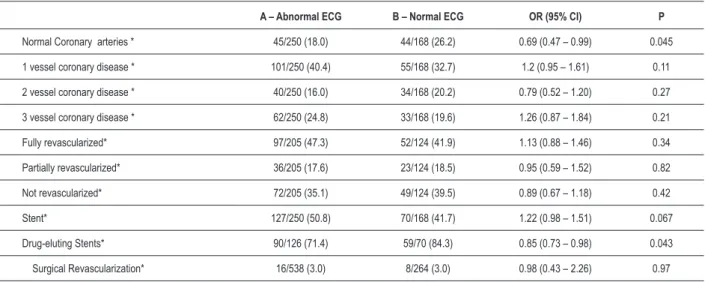
Normal ECG patients had a higher rate of a normal coronary angiogram (26.2% vs. 18.0%, p=0.045) – Table 4.
There were no differences with respect to the anatomic lesions and the rate of percutaneous revascularization. When a percutaneous coronary intervention was performed, group B patients were more often treated with a drug-eluting stent.
Outcome
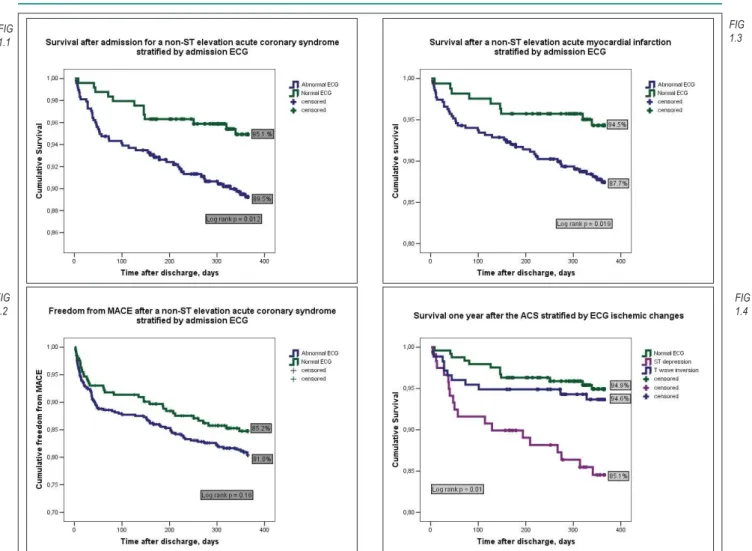
There was a trend for a higher in-hospital mortality among abnormal ECG patients (4.6 vs. 1.9%, p=0.054), which became significant at 30 days and at one year after the ACS (Figure 1.1).
The MACE rate at one year was not significantly different for both groups (18.9 vs. 14.8%, p=0.16), although there were also a trend for a worse outcome for abnormal ECG patients (Figure 1.2).
By the end of the first year, abnormal ECG patients had a higher re-infarction and re-admission for heart failure rate - Table 5.
If we analyzed solely the group of patients with a non-ST elevation acute myocardial infarction, we observed that the stratification proposed for the normal ECG patients remained significant for the overall survival at one year (87.7 vs. 94.5%, log rank p = 0.019) (Figure 1.3)
If we selected only the patients with ST depression or T wave inversion and compared them to the normal ECG ones, we observed that the survival curve for the T wave inversion patients was similar to the normal ECG patients, but the ST depression patients had a worse outcome (Figure 1.4).
Table 3 - In Hospital management:
In the irst 24 hours Medication at discharge
n = 538 n = 264 n= 513 n= 259
Group A Abnormal ECG Group B Normal ECG p Group A Abnormal ECG Group B Normal ECG p
Invasive Strategy (%) 250/538 (46.5) 168/264 (63.6) <0.001
Gp IIb/IIIa inhibitors (%) 264/538 (49.1) 138/264 (52.3) 0.39
Levosimendan (%) 11/538 (2.0) 3/264 (1.1) 0.36
Diuretic (%) 184/538 (34.2) 49/264 (18.6) <0.001
ASA (%) 505/538 (93.9) 257/264 (97.3) 0.03 428/513 (83.4) 215/259 (83.0) 0.88
Clopidogrel (%) 337/538 (62.6) 186/264 (70.5) 0.029 173/513 (33.7) 101/259 (39.0) 0.15
Beta Blockers (%) 415/538 (77.1) 232/264 (87.9) <0.001 365/513 (71.2) 206/259 (79.5) 0.012
ACE inhibitors (%) 481/538 (89.4) 244/164 (92.4) 0.17 431/513 (84.0) 218/259 (84.2) 0.96
Statins(%) 523/538 (97.2) 263/264 (99.6) 0.022 484/513 (94.3) 238/259 (91.9) 0.19
Nitrates (%) 259/538 (48.1) 103/264 (39.0) 0.015
Gp – glycoprotein; ASA – acetyl salicylic acid; ACE – angiotensinogen converting enzyme;
Table 4 - Cath lab data
A – Abnormal ECG B – Normal ECG OR (95% CI) P
Normal Coronary arteries * 45/250 (18.0) 44/168 (26.2) 0.69 (0.47 – 0.99) 0.045
1 vessel coronary disease * 101/250 (40.4) 55/168 (32.7) 1.2 (0.95 – 1.61) 0.11
2 vessel coronary disease * 40/250 (16.0) 34/168 (20.2) 0.79 (0.52 – 1.20) 0.27
3 vessel coronary disease * 62/250 (24.8) 33/168 (19.6) 1.26 (0.87 – 1.84) 0.21
Fully revascularized* 97/205 (47.3) 52/124 (41.9) 1.13 (0.88 – 1.46) 0.34
Partially revascularized* 36/205 (17.6) 23/124 (18.5) 0.95 (0.59 – 1.52) 0.82
Not revascularized* 72/205 (35.1) 49/124 (39.5) 0.89 (0.67 – 1.18) 0.42
Stent* 127/250 (50.8) 70/168 (41.7) 1.22 (0.98 – 1.51) 0.067
Drug-eluting Stents* 90/126 (71.4) 59/70 (84.3) 0.85 (0.73 – 0.98) 0.043
Surgical Revascularization* 16/538 (3.0) 8/264 (3.0) 0.98 (0.43 – 2.26) 0.97
Table 5 - Outcomes in the hospital and 1 year after discharge:
A – Abnormal ECG B – Normal ECG OR (95% CI) p
Length of stay (days) 5.3 ± 3.0 5.2 ± 2.7 0.65
In-Hospital Mortality (%) 25/538 (4.6) 5/264 (1.9) 2.45 (0.95 – 6.34) 0.054
Overall Mortality 30 days (%) 13/476 (2.7) 1/244 (0.4) 6.66 (0.88 – 50.64) 0.033
Overall Mortality 6 months (%) 35/476 (7.4) 9/244 (3.7) 1.99 (0.97 – 4.08) 0.052
Overall Mortality 1 year (%) 50/476 (10.5) 12/244 (4.9) 2.14 (1.16 – 3.93) 0.011
MACE 1 year (%) 90/476 (18.9) 36/244 (14.8) 1.28 (0.90 – 1.83) 0.16
Cardiovascular mortality 1 year (%) 34/476 (7.1) 5/244 (2.0) 3.49 (1.38 – 8.80) 0.004
Re-Infarction 1 year (%) 42/476 (8.8) 11/244 (4.5) 1.96 (1.3 – 3.73) 0.036
Heart Failure 1 year (%) 38/491 (7.7) 8/247 (3.2) 2.39 (1.13 – 5.04) 0.017
Stroke 1 year (%) 11/484 (2.3) 4/246 (1.6) 1.34 (0.45 – 4.34) 0.56
MACE: major adverse cardiovascular endpoints; PCI: percutaneous coronary intervention
*Not programmed during hospital stay
Figure 1 – Meyer Curves. Fig. 1.1 – Meyer Curves – One year survival after a non-ST elevation ACS stratiied by admission ECG. Fig. 1.2 –
Kaplan-Meyer Curves – One year freedom from MACE after a non-ST elevation ACS stratiied by admission ECG. Fig. 1.3 – Kaplan-Kaplan-Meyer Curves – One year survival after a non-ST elevation acute myocardial infarction stratiied by admission ECG. Fig. 1.4 – Kaplan-Meyer Curves – One year survival after a non-ST elevation ACS, stratiied
by admission ECG ischemic changes. FIG
1.1
FIG 1.2
FIG 1.3
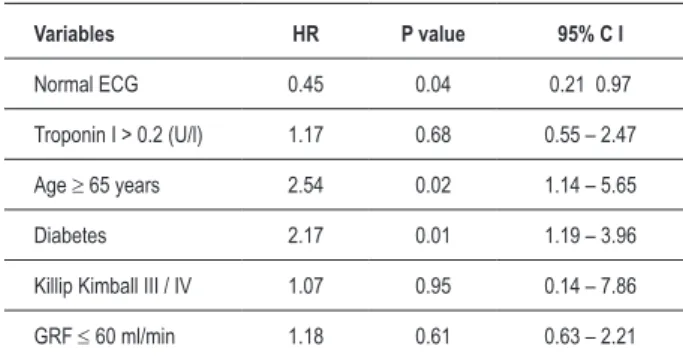
Table 6 - Multivariate Cox regression analysis for overall mortality at one year after the ACS
Variables HR P value 95% C I
Normal ECG 0.45 0.04 0.21 0.97
Troponin I > 0.2 (U/l) 1.17 0.68 0.55 – 2.47
Age ≥ 65 years 2.54 0.02 1.14 – 5.65
Diabetes 2.17 0.01 1.19 – 3.96
Killip Kimball III / IV 1.07 0.95 0.14 – 7.86
GRF ≤ 60 ml/min 1.18 0.61 0.63 – 2.21
Multivariate Analysis
The outcome for overall mortality at one year was adjusted according to a Cox regression model that included normal ECG, age over 65 years, glomerular filtration rate under 60 ml/min, troponin I over 0.20 U/L, previous diabetes and higher Killip class at admission (Table 6). This model showed an adjusted 55% relative risk reduction of death one year after the ACS for the patients with a normal ECG.
Discussion
When our data were compared to others published in the literature we observed a lower rate of ST-depression (16.7%), versus T-wave inversion (24.1%) for the global population. With respect to a sub-analysis from the GUSTO-IIb (Global Use of Strategies To Open Occluded Arteries in Acute Coronary Syndromes) study, of 12,142 randomized patients, 4263 (35.1%) had ST-depression, versus 2723 (22.4%) with T-wave inversion1. An even higher rate of ST depression was observed in a recent trial, the ICTUS (Invasive versus Conservative Treatment in Unstable Coronary Syndromes) study, in which almost 50% of the population had ST-depression at admission11. This difference could be explained, in our opinion, by the overall risk profile of the patients. To be eligible for the ICTUS trial, patients had to present positive cardiac biomarkers, and to be randomized to the GUSTO IIb trial, all the population needed to present a baseline ECG with ischemic changes. On the contrary, with respect to prognosis, our data seemed to be in agreement with those from the GUSTO trial, as ST-depression patients had a far worse outcome at 30 days, when compared to those with T-wave inversion.
With respect to atrial fibrillation, in our series, it was present in 7.7% of the overall population, which was a similar value when compared to recent data, such as the one reported by Lopes et al12.
Baseline Data
One of the first observations of our analysis was that we associated a normal ECG with good prognostic variables during an admission for a non-ST elevation ACS, such as younger age, male gender, higher left ventricular ejection fraction, better renal function and consequent lower TIMI risk scores. It was noteworthy in fact that these patients, although presenting a lower global cardiovascular risk, were more often admitted for an invasive strategy, which probably reflected the paradoxical management strategy for real-world patients, as previously reported by Zia et al13. We observed that a stress test was performed in 29.1% of the population, and this result had an obviously important impact on the treatment option (data not shown).
This lower risk translated, as expected, into a higher percentage of normal coronary angiograms (nearly a quarter of the total population). This is a high value when compared to data from higher-risk randomized controlled trials, but it was a similar value to that observed in the RITA 3 (Randomized Intervention Trial on unstable Angina) trial, where in a lower risk population, 28% of patients allocated for an invasive strategy had a normal coronary angiogram14.
Contrary to what was expected, our stratification does not seem to have influenced the MACE rate at the end of the first year. The present study had a small sample size of only 802 patients, with few events in the follow up, and consequent influence on prognosis. When data were separated with respect to the individual endpoints of the combined MACE result, both the cardiovascular mortality and the myocardial infarction rates remained significantly lower in the subgroup of patients with a normal ECG (Table V). Contrarily, the re-admission rates for unstable angina and the non-programmed coronary revascularization were higher among the normal ECG patients. The cause of this difference is difficult to explain, but it could be related to the higher rate of complications associated with an invasive procedure and the percutaneous revascularization, which have also been reported in the most recent randomized controlled trials over management strategy in non-ST elevation ACS11.
Risk Stratification
Risk stratification is a crucial step in ACS, with major implications on patient management and prognosis. Many risk scores and factors have been published in the literature during the last decade, to help attain a more precise clinical decision. ECG has been a longtime useful tool for understanding, at the electrical level, an ACS.
At the emergency department, we observed that in our population, 22 % of patients with a normal ECG will have a NSTEMI, which on a practical level forces the clinician to achieve a precise clinical and biochemistry characterization, considering that a normal ECG may not be such an innocent finding, after all. We consider that ischemic changes are dynamic and that they could have missed detection in our series of normal ECG patients due to logistic reasons, and so the 22% of patients may be over-represented.
1. Savonitto S, Adrisson D, Granger CB, Morando G, Prando MD, Mafrici A, et al. Prognostic value of the admission electrocardiogram in acute coronaryPrognostic value of the admission electrocardiogram in acute coronary syndromes. JAMA. 1999; 281: 707-13.
2. Cannon CP, MacCabe C, Stone PH, Rogers WJ, Schactman M, Thompson BW, et al. The electrocardiogram predicts one year outcome of patients with unstable angina and non Q wave myocardial infarction. J Am Coll Cardiol. 1997; 30: 133-40.
3. Antman EM, Cohen M, Bernick PJ, McCabe CH, Horacek T, Papuchis G, et al. The TIMI risk score for unstable angina / non ST elevation MI: a method for prognostic and therapeutic decision making. JAMA. 2000; 284: 835-42. 4. Eagle K, Lim M, Dabbous OH, Pieper KS, Goldberg RJ, Van de Werf F, et al, for
the GRACE investigators. A validated prediction model for all forms of acute coronary syndrome estimating the risk of 6-month postdischarge death in an international registry. JAMA. 2004; 291: 2727-33.
5. Holmvang L, Clemmensen P, Lindahl B, Lagerqvist B, Venge P, Wagner G, et al. Quantitative analysis of the admission electrocardiogram identifies patients with unstable coronary artery disease who benefit the most from early invasive treatment. J Am Coll Cardiol. 2003; 41 (6): 905-15.
6. Ryan J, Peterson E, Chen A, Roe M, Ohman M, Cannon C, et al. for the Crusade Investigators. Optimal timing of intervention in non-ST-segment elevation acute coronary syndromes: insights from the CRUSADE (Can Rapid risk stratification of Unstable angina patients Suppress ADverse outcomes with Early implementation of the ACC/AHA guidelines) Registry. Circulation. 2005; 112 (20): 3049-57.
7. Zwann C, Bar F, Janssen JH, Cheriex EC, Dassen WR, Brugada P, et al. Angiographic and clinical characteristics of patients with unstable angina showing an ECG pattern indicating critical narrowing of the proximal LAD coronary artery. Am Heart J. 1989; 117: 657-65.
References
8. Anderson JL, Adams CD, Antman EM, Bridges CR, Califf RM, Casey DE Jr, et al. ACC/AHA 2007 Guidelines for the Management of Patients With Unstable Angina/Non-ST-Elevation Myocardial Infarction: A Report of the American College of Cardiology/American Heart Association Task Force on Practice Guidelines (Writing Committee to Revise the 2002 Guidelines for the Management of Patients With Unstable Angina/Non-ST-Elevation Myocardial Infarction): Developed in Collaboration with the American College of Emergency Physicians, the Society for Cardiovascular Angiography and Interventions, and the Society of Thoracic Surgeons: Endorsed by the American Association of Cardiovascular and Pulmonary Rehabilitation and the Society for Academic Emergency Medicine. Circulation. 2007; 116 (7): e148-304.Circulation. 2007; 116 (7): e148-304.2007; 116 (7): e148-304. 9. Bassand JP, Hamm C, Ardissino D, Boersma E, Budaj A, Fernandez-Aviles F,
et al. Task Force for the diagnosis and treatment of non-ST Elevation Acute Coronary Syndromes of the European Society Cardiology; Guidelines for the diagnosis and treatment of non-ST-segment elevation acute coronary syndromes: The Task Force for the Diagnosis and Treatment of Non-ST-Segment Elevation Acute Coronary Syndromes of the European Society of Cardiology. Eur Heart J. 2007; 28 (13): 1598-660.
10. McCarthy BD, Wong JB, Selker H. Detecting acute ischemia in the emergency department: a review of the literature. J Gen Intern Med. 1990; 5: 365-73. 11. Winter R, Windhausen F, Cornel J, Dunselman P, Janus C, Bendermacher
P, et al. for the invasive versus conservative treatment in unstable coronary syndromes (ICTUS) investigators. Early invasive versus selectively invasive management for acute coronary syndromes. N Engl J Med. 2005; 353: 1095-104.
12. Lopes R, Pieper S, Horton R, Al-Khatib M, Newby K, Mehta H, et al. Short- and long-term outcomes following atrial fibrillation in patients with acute coronary syndromes with or without ST-segment elevation. Heart. 2008; 94 (7): 867-73.
That was the reason to include easy well-known variables into our multivariate model, in an attempt to understand the relative power of each. We concluded that a normal ECG, along with age and diabetes, were the only early independent predictors of prognosis. The troponin I cut-off used was 0.2 U/ml, which is our local laboratory cutoff for a positive result. We also observed that this lower threshold was not as powerful as data derived from ECG analysis. Similar results have been also reported by Holmvang et al in the series from the TRIM (Thrombin Inhibition In Myocardial Ischemia) sub-study15.
Nevertheless, we observed (data not shown) that if we adjusted the model to include treatment variables and coronary anatomy, a normal ECG no longer had statistical significance. This meant that ECG loses importance on a global analysis, for clinical and treatment-derived variables, and even for troponin I data, with a cut-off determined from a ROC curve.
Although we have constructed a combined ECG variable, in our population, as also reported by previous authors, ST depression remained the most important ECG-derived information regarding prognosis.
Limitations
We did not have available data on the presence of Q waves at the admission ECG. Our follow up was a clinical one and
unfortunately, we did not have data on the evolution of the electrical variables. Moreover, there were no data on the medication at the time of follow up, which could clearly have influenced outcome.
Conclusions
A normal ECG in the spectrum of non ST elevation ACS is an early marker for mid-term good prognosis and remains an important variable in the 21st century for ACS patients. Nevertheless, the ECG, although important, was not enough to attain a global characterization of our patients’ risk profile.
Potential Conflict of Interest
No potential conflict of interest relevant to this article was reported.
Sources of Funding
There were no external funding sources for this study.
Study Association
13. Zia M, Peterson ED, Mulgund J, Chen AY, Langer A, Tan M, et al. Paradoxical use of invasive cardiac procedures for patients with non-ST segment elevation myocardial infarction: an international perspective from the CRUSADE Initiative and the Canadian ACS Registries I and II. Can J Cardiol. 2007; 23: 1073-9.
14. Fox KA, Poole Wilson P, Clayton TC, Henderson RA, Shaw TR, Weatley DJ, et al. Five year outcome of an interventional strategy in non-ST-elevation acute
coronary syndrome: the British Heart Foundation RITA 3 randomised trial. Lancet. 2005; 366: 914-20.