Ivan França-JuniorI
Gabriela CalazansII
Eliana Miura ZucchiIII
Grupo de Estudos em
População, Sexualidade e Aids*
I Departamento de Saúde Materno-Infantil. Faculdade de Saúde Pública (FSP). Universidade de São Paulo (USP). São Paulo, SP, Brasil
II Centro de Referência e Treinamento em DST/Aids. Secretaria de Estado da Saúde de São Paulo. São Paulo, SP, Brasil
III Programa de Pós-Graduação em Saúde Pública. FSP-USP. São Paulo, SP, Brasil * (Study Group on Population, Sexuality and AIDS) members: Elza Berquó, Francisco Inácio Pinkusfeld Bastos, Ivan França Junior, Regina Barbosa, Sandra Garcia, Vera Paiva, Wilton Bussab.
Correspondence: Ivan França Junior
Departamento de Saúde Materno-Infantil Faculdade de Saúde Pública – USP Av. Dr. Arnaldo, 715 – sala 218 01246-940 São Paulo, SP, Brasil E-mail: [email protected]
Received: 10/16/2007 Reviewed: 5/5/2008 Approved: 5/19/2008
Changes in HIV testing in Brazil
between 1998 and 2005
ABSTRACT
OBJECTIVE: To analize changes in HIV testing, reasons reported by those who were tested or not and received counseling.
METHODS: Cross-sectional studies conducted in both men and women aged 16 to 65 years based on representative samples of urban Brazil in 1998 (n=3,600) and 2005 (n=5,040). Sociodemographic, sexual, reproductive characteristics, life experiences and health data were collected and analyzed. Potential differences in the distribution of variables was analyzed using Pearson’s chi-square and design-based F test (α<5%).
RESULTS: In 1998 and 2005, 20.2% and 33.6% of interviewees had been tested, respectively. A total of 60% women aged 25–34 years were tested, but those who reported sexual initiation before the age of 16 and four or more sexual partners in the fi ve years prior to the interview were less tested. There was no signifi cant increase in testing among men, except among those aged 55– 65 years, per capita income between 1–3 and 5–10 monthly minimum wages, retired, historical Protestant and followers of African-Brazilian religions, living in the North/Northeast region and who reported homosexual/bisexual partners or no sexual relationship in the fi ve years prior to the interview. Testing rates did not increase in those who self-reported as high risk for HIV. Among women, prenatal testing rate increased while work-related testing decreased among men. In 2005, half of those who were tested did not receive any advice before or after testing.
CONCLUSIONS: HIV testing scaling up was unequal and was mostly seen among women at childbearing age, adults and those better off. There seems to be an increase in testing rates in Brazil but without regard for people’s right to free choice and without offering more widely and better quality counseling.
DESCRIPTORS: Acquired Immunodefi ciency Syndrome, diagnosis. HIV. Socioeconomic Factors. Health Knowledge, Attitudes, Practice. Health Inequalities. Cross-Sectional Studies. Population Studies in Public Health. Brazil. Cross-sectional studies.
INTRODUCTION
HIV testing was fi rst approved in 1985 for blood and blood product control. Voluntary testing along with counseling for those at increased risk was also recommended to be offered in health services as part of primary and secondary prevention.31,a,b In São Paulo, southeast Brazil, HIV testing became available in
1986 as a result of civil society’s pushing the State House of Representatives for
a Ministério da Saúde. Coordenação Nacional de DST/AIDS. Aconselhamento: um desafi o para prática integral em saúde - avaliação das ações. Brasília; 1999.
making HIV screening test mandatory at blood banks.a
In 1988, HIV testing became mandatory nationwide.b
Between 1987 and 1988, there were created Centers for Testing and Counseling (CTA), then called Centers for Serological Advice and Support (COAS) that mainly provided free, confi dential and anonymous testing to the so-called “risk groups,” i.e., male homosexuals, sex workers and intravenous drug users.c
The introduction of highly active antiretroviral therapy (HAART) in 1996, as a right in Brazil, made testing a diagnostic tool to detect those who needed and were eligible to receive HAART. As a preventive action, early diagnosis aims at providing comprehensive medical care to reduce disease burden and mortality and thus reduce vertical, sexual and parenteral trans-mission by decreasing viral load and HIV circulation in the blood stream.8
Given the notorious stigma and discrimination ac-companying HIV/AIDS since the beginning of the epidemic,22 scaling up HIV testing was based on
the following regulating principles: counseling and information on HIV/AIDS before and after testing; testee’s explicit voluntary and informed consent; and confi dentiality of testing results.d It is thus intended to
integrate freedom (private autonomy) and equity (health and education) rights.12
The purpose of the present study was to analyze changes in HIV testing, the reasons reported by those who were tested or not tested and received counseling.
METHODS
The analyses refer to fi ndings of the survey “Compor-tamento Sexual e Percepções da População Brasileira sobre HIV/Aids”e (Sexual behavior and perceptions of
the Brazilian population regarding HIV/AIDS), carried out in 2005, compared with a similar survey carried out in 1998.f
Both surveys consisted of representative samples of Brazilian urban population based on the microareas defined by the Instituto Brasileiro de Geografia e Estatística (IBGE – Brazilian Institute of Geography and Statistics). Using a stratifi ed multi-stage sampling,
census tracts, private households and individuals aged between 16 and 65 years were randomly and succes-sively drawn in each microregion.
For the 2005 survey, the criterion for microregion selection was modifi ed to include more urban areas compared to the 1998 sample.6
The fi nal 1998 and 2005 samples consisted of 3,600 and 5,040 subjects, respectively, comprising both men and women aged between 16 and 65 years.
Sociodemographic, sexual, reproductive characteris-tics, life and health experiences were the dependent variables; HIV testing, reasons for being tested and counseling were analyzed as outcomes.
For time analysis, double-entry expectancy tables were compiled by gender and main sociodemographic variables: age, skin color, full years of schooling, per capita family income, Brazilian macroregion, marital status, current occupation, current religion, sexual and reproductive practices, age at sexual initiation, condom use at fi rst sexual intercourse, type of sexual partner and number of sexual partners in the last fi ve years prior to the interview, prior sexually transmitted disease (STD), number of children, HIV-related life experiences and health, self-assessment of HIV risk, and belief about mandatory testing. Study variables were defi ned and categorized as to allow comparability between both 1998 and 2005 surveys.
In the 2005 survey, there were included questions on reasons for being tested or not related to their last test-ing and whether individual or group counseltest-ing was offered before and after testing. Assuming that most Brazilians are not familiar with the term counseling, the following question was asked: “Did you talk about it before your last testing?”.
Data were adjusted by weight, primary sampling unit, and strata for complex sample designs (Stata 8.0).6
Dif-ferences between 1998 and 2005 were analyzed using Pearson’s chi-square and design-based F test at a 5% signifi cance level.
The project of the survey “Comportamento Sexual e Percepções da População Brasileira Sobre HIV/Aids” was approved by the Ethics Committee of Faculdade de Saúde Pública of Universidade de São Paulo.
a Lei nº 5.190, de 20 de junho de 1986. Dispõe sobre a realização de testes para detecção de anticorpos do vírus da Síndrome da Defi ciência Imunológica Adquirida (AIDS). Diário Ofi cial do Estado de São Paulo. 21 jun 1986.
b Brasil. Lei nº 7.649, de 25 de janeiro de 1988. Estabelece a obrigatoriedade do cadastramento dos doadores de sangue bem como a realização de exames laboratoriais no sangue coletado, visando a prevenir a propagação de doenças, e dá outras providências. Diário Ofi cial da União. 27 jan 1988.
c Ministério da Saúde. Coordenação Nacional de DST/AIDS. Aconselhamento: um desafi o para prática integral em saúde - avaliação das ações. Brasília; 1999.
d Jürgens R. Increasing access to HIV testing and counseling while respecting human rights [internet]. New York: Public Health Program of the Open Society Institute; 2007. Available from:
http://www.soros.org/initiatives/health/articles_publications/publications/testing_20070907/increasing_20070907.pdf [Cited 2007 Oct 10]. e Research conducted by Centro Brasileiro de Análise e Planejamento (Brazilian Center for Analysis and Planning – Cebrap) and Ministry of Health.
RESULTS
In 1998 and 2005, 20.2% (95% CI: 16.2;24.3) and 33.6% (95% CI: 31.7;35.4) of all interviewees had been tested for HIV, respectively. However, these rates included blood donor testing. After excluding blood donors, 15.3% and 28.6% of all interviewed had been tested in 1998 and 2005, respectively. When in addition prenatal testing was excluded, access to HIV testing felt to 13.5% and 20.8%, respectively.
Table 1 illustrates changes in HIV testing between 1998 and 2005 among men and women, according to sociodemographic variables.
Among women, both in 1998 and 2005, there were seen lower testing rates at younger and older ages (16–19 and 55–65 years), in the North/Northeast region, and in cer-tain occupations (household maid, liberal professional, retired, student and homemaker). In 2005, signifi cant differences were seen with lower testing among Black women who were illiterate or had elementary school-ing, income less than three monthly minimum wages (MMWs), living in the North/Northeast and Central-West/Southeast regions, single, retired, students and followers of Catholic and Protestant religions. A comparison between 1998 and 2005 data show increased testing rates among women in almost all categories studied, reaching 60% in those aged 25–34. No signifi cant increase was seen in women aged 16–19 years, illiterate, per capita family income between 5–10 MMWs and certain occupations (private sector employees, unemployed and students). The number of female interviewees was small in some categories (liberal professionals, business owners, followers of African-Brazilian religions), which prevented further comparisons.
As for men, both surveys showed lower testing rates at younger and older ages (16–19 and 55–65 years), among those illiterate or who had elementary school-ing, and income less than 3 MMWs. Signifi cant testing differences were seen in 2005 with lower rates among those living in the North/Northeast and Central-West/ Southeast regions, single, unemployed and students. However, a comparison of testing rates between 1998 and 2005 showed no increase except in those aged 55–65 years, per capita income between 1–3 and 5–10 MMWs, retired, followers of historical Protestantism and African-Brazilian religions, living in the North/ Northeast region, and those who reported homosexual practices or not having sexual intercourse in the last
fi ve years prior to the interview. Among those more frequently tested, higher rates were found only among those followers of African-Brazilian religions and who reported homosexual practices.
Table 2 shows lifetime testing rates for men and women according to sexual and reproductive variables.
Differences between men and women were identifi ed in both surveys. In 1998, women who had one or no sexual partner sexual during the fi ve years prior to the interview and men who reported homosexual and bisexual partners were less frequently tested.
As for women, in 2005, signifi cant differences were seen in all variables studied. Lower testing rates were found among those who reported sexual initiation between 16 and 23 years of age, no condom use at fi rst intercourse, no sex in the last fi ve years prior to the interview, het-erosexual partners, no STDs and no children.
As for men, in 2005, testing was signifi cantly lower among those heterosexual, with no past history of STDs and no children.
A signifi cant increase in testing was seen between 1998 and 2005 among women in almost all categories, except in those who had their sexual initiation before the age of 16 or four or more sexual partners in the last fi ve years prior to the interview. However, among men, a signifi cant increase in testing was seen among those who reported having, during the fi ve years prior to the interview, homosexual or bisexual partners, no sexual intercourse, two to three sexual partners and past history of STD.
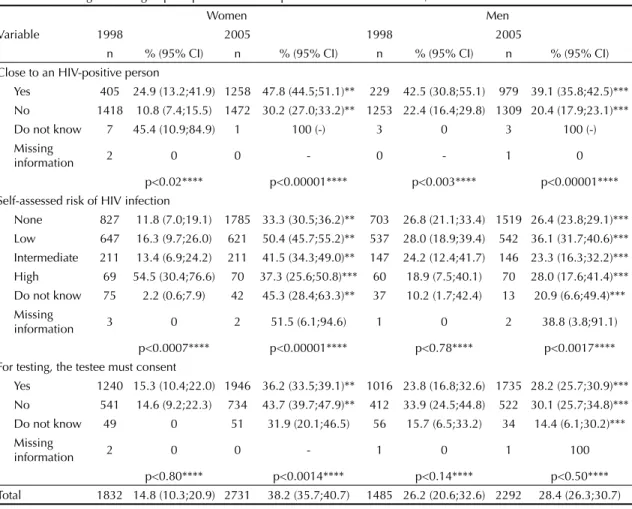
When testing was analyzed by life and health experi-ences (Table 3), there were marked changes between 1998 and 2005 among women, except in those who were self-assessed as high risk for HIV infection. On the other hand, no signifi cant increase in testing rates was seen in any of the variables studied.
Signifi cant differences persisted in 2005, which were identifi ed in 1998 as well, regarding higher testing rates among women and men who were close to an HIV-positive person. Among women, in 1998, those self-assessed as high risk were more frequently tested, while, in 2005, those self-assessed as low or intermedi-ate risk were more often tested.
In 2005, testing was less frequent among women who believed that consent is necessarily required for HIV testing. Men who were self-assessed as low risk were more often tested than those who were self-assessed as intermediate risk or no risk at all.
Reasons for getting tested are displayed in Table 4. There was signifi cant increase of testing during prena-tal care among women, and decrease in “work-related reasons,” particularly among men.
Among those who had never been tested, 72% reported that they were not likely to be exposed to HIV, 4.7% did not know where they could get tested, 2.5% did not want
to think about HIV, 2% said they were afraid to fi nd out they were HIV-positive, and 1.7% claimed to be afraid of needles. Additionally, 30 interviewees (0.7%) said
Table 1. HIV testing according to sociodemographic characteristics. Brazil, 1998 and 2005.
Variable
Women Men
1998 2005 1998 2005
n % (95% CI) n % (95% CI) n % (95% CI) n % (95% CI)
Age group (years)
16–19 201 14.0 (5.7;30.4) 227 18.5 (14.0;24.0)*** 216 15.6 (4.2;43.6) 233 5.4 (3.1;9.4)***
20–24 212 21.2 (12.3;34.0) 321 45.6 (39.3;52.1)** 211 18.5 (10.8;29.8) 301 22.1 (16.9;28.3)***
25–34 500 19.6 (12.4;29.7) 716 60.3 (55.7;64.8)** 397 40.4 (30.8;50.9) 574 40.9 (36.0;45.9)***
35–44 416 15.1 (8.2;26.4) 616 42.6 (37.6;47.8)** 312 35.0 (23.0;49.3) 532 36.0 (31.2;41.0)***
45–54 274 9.6 (4.7;18.8) 469 25.1 (21.0;30.0)** 201 19.4 (11.1;31.8) 380 30.4 (25.1;36.2)***
55–65 229 1.0 (0.4;2.4) 382 16.1 (12.1;21.0)** 148 7.2 (3.2;15.7) 272 20.8 (15.9;26.7)**
p<0.05 p<0.00001 p<0.02 p<0.00001
Skin color
White 875 15.9 (10.8;22.9) 1350 41.7 (38.4;45.0)** 693 30.0 (21.0;40.9) 1127 30.1 (27.4;33.2)***
Black 813 14.1 (8.1;23.3) 1282 35.0 (31.8;38.5)** 713 22.6 (17.9;28.1) 1113 26.7 (23.6;30.2)***
p<0.6 p<0.003 p<0.16 p<0.15
Schooling
Illiterate 185 7.8 (2.6;21.4) 160 14.0 (8.8;21.5)*** 116 10.8 (5.0;22.1) 113 10.0 (4.9;19.1)***
Elementary 978 14.8 (8.0;25.9) 1212 33.1 (30.0;36.5)** 875 21.0 (15.7;27.5) 1027 21.7 (19.1;24.6)***
Middle 494 16.7 (11.7;23.2) 876 43.2 (39.4;47.0)*** 356 33.5 (24.1;44.4) 801 31.3 (27.8;35.0)***
University 175 15.2 (10.2;21.9) 443 50.1 (44.6;55.6)*** 138 48.0 (32.3;64.0) 321 48.1 (41.4;55.0)***
p<0.59 p<0.0001 p<0.001 p<0.0001
Family income (monthly minimum wages)
Up to 1 209 2.9 (1.5;5.5) 450 31.6 (26.7;36.9)** 114 10.2 (4.8;20.5) 236 8.3 (5.2;13.1)***
More than 1 to 3 427 13.0 (7.1;22.6) 1048 33.8 (30.3;37.5)** 350 8.7 (5.5;13.5) 844 21.8 (18.8;25.1)**
More than 3 to 5 301 12.9 (7.1;22.2) 506 42.4 (37.4;47.5)** 293 29.7 (20.4;41.0) 501 31.2 (26.7;36.1)***
More than 5 to 10 288 27.4 (12.3;50.5) 377 43.5 (37.6;49.6)*** 309 23.6 (15.1;34.8) 394 38.6 (33.1;44.4)*
More than 10 255 13.7 (7.4;24.0) 209 48.1 (40.6;55.7)** 232 30.8 (21.7;41.6) 213 36.9 (30.1;44.3)***
Do not know/
Unknown 352 12.0 (6.9;20.0) 141 39.0 (31.2;47.5)** 187 41.7 (25.2;60.3) 104 35.7 (25.1;54.5)*
p<0.075**** p<0.0002**** p<0.002**** p<0.00001****
Brazilian region
North/Northeast 611 4.4 (2.4;7.9) 701 27.1 (23.3;31.3)** 493 15.6 (11.9;20.3) 557 22.1 (18.4;26.4)*
Central-West/
Southeast 768 13.7 (9.3;19.9) 680 37.8 (32.6;43.2)** 612 28.8 (17.8;43.1) 579 27.2 (23.4;31.4)***
State of São Paulo 188 24.6 (11.6;44.7) 665 45.7 (41.1;50.3)* 133 29.8 (20.2;41.6) 586 33.6 (29.6;37.9)***
South 265 18.7 (12.0;28) 685 44.5 (40.4;48.7)** 247 31.9 (21.0;45.1) 570 32.0 (27.5;36.8)***
p<0.013 p<0.00001 p<0.13 p<0.0001
Marital status
Single 512 13.9 (8.4;21.9) 722 29.5 (25.6;33.7)** 549 21.6 (13.2;33.3) 831 23.5 (20.2;27.1)***
Married/living
with a partner 999 15.6 (10.0;23.4) 1544 42.6 (39.7;45.6)** 862 29.2 (23.6;35.6) 1307 31.6 (28.7;34.7)***
Separated/divorced
Widowed 186 22.5 (13.0;36.1) 315 45.3 (38.0;52.8)** 58 29.0 (12.8;53.3) 129 36.2 (26.1;47.8)***
Do not know/
unknown 135 6.0 (1.6;20.1) 150 22.2 (15.5;30.9)* 16 9.6 (1.3;45.5) 25 17.8 (5.7;43.4)***
they believed the results would not be kept confi dential, 18 claimed to be afraid of losing their jobs, insurance, house, family and friends, and fi ve out of a total of 5,040 said they were afraid their names would be reported to the authorities in case of positive results.
In 2005, more than half of men and women did not get any advice before or after testing. Of those who did receive it, advice was given in an individual ses-sion. Between 1% and 2.5% did not know they were being tested.
DISCUSSION
The comparison between cross-sectional studies with similar methodological approaches allows to identify-ing changes in in-between years and to distidentify-inguish
particular generational, social, regional, ethnic/racial and gender inequalities in HIV testing.7
The proportion of those ever tested signifi cantly in-crease between 1998 and 2005 (from 20% to 33.6%), meaning that almost 27 million, or after excluding blood donors, 22.7 million people (28.6%)6 had ever
been tested in urban Brazil in 2005.
A 1991 study conducted by Datafolha Research Institute in seven Brazilian capitals (São Paulo, Rio de Janeiro, Belo Horizonte, Porto Alegre, Curitiba, Salvador and Recife) showed overall coverage of 14%;a an
approxi-mately 100% increase between 1991 and 2005. The same trend was verifi ed in a comparison with a study by Perseu Abramo Foundationb (2001) in a
representa-tive sample of Brazilian women over 15 years of age:
Continuation Table 1
Variable
Women Men
1998 2005 1998 2005
n % (95% CI) n % (95% CI) n % (95% CI) n % (95% CI)
Current occupation
Private employee 200 30.0 (17.0;47.3) 509 46.6 (41.4;51.9)*** 437 30.5 (23.3;38.9) 848 31.8 (28.0;35.9)***
Public employee 199 14.9 (7.4;27.9) 203 49.2 (40.8;57.7)** 132 47.5 (34.1;61.2) 171 56.6 (47.3;65.5)***
Self-employed 178 14.7 (5.5;33.5) 330 43.6 (37.7;49.8)** 412 21.0 (12.6;33.0) 577 24.5 (20.6;28.8)***
Household maid 128 7.5 (3.2;16.7) 191 24.7 (18.5;32.3)* 4 0 (0) 3 60.9 (11.6;94.9)
Liberal professional 12 7.5 (1.4;31.4) 45 35.3 (21.7;51.8)*** 24 18.3 (6.4;42.2) 57 30.5 (20.5;43.1)***
Business owner 71 15.7 (4.4;43.0) 64 37.2 (26.0;49.9)*** 86 35.4 (16.2;60.9) 81 27.6 (17.8;40.1)***
Unemployed 97 28.1 (12.5;51.7) 218 48.4 (40.7;56.0)*** 170 30.1 (17.3;46.9) 212 22.4 (16.5;29.5)***
Retired 163 5.3 (1.8;14.4) 217 22.8 (16.7;30.2)** 107 11.2 (4.4;25.8) 165 24.6 (17.8;32.9)*
Student 136 10.2 (4.4;21.9) 164 19.4 (13.5;27.0)*** 111 17.5 (5.6;42.8) 137 10.4 (6.2;16.8)***
Menaker 638 10.8 (6.7;16.9) 745 36.0 (31.9;40.2)** 0 - 0
-Other 10 1.5 (0.2;12.3) 44 41.3 (25.7;58.8)*** 2 31.4 (2.7;88.1) 41 28.2 (15.1;46.4)***
p<0.015 p<0.0001 p<0.072 p<0.00001
Current religion
Catholic 1316 14.7 (9.5;21.9) 1718 35.5 (32.7;38.5)** 1105 27.8 (21.1;35.8) 1531 28.4 (25.6;31.4)***
Historical
Protestant 81 6.5 (1.6;22.5) 224 39.3 (32.2;46.8)** 81 13.0 (5.8;26.8) 167 28.1 (20.9;36.6)*
Pentecostal 228 17.6 (8.8;32.0) 439 38.6 (33.7;43.8)** 111 15.0 (6.7;30.2) 231 24.0(18.2;30.9)***
Spiritist 59 16.3 (6.5;35.2) 116 53.2 (41.9;64.1)** 33 46.2 (19.3;75.5) 63 43.0 (29.8;57.3)***
African-Brazilian 6 1.4 (0.1;12.2) 18 51.9 (25.5;77.3)*** 7 6.4 (0.8;37.7) 9 68.9 (28.9;92.3)*
None 86 8.1 (2.5;23.1) 168 49.7 (40.7;58.6)** 119 29.4 (15.2;49.4) 254 29.1 (22.7;36.4)***
Other 54 23.9 (6.5;58.4) 44 43.0 (27.6;60.0) 25 18.7 (4.3;53.7) 35 23.7 (11.6;42.4)***
p<0.56 p<0.004 p<0.21 p<0.11
Total 1832 14.8 (10.3;20.9) 2731 38.2 (35.7;40.7) 1485 26.2 (20.6;32.6) 2292 28.4 (26.3;30.7)
Differences between 1998 and 2005: * p <0.05
** p<0.01 *** p=NS
**** Do not know or missing information were excluded from analysis.
a Datafolha. Relatório de pesquisa de opinião número 1055. São Paulo; 1991.
Table 2. HIV testing according to sexual and reproductive characteristics. Brazil, 1998 and 2005.
Variable
Women Men
1998 2005 1998 2005
n % (95% CI) n % (95% CI) n % (95% CI) n % (95% CI)
Sexually active
Yes 1638 16.3 (11.3;22.9) 2555 41.3 (38.7;44.0)** 1402 27.8 (22.2;34.2) 2188 30.1 (27.8;32.5)***
Never 194 2.7 (0.4;14.9) 168 3.4 (1.5;7.5) 83 0 (0) 102 3.1 (1.0;9.3)
Age at sexual initiation (years)
Less than 15 132 27.1 (10.5;54.1) 270 51.8 (43.8;59.7)*** 377 29.5 (20.0;41.1) 649 29.6(25.7;33.7)***
15 to 23 1286 15.7 (10.9;22.0) 1980 40.7 (37.8;43.7)** 982 26.1 (19.6;33.9) 1440 30.9 (28.0;34.0)***
24 or more 218 12.2 (5.3;25.6) 263 37.2 (29.6;45.4)** 221 57.5 (38.1;74.8) 543 21.3 (11.1;37.0)***
p<0.29 p<0.02 p<0.14 p<0.41
Condom use at sexual initiation
Yes 221 17.9 (7.2;37.8) 543 49.7 (44.7;54.7)** 240 35.6 (21.4;52.8) 504 27.2 (22.9;31.8)***
No 1417 15.9 (11.8;21.1) 1989 38.6 (35.8;41.5)** 1162 26.1 (21.3;31.5) 1673 31.1 (28.4;33.9)***
p<0.66 p<0.0002 p<0.19 p<0.15
Sexual partners in the last fi ve years
Heterossexual 1418 16.9 (11.2;24.7) 2482 39.2 (36.7;41.8)** 1312 28.0 (22.1;34.9) 2197 27.7 (25.6;30.0)***
Homosexual/
bisexual 21 44.5 (10.3;84.8) 19 72.7 (47.2;88.8)* 23 8.6 (2.5;25.6) 45 58.5 (41.8;73.4)**
No partners 392 4.9 (2.1;10.9) 230 21.2 (15.3;28.6)** 149 12.5 (4.0;33.2) 50 34.1 (18.9;53.6)*
Missing information 1 0 (0) 0 - 1 100 (0) 0
-p<0.17**** p<0.00001 p<0.026**** p<0.0006
Number of sexual partners (last 5 years)
None 190 5.6 (1.9;15.2) 231 21.7 (15.8;29.2)** 31 45.4 (13.7;81.3) 50 34.1 (18.9;53.6)***
One 1136 12.5 (8.3;18.4) 1847 40.0 (37.1;43.0)** 606 29.3 (22.6;36.9) 1091 29.1 (26.2;32.2)***
Two to three 155 29.3 (15.5;48.2) 245 55.2 (47.4;62.7)* 154 20.9 (12.7;32.5) 219 37.5 (30.3;45.3)*
Four to fi ve 123 36.6 (16.0;63.8) 166 52.7 (43.4;61.8)*** 274 32.2 (18.4;50.1) 397 28.4 (23.2;34.3)***
More than 6 26 61.1 (29.3;85.6) 43 65.0 (48.1;78.8)*** 301 24.0 (16.7;33.2) 386 31.2 (26.0;37.1)***
Do not know 3 9.6 (0.9;56.0) 4 18.7 (1.2;72.3)*** 29 27.4 (6.3;68.0) 26 13.4 (4.9;31.7)***
Missing information 5 41.5 (5.5;89.7) 18 39.5 (18.3;65.6)*** 7 0 19 33.7 (11.5;66.5)
p<0.0002**** p<0.0001 p<0.62**** p<0.35
Ever had STD?
Yes 109 8.8 (3.9;18.7) 439 47.8 (42.2;53.5)** 307 24.3 (16.7;34.0) 413 35.8 (29.8;42.3)*
No 1700 15.4 (10.6;21.9) 2166 37.9 (35.2;40.7)** 1166 26.6 (20.6;34.0) 1773 27.3 (25.0;29.6)***
Do not know 4 0 12 27.3 (7.4;63.6) 4 0 5 54.4 (15.2;88.8)
Missing information 19 0 2 45.2 (4.9;93.0) 8 0 0 –
p<0.19**** p<0.003 p<0.67**** p<0.008
Children?
Yes 1345 15.1 (9.1;23.8) 2070 42.9 (40.0;45.8)** 886 29.0 (23.9;34.8) 1397 31.8 (29.0;34.8)***
No 483 12.2 (7.2;20.0) 661 25.2 (21.4;29.5)** 598 22.6 (13.4;35.5) 889 23.9 (20.6;27.5)***
Do not know/
missing information 5 96.4 (71.3;99.7) 3 - 5 0 6 7.2 (1.3;30.9)
p<0.57**** p<0.0001 p<0.32**** p<0.001****
Total 1832 14.8 (10.3;20.9) 2731 38.2 (35.7;40.7) 1485 26.2 (20.6;32.6) 2292 28.4 (26.3;30.7)
Differences between 1998 and 2005 * p<0.05
** p<0.01 *** p=NS
25% of non-virgin women (88%) reported ever being tested, projecting a coverage of at least 22% compared to 38.2% in 2005. There is thus evidence of increasing testing rates in Brazil.
Current testing rates are similar to those reported in the US (34%)16 and Switzerland (40%)25,33 in 1997–1998
and Canada (34.9%) in 1995–1996.15 However, these
studies excluded blood donation testing and, after excluding blood donors, testing rates in Brazil in 2005 are signifi cantly lower.
In the US, the Centers for Disease Control and Preven-tion (CDC) have, since 1973, periodically collected data on health and, since 1995, on HIV testing through the National Survey of Family Growth. These surveys show increasing testing rates among American women, from 34.5% in 1995 to 54.9% in 2002 (excluding blood donations).3 In Italy, there was found a testing rate of
39.3% among people from four different provinces in 2002. Quota sampling (with 40% refusal rate) and different collection approaches do not allow to infer-ring an increase in testing rates in Italy between 1998 and 2002.29
Testing rates in Brazil seems higher than in Greece (10.1%), Italy (15.5%), and Norway (17.4%) in 1997– 1998.25 According to Jeannin et al17 (1998), European
countries had coverage between 9% (Holland) and 30% (West Germany) in the 1990s.
Yet HIV testing scaling up between 1998 and 2005 was seen mostly among women at childbearing age for reduction of HIV vertical transmission. In fact, 27.2% of women prenatal care as a reason for testing in 1998; 46% reported that in 2005. For the fi rst time, in 2005, testing coverage in Brazil among women was higher than that among men.a,b
Table 3. HIV testing according to perceptions and life experiences and health. Brazil, 1998 and 2005
Variable
Women Men
1998 2005 1998 2005
n % (95% CI) n % (95% CI) n % (95% CI) n % (95% CI)
Close to an HIV-positive person
Yes 405 24.9 (13.2;41.9) 1258 47.8 (44.5;51.1)** 229 42.5 (30.8;55.1) 979 39.1 (35.8;42.5)***
No 1418 10.8 (7.4;15.5) 1472 30.2 (27.0;33.2)** 1253 22.4 (16.4;29.8) 1309 20.4 (17.9;23.1)***
Do not know 7 45.4 (10.9;84.9) 1 100 (-) 3 0 3 100 (-)
Missing
information 2 0 0 - 0 - 1 0
p<0.02**** p<0.00001**** p<0.003**** p<0.00001****
Self-assessed risk of HIV infection
None 827 11.8 (7.0;19.1) 1785 33.3 (30.5;36.2)** 703 26.8 (21.1;33.4) 1519 26.4 (23.8;29.1)***
Low 647 16.3 (9.7;26.0) 621 50.4 (45.7;55.2)** 537 28.0 (18.9;39.4) 542 36.1 (31.7;40.6)***
Intermediate 211 13.4 (6.9;24.2) 211 41.5 (34.3;49.0)** 147 24.2 (12.4;41.7) 146 23.3 (16.3;32.2)***
High 69 54.5 (30.4;76.6) 70 37.3 (25.6;50.8)*** 60 18.9 (7.5;40.1) 70 28.0 (17.6;41.4)***
Do not know 75 2.2 (0.6;7.9) 42 45.3 (28.4;63.3)** 37 10.2 (1.7;42.4) 13 20.9 (6.6;49.4)***
Missing
information 3 0 2 51.5 (6.1;94.6) 1 0 2 38.8 (3.8;91.1)
p<0.0007**** p<0.00001**** p<0.78**** p<0.0017****
For testing, the testee must consent
Yes 1240 15.3 (10.4;22.0) 1946 36.2 (33.5;39.1)** 1016 23.8 (16.8;32.6) 1735 28.2 (25.7;30.9)***
No 541 14.6 (9.2;22.3) 734 43.7 (39.7;47.9)** 412 33.9 (24.5;44.8) 522 30.1 (25.7;34.8)***
Do not know 49 0 51 31.9 (20.1;46.5) 56 15.7 (6.5;33.2) 34 14.4 (6.1;30.2)***
Missing
information 2 0 0 - 1 0 1 100
p<0.80**** p<0.0014**** p<0.14**** p<0.50****
Total 1832 14.8 (10.3;20.9) 2731 38.2 (35.7;40.7) 1485 26.2 (20.6;32.6) 2292 28.4 (26.3;30.7)
Differences between 1998 and 2005 * p <0.05
** p<0.01 *** p=NS
**** Do not know or missing information were excluded from analysis.
a Datafolha. Relatório de pesquisa de opinião número 1055, 9 de dezembro de 1991. São Paulo; 1991.
This selective scaling up is consistent with the historical medicalization of the female body while the male body has not systematically been an object of intervention in Brazilian health settings. The example of the Women’s Comprehensive Health Care Program (PAISM) is illustrative. Established in 1980s, this program has privileged women as a sexual/reproductive being.9 In
Brazil, HIV testing has been linked to between prenatal care with routine testing of all pregnant women with no consent required or adequate advice offered, leading to an increase in testing rates to 60% among women aged between 25 and 34 years.
In the US, compared to 1998,16 women were more often
tested than men in 2002.2 In Italy, HIV testing is less
common among women, while in Greece and Norway there are no gender-related differences.26
There is evidence that a reduction of vertical transmis-sion comes after a policy of screening and treatment of HIV-positive pregnant women.5 However, for achieving
vertical transmission reduction ethical principles con-cerning pregnant women’s absolute choice on testing must not be disregarded.
In the present study, 55% of interviewees did not get any counseling and 1.6% were unaware they were being tested. In other words, 26.7 out of 79.5 millions who were ever tested, more than 14.7 millions were tested unadvised and more than 420,000 were unaware they were being tested.
Goldani et al13 (2003) claim that testing pregnant
women has represented rather a mandatory than vol-untary strategy. They studied 1,658 pregnant women of three public maternity hospitals in Porto Alegre (RS)
and found 59.2% had not received any prior counsel-ing, 18.1% were unaware they were being tested and 3.2% believed testing was mandatory. Morimura et al19
(2006), while studying pregnant women in a school maternity hospital in Recife, also reported no pre-test-ing counselpre-test-ing (52% durpre-test-ing prenatal care and 90% in rapid testing in the maternity hospital), and diffi culty to receive test results as well. Segurado et al28 (2003)
interviewed women living with HIV/AIDS in refer-ence services in São Paulo. They found 42% received pre-testing and 62.5% post-testing counseling. These studies indicate that testing has been performed dur-ing pregnancy care and other care settdur-ings without women’s consent, either they were HIV-positive or not, and without offering any counseling. An US study demonstrated that HIV testing was recommended based on the provider’s perception of pregnant women’s risk behaviors, suggesting judgmental decision making.4
Testing rates seems to be increasing in Brazil without showing proper concern to people’s right to autono-mous decision and without offering wider and quality counseling. Being tested can be part of what Paiva et al21 defi ned as “the right to prevention”: promotion of
access to prevention materials (condoms, syringes), in-formation, education and quality counseling even when the interface with care is greater as having access to quality STD treatment, sexual and reproductive health care or prevention of transmission vertical.
As for HIV testing, not all health-related difference means inequality. Health inequality means unequal dif-ferences that “besides being systematic and signifi cant, they are preventable, unfair and unnecessary as well”.7
Table 4. Reasons for last HIV testing reported by urban Brazilians men and women aged 16 to 65 according to survey year. Brazil, 1998 and 2005
Reason for being tested
HIV testing
1998 2005 p<
n (%) n (%)
One’s own initiative 161* (26) 502 (28)
Medical indication 92 (19) 307 (17)
Blood donor 165 (29) 345 (21)
Prenatal care 40 (10) 514 (27)
Work-related 49 (11) 105 (5.5)
Other 19 (5) 29 (1.4) 0.0001
Men Women Men Women
One’s own initiative 86* (29) 75 (22) 259 (37) 243 (21)
Medical indication 32 (10) 60 (33) 106 (15) 201 (19)
Blood donor 135 (40) 30 (12) 238 (36) 107 (10)
Prenatal care 0 (0) 40 (25) 4 (0.3) 510 (46)
Work-related 35 (15) 14 (4) 73 (10) 32 (2) 0.0001
Other 13 (6) 6 (3) 12 (1) 17 (1.5)
Lower testing rates can be associated to reduced like-lihood of early identifying certain population groups with prevention and treatment needs. The present study documents that young men and women aged between 16 and 19 have been less frequently tested, consis-tently shown in 1998 and 2005, without any signifi cant changes in in-between years. These differences may be unequal by systematically affecting less economically favored social groups.
Similarly, testing rates were lower in those aged 16–19 years in the US (12.2% in 1998,16 and 18.7% in 20023),
Canada (18%, 1995–199615), Italy (4.9% of men; 6.3%
of women26) and in other European countries.25
The literature confi rms that young people may resist HIV testing if they fi nd health services unfriendly.18,20
African studies have reported that services friendly to young people are those that assure confi dentiality, and provide well-trained and non-stigmatizing counselors, different strategies for the integration between family and social networks and young populations.a,b In the
US, although young people credit being tested due to provider’s recommendation, less than half of health pro-viders do that, disregarding the American Academy of Pediatrics recommendations.4 Low testing rates among
those aged 16 to 19 may suggest that prevention actions targeting this population are basically limited to infor-mation and male condom distribution at schools.21
Another population segment that did not show any progress in testing was illiterate men and women. This
fi nding corroborates other studies in Greece, Italy, Switzerland and Norway that showed lower testing rates among low schooling people,25 as well US
stud-ies.16 Illiterate people’s health status suffer from major
disadvantages in Brazil.1
Men and women with less than three per capita MMWs still had the lowest testing rates in 2005. Considering data on illiteracy and low income, it can be said that there persists socioeconomic inequalities in access to testing.
Despite higher testing rates in the North/Northeast regions, there were still regional inequalities in 2005. Compared to White, Black women were less often tested for HIV, which corroborates the Ministry of Health’s study fi ndings.a
Other major results of the present study were testing stabilization among private sector employees, business owners, unemployed and students, as well among those who reported sexual initiation before the age of 15. The literature did not have any other studies on HIV testing in these subpopulations.
Women who reported sexual initiation before the age of 15 were more frequently tested. The literature has established an association between age at sexual initia-tion and HIV infecinitia-tion.14,23 In Brazil, D’Oliveira et alb a França-Junior,I , Lopes, F, Paiva, V, Venturi, G Acesso ao teste anti-HIV no Brasil 2003: a pesquisa MS/IBOPE [internet]. Brasília: Ministério da Saúde; 2003. Available from: http://www.aids.gov.br/main.asp?ViewID=%7BA62BDF6E%2D914A%2D4DF7%2DA10E%2DCE06AB4E26F7% 7D¶ms=itemID=%7BAEAB8D56%2D0731%2D4276%2DA8B2%2DB7C2729EE8BB%7D;&UIPartUID=%7B585687B3%2DF650%2D4 59E%2DAC6E%2D23C0B92FB5C4%7D [Cited 2008 April 01].
b Pesquisa sobre fatores associados à violência por parceiros íntimos em mulheres em duas regiões do Brasil, por d’Oliveira AFL, Schraiber LB, França-Junior I, Ludermir AB, Portella AP, Diniz CSG (unpublished data).
Table 5. Counseling characteristics of HIV testing reported by urban Brazilians men and women aged 16 to 65. Brazil, 2005
Variable n (%) Men Women
n (%) n (%)
Talked about it before the last testing?
Yes, individual session 641 (35.2) 230 (33.6) 411 (36.4)
Yes, group session 123 (6.7) 46 (7.1) 77 (6.5)
Did not receive advice 995 (55.4) 394 (55.6) 601 (55.2)
Did not know she/he was being tested 29 (1.6) 17 (2.5) 12 (1.0)
Do not know 13 (0.8) 5 (0.9) 8 (0.8)
Refusal 3 (0.2) 1 (0.3) 2 (0.2)
Total 1804 693 1111
Talked about it after the last testing?
Yes, individual session 624 (35.2) 193 (29.7) 431 (39.0)
Yes, group session 90 (4.9) 31 (5.3) 59 (4.7)
Did not receive advice 1018 (55.5) 438 (60.3) 580 (52.3)
Did not know she/he was being tested 26 (1.4) 13 (1.8) 13 (1.2)
Did not get the results 29 (1.6) 13 (1.7) 16 (1.5)
Do not know 16 (1.3) 5 (1.3) 8 (1.2)
Refusal 1 (0.05) 0 (0) 1 (0.08)
described that one out of three women in the city of São Paulo, Southeast region, and Zona da Mata area in Pernambuco, Northeast region, reported forced sexual initiation before the age of 15. Forced early sexual initiation can increase the incidence of HIV infection and make more women seek testing.
Between 1998 and 2005, there was no increase in test-ing rates among women who reported four or more sexual partners in the fi ve years prior to interview or who were self-assessed as high risk for HIV infection. This trend requires attention since these groups are more likely to get HIV infection.4
De Cock et al10 (2006) stated that for equitably scaling
up HIV testing innovative approaches are required in-cluding offering new methods, such as saliva or fi nger-tip testing, as well as actions for testing entire families at health facilities, at home or in community settings. However, these strategies can be effective only along with strategies for fi ghting stigma associated to HIV. In fact, Brazilian population segments (illiterate and poor men) excluded from HIV testing scale-up are showing persistent increase in AIDS incidence since 1999.11,27
Socioeconomic, generational, regional, ethnic/racial inequalities in testing are consistent with diffi culties faced by other countries such as Italy, Canada and the US.15,16,25,26
In the present study, non-voluntary (blood donation and work-related) testing rates decreased in 2005, especially among men, while prenatal care testing increased in settings suggesting non-voluntary testing without counseling. In 1998, 80% of urban Brazilian population believed HIV testing should be mandatory to everyone regardless of their HIV vulnerability.a There
can be seen in this scenario the introduction of effec-tive practices for mandatory testing without counseling among women during prenatal and delivery care for prevention of vertical transmission.13,19,28 This is a
con-tradictory approach for scaling up coverage as it does not safeguard women’s right to autonomy and body integrity. Increased coverage and mandatory testing are relevant issues that should be discussed along with the role of counseling. The CDC4 and WHO/UNAIDS32
recommendations on HIV testing and counseling in health settings share a common proposal of scaling up testing promoted by health providers.
Despite the consensus, issues related to scaling up testing offered by health providers and routine testing should be discussed. These situations may involve test-ing without consent and produce arguments between
human rights advocates and public health authorities on the actual need, and to what extent, the principles of counseling, consent and confi dentiality30 should
be compromised. It is necessary to identify specifi c population and epidemic scenarios to fi nd a balance between scaling up testing and voluntary counseling, particularly among more HIV vulnerable populations, and scaling up testing by health professionals. Since 1997, counseling has been referred to as an inter-vention/technology to be more widely introduced in dif-ferent health settings available in healthcare network.b
A potential limitation of the present study was an increase in sample representation of urban population. Comparing 1998 and 2005 data, based on IBGE’s 2000 Census, both study samples included 90.2% of the same urban population.6 The increased number of census
tracts and the inclusion of tracts with more than 100,000 inhabitants in the 2005 sample has broaden its repre-sentativeness (from 77.7 to 87.7% of urban population) without losing its comparability to the previous survey. Refusal rate was relatively low and declined: 11.5% in 1998 and 7.5% in 2005.6,a Therefore, in both surveys,
the study comprised representative and comparable samples of urban Brazilian population.
It is not expected that increased representativeness of 2005 sample would have an impact on the estimated testing scaling up compared to 1998. There are no em-pirical data to support that those people living in urban areas with 100,000 to 200,000 inhabitants have different testing behaviors that would explain increased testing among women and stabilization among men.
In the 2005 survey, a higher number of individuals were sampled. However, some populations remained in small numbers and showed wide confi dence intervals (CIs) such as women and men in certain occupations (public sector employees, unemployed, students, liberal profes-sionals and business owners); followers of spiritism and African-Brazilian religions; those having homosexual or bisexual partners or who were self-assessed as high risk for HIV infection. Widowed men and women with more than six sexual partners still showed wide CIs. Further survey studies should include larger samples, similar to international designs on sexuality and risk perception including samples of more than 10,000 interviewees. In the analysis of testing during lifetime, it should be taken into consideration the likelihood of inconsistent answers due to respondents’ inaccuracies or forgetful-ness, even regarding testing in the year prior to the interview. In the US, an analysis of national surveys identifi ed different reporting by the same individual regarding being tested in a year time.24 However, this a Berquó E, coordinator. In: Comportamento sexual da população brasileira e percepções do HIV/AIDS. Brasília (DF): Ministério da Saúde, Secretaria de Políticas de Saúde, Coordenação Nacional DST e Aids; 2000. (Série avaliação, 4).
study did not manage to measure the direction of bias (under or overestimation) besides the fact that it was conducted between 1990 and 1992 before HAART introduction.
Population-based studies, on the other hand, may un-derestimate response rates of sensitive questions that may stir up stigma and discrimination. The Brazilian Institute of Public Opinion and Statistics (IBOPE) was responsible for data collection in the 2005 survey and sought to apply potentially mitigating procedures, e.g., interviewees were interviewed by same-sex interview-ers. Also, to prevent underestimation, it was explicitly explained to interviewers and interviewees that test results would not be asked during data collection. To strengthen testing as a preventive strategy, there is a need to increase offer along with counseling. This combination has the potential of breaking off the HIV
transmission chain as it allows people to know their HIV status and ponder on infection risks and preven-tion through behavioral changes.a,b It is estimated that
new infections could be reduced by 30% a year if all infected people would know their HIV status.4
Campaigns such as “Fique Sabendo”c (Did you know?)
are opportune but should focus on those segments that have been systematically excluded and be implemented to assure the rights of those being tested. Future aware-ness campaigns need to reinforce that HIV testing should always be voluntary, confi dential and offered along with high-quality counseling. Access to such testing is a citizen’s right and a provider’s duty in both public and private settings. Referral and counter-referral mechanisms should also be established, notably where they are defi cient: blood banks, private laboratories, basic health units, among others.
a Ministério da Saúde. Programa Nacional de controle de DST/AIDS. Aconselhamento em DST, HIV e AIDS - Diretrizes e procedimentos básicos. Brasília; 1997.
b Ministério da Saúde. Diretrizes dos Centros de Testagem e Aconselhamento (CTA) – Manual. Brasília; 1999.
1. Almeida MF, Barata RB, Monteiro CV, Silva ZP. Prevalência de doenças crônicas auto-referidas e utilização de serviços de saúde, PNAD/1998, Brasil.
Cien Saude Col. 2002;7(4):743-56.
2. Anderson JE, Mosher WD, Chandra A. Measuring HIV risk in the U.S. population aged 15-44: Results from
Cycle 6 of the National Survey of Family Growth. Adv
Data. 2006;(377):1-27.
3. Anderson JE, Chandra A, Mosher WD. HIV Testing in
the United States, 2002. Adv Data. 2005;(363):1-32.
4. Branson BM, Handsfi eld HH, Lampe MA, Janssen RS, Taylor AW, Lyss SB, et al. Revised recommendations for HIV testing of adults, adolescents, and pregnant
women in health-care settings. MMWR Morb Mortal
Wkly Rep. 2006;55(RR-14):1-17.
5. Brito AM, Sousa JL, Luna CF, Dourado I. Tendência da transmissão vertical de Aids após terapia
anti-retroviral no Brasil. Rev Saude Publica.
2006;40(Supl):18-22.
6. Bussab W de O, Grupo de Estudos em População, Sexualidade e Aids. Plano amostral da Pesquisa Nacional sobre Comportamento Sexual e Percepções
sobre HIV/Aids, 2005. Rev Saude Publica.
2008;42(Supl 1):12-20.
7. Buss PM, Pellegrini Filho A. Iniqüidades em saúde no Brasil, nossa mais grave doença: comentários sobre o documento de referência e os trabalhos da Comissão Nacional sobre Determinantes Sociais da Saúde. Cad. Saude Publica [periódico na internet]. 2006;22(9). Disponível em: http://www.scielo.br/scielo.
php?script=sci_arttext&pid=S0102-311X2006000900 033&lng=en&nrm=iso [Acesso em 14 abr 2008]. doi: 10.1590/S0102-311X2006000900033
8. Cassel MM, Surdo A. Testing the limits of case fi nding
for HIV prevention. Lancet Infect Dis. 2007;7(7):491-5.
9. D’Oliveira AFL. Health care and education: a
discussion of power in women’s health care. Interface
Comun Saude Educ.1999;3(4):105-22.
10. De Cock KM, Bunnell R, Mermin J. Unfi nished business - expanding HIV testing in developing
countries. N Engl J Med. 2006;354(5):440-2.
11. Dourado I, Veras MASM, Barreira D, Brito AM. Tendências da epidemia de Aids no Brasil após
a terapia anti-retroviral. Rev Saude Publica.
2006;40(Supl):9-17.
12. França Junior I, Ayres JRCM. Saúde Pública e Direitos Humanos. In: Zóboli E, Fortes P, organizadores. Bioética e saúde pública. São Paulo: Loyola/Centro Universitário São Camilo; 2003. p. 63-9.
13. Goldani MZ, Rosa H, Giugliani E, Tomkins A, Scanlon T, Castilhos K, et al. Voluntary counselling and HIV
testing during antenatal care in Southern Brazil. Rev
Saude Publica. 2003;37(5):552-8.
14. Hallett TB, Lewis JJC, Lopman BA, Nyamukapa CA, Mushati P, Wambe M, et al. Age at First Sex and
HIV Infection in Rural Zimbabwe. Stud Fam Plann.
2007;38(1):1-10.
15. Houston S, Archibald CP, Strike C, Sutherland D. Factors associated with HIV testing among Canadians:
results of a population-based survey. Int J STD AIDS.
1998;9(6):341-6.
16. Inungu JN. Potential barriers to seeking human immunodefi ciency virus testing among adults in the United States: data from the 1998 National
Health Interview Survey. AIDS Patient Care STDS.
2002;16(6):293-9.
17. Jeannin A, Cohen M, Bajos N. Voluntary HIV testing. In: Hubert M, Bajos N, Sandfort T, organizers. Sexual Behaviour and HIV/AIDS in Europe. London: UCL Press; 1998. p.287-302.
18. McCauley AP. Equitable access to HIV counseling and testing for youth in developing countries: a review of current practice. Washington, DC: Population Council; 2004. (Horizons Report).
19. Morimura MCR, Mendes MDC, Souza AI, Alencar LCA. Freqüência de testagem rápida para o HIV durante a admissão para o parto em puérperas no Instituto Materno Infantil Prof. Fernando Figueira, IMIP.
Rev Bras Saude Matern Infant. 2006;6(Supl 1):s69-76.
20. Oberzaucher N, Baggaley R. HIV Voluntary Counseling and Testing: a gateway to prevention and care. Geneva: UNAIDS; 2002.
21. Paiva V, Pupo LR, Barboza R. O direito à prevenção e os desafi os da redução da vulnerabilidade ao HIV no
Brasil. Rev Saude Publica. 2006;40(Supl):109-19.
22. Parker RG, Aggleton P. HIV and AIDS-related stigma and discrimination: a conceptual framework and
implications for action. Soc Sci Med. 2003;57(1):13-24.
23. Pettifor AE, van der Straten A, Dunbar MS, Shiboski SC, Padian NS. Early age of fi rst sex: a risk factor for
HIV infection among women in Zimbabwe. AIDS.
2004;18(10):1435-42.
24. Phillips KA, Catania JA. Consistency in self-reports of HIV testing: longitudinal fi ndings from the National
AIDS Behavioral Surveys. Public Health Rep.
1995;110(6):749-53.
25. RenziC,ZantedeschiE,SignorelliC, NEMGroup.
Voluntary HIV testingin Europe. Scand J Public Health.
2004;32(2):102-10.
26. Renzi C, Zantedeschi E, Signorelli C, Osborn JF. Factors associated with HIV testing: results from an Italian
General Population Survey. Prev Med. 2001;32(1):40-8.
27. Rodrigues-Júnior AL, Castilho EA. A epidemia de Aids no Brasil, 1991 – 2000: descrição de espaço temporal.
Rev Soc Bras Med Trop. 2004;37(4):312-7.
28. Segurado AC, Miranda SD, Latorre MD, Brazilian Enhancing Care Initiative Team. Evaluation of the Care of Women Living with HIV/AIDS in Sao Paulo, Brazil.
AIDS Patient Care STDS. 2003;17(2):85-93.
29. Signorelli C, Pasquarella C, Limina RM, Colzani E, Fanti M, Cielo A, et al. Third Italian national survey on knowledge, attitudes, and sexual behaviour in relation to HIV/AIDS risk and the role of health education
campaigns. Eur J Public Health. 2006;16(5):498-504.
30. Tarantola D, Gruskin S. New guidance on
recommended HIV testing and counseling. Lancet.
2007;370(9583):202-3.
31. Valdiserri RO. HIV counseling and testing: its evolving
role in HIV prevention. AIDS Educ Prev. 1997;9(3
Suppl):2-13.
Article based on the data from the survey “Comportamento sexual e percepções da população brasileira sobre HIV/Aids (Sexual behavior and perceptions of Brazilian population on HIV/AIDS)”, sponsored by the Brazilian Ministry of Health through the Centro Brasileiro de Análise e Planejamento (Process n. ED 213427/2004).
This article followed the same peer-review process as any other manuscript submitted to this journal, anonymity was guaranteed for both authors and reviewers.
Editors and reviewers declare they have no confl ict of interests that could affect the judgment process. The authors declare they have no confl ict of interests.
32. World Health Organization; UNAIDS. Guidance on provider-initiated HIV testing and counselling in health facilities. Geneva; 2007.
33. Zwahlen M, Neuenschwander BE, Jeannin A, Dubois-Arber F, Vlahov D. HIV testing and retesting for
men and women in Switzerland. Eur J Epidemiol.