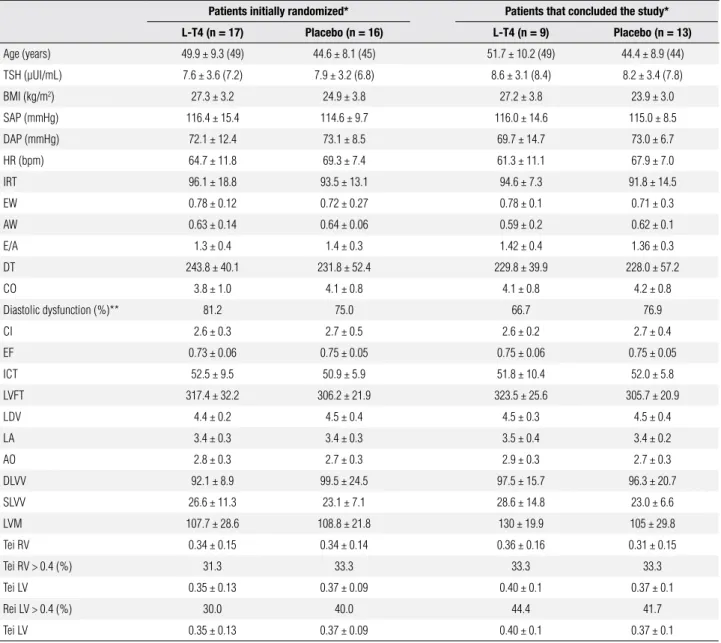
Table 1. Baseline characteristics of patients initially randomized to the intervention groups and of patients that concluded the study, according to the intervention group (placebo or L-T4 use)
Patients initially randomized* Patients that concluded the study*
L-T4 (n = 17) Placebo (n = 16) L-T4 (n = 9) Placebo (n = 13) Age (years) 49.9 ± 9.3 (49) 44.6 ± 8.1 (45) 51.7 ± 10.2 (49) 44.4 ± 8.9 (44)
TSH (µUI/mL) 7.6 ± 3.6 (7.2) 7.9 ± 3.2 (6.8) 8.6 ± 3.1 (8.4) 8.2 ± 3.4 (7.8)
BMI (kg/m2) 27.3 ± 3.2 24.9 ± 3.8 27.2 ± 3.8 23.9 ± 3.0
SAP (mmHg) 116.4 ± 15.4 114.6 ± 9.7 116.0 ± 14.6 115.0 ± 8.5
DAP (mmHg) 72.1 ± 12.4 73.1 ± 8.5 69.7 ± 14.7 73.0 ± 6.7
HR (bpm) 64.7 ± 11.8 69.3 ± 7.4 61.3 ± 11.1 67.9 ± 7.0
IRT 96.1 ± 18.8 93.5 ± 13.1 94.6 ± 7.3 91.8 ± 14.5
EW 0.78 ± 0.12 0.72 ± 0.27 0.78 ± 0.1 0.71 ± 0.3
AW 0.63 ± 0.14 0.64 ± 0.06 0.59 ± 0.2 0.62 ± 0.1
E/A 1.3 ± 0.4 1.4 ± 0.3 1.42 ± 0.4 1.36 ± 0.3
DT 243.8 ± 40.1 231.8 ± 52.4 229.8 ± 39.9 228.0 ± 57.2
CO 3.8 ± 1.0 4.1 ± 0.8 4.1 ± 0.8 4.2 ± 0.8
Diastolic dysfunction (%)** 81.2 75.0 66.7 76.9
CI 2.6 ± 0.3 2.7 ± 0.5 2.6 ± 0.2 2.7 ± 0.4
EF 0.73 ± 0.06 0.75 ± 0.05 0.75 ± 0.06 0.75 ± 0.05
ICT 52.5 ± 9.5 50.9 ± 5.9 51.8 ± 10.4 52.0 ± 5.8
LVFT 317.4 ± 32.2 306.2 ± 21.9 323.5 ± 25.6 305.7 ± 20.9
LDV 4.4 ± 0.2 4.5 ± 0.4 4.5 ± 0.3 4.5 ± 0.4
LA 3.4 ± 0.3 3.4 ± 0.3 3.5 ± 0.4 3.4 ± 0.2
AO 2.8 ± 0.3 2.7 ± 0.3 2.9 ± 0.3 2.7 ± 0.3
DLVV 92.1 ± 8.9 99.5 ± 24.5 97.5 ± 15.7 96.3 ± 20.7
Impact of subclinical hypothyroidism treatment in
systolic and diastolic cardiac function: errata
Ricardo Mendes Martins, Regina Helena Alves Fonseca, Marta Maria Turano Duarte, Vaneska Spinelli Reuters, Márcia Martins Ferreira, Cloyra Almeida, Alexandru Buescu, Patrícia de Fátima dos Santos Teixeira, Mario Vaisman
Correção do Artigo
Impact of subclinical hypothyroidism treatment in systolic and diastolic cardiac function
Arq Bras Endocrinol Metab. 2011;55(7):460-7
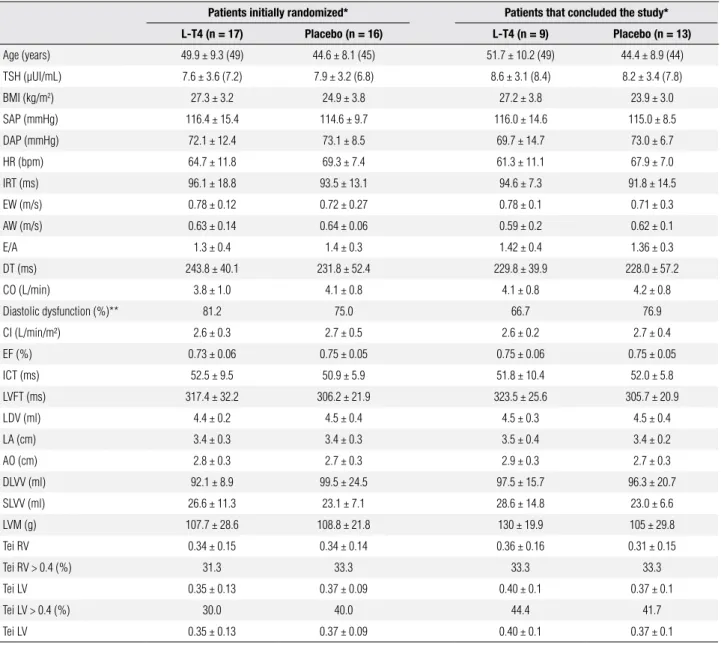
Table 1. Baseline characteristics of patients initially randomized to the intervention groups and patients that concluded the study, according to the intervention group (placebo or L-T4 use)
Patients initially randomized* Patients that concluded the study*
L-T4 (n = 17) Placebo (n = 16) L-T4 (n = 9) Placebo (n = 13) Age (years) 49.9 ± 9.3 (49) 44.6 ± 8.1 (45) 51.7 ± 10.2 (49) 44.4 ± 8.9 (44) TSH (µUI/mL) 7.6 ± 3.6 (7.2) 7.9 ± 3.2 (6.8) 8.6 ± 3.1 (8.4) 8.2 ± 3.4 (7.8)
BMI (kg/m2) 27.3 ± 3.2 24.9 ± 3.8 27.2 ± 3.8 23.9 ± 3.0
SAP (mmHg) 116.4 ± 15.4 114.6 ± 9.7 116.0 ± 14.6 115.0 ± 8.5
DAP (mmHg) 72.1 ± 12.4 73.1 ± 8.5 69.7 ± 14.7 73.0 ± 6.7
HR (bpm) 64.7 ± 11.8 69.3 ± 7.4 61.3 ± 11.1 67.9 ± 7.0
IRT (ms) 96.1 ± 18.8 93.5 ± 13.1 94.6 ± 7.3 91.8 ± 14.5
EW (m/s) 0.78 ± 0.12 0.72 ± 0.27 0.78 ± 0.1 0.71 ± 0.3
AW (m/s) 0.63 ± 0.14 0.64 ± 0.06 0.59 ± 0.2 0.62 ± 0.1
E/A 1.3 ± 0.4 1.4 ± 0.3 1.42 ± 0.4 1.36 ± 0.3
DT (ms) 243.8 ± 40.1 231.8 ± 52.4 229.8 ± 39.9 228.0 ± 57.2
CO (L/min) 3.8 ± 1.0 4.1 ± 0.8 4.1 ± 0.8 4.2 ± 0.8
Diastolic dysfunction (%)** 81.2 75.0 66.7 76.9
CI (L/min/m²) 2.6 ± 0.3 2.7 ± 0.5 2.6 ± 0.2 2.7 ± 0.4
EF (%) 0.73 ± 0.06 0.75 ± 0.05 0.75 ± 0.06 0.75 ± 0.05
ICT (ms) 52.5 ± 9.5 50.9 ± 5.9 51.8 ± 10.4 52.0 ± 5.8
LVFT (ms) 317.4 ± 32.2 306.2 ± 21.9 323.5 ± 25.6 305.7 ± 20.9
LDV (ml) 4.4 ± 0.2 4.5 ± 0.4 4.5 ± 0.3 4.5 ± 0.4
LA (cm) 3.4 ± 0.3 3.4 ± 0.3 3.5 ± 0.4 3.4 ± 0.2
AO (cm) 2.8 ± 0.3 2.7 ± 0.3 2.9 ± 0.3 2.7 ± 0.3
DLVV (ml) 92.1 ± 8.9 99.5 ± 24.5 97.5 ± 15.7 96.3 ± 20.7
SLVV (ml) 26.6 ± 11.3 23.1 ± 7.1 28.6 ± 14.8 23.0 ± 6.6
LVM (g) 107.7 ± 28.6 108.8 ± 21.8 130 ± 19.9 105 ± 29.8
Tei RV 0.34 ± 0.15 0.34 ± 0.14 0.36 ± 0.16 0.31 ± 0.15
Tei RV > 0.4 (%) 31.3 33.3 33.3 33.3
Tei LV 0.35 ± 0.13 0.37 ± 0.09 0.40 ± 0.1 0.37 ± 0.1
Tei LV > 0.4 (%) 30.0 40.0 44.4 41.7
Tei LV 0.35 ± 0.13 0.37 ± 0.09 0.40 ± 0.1 0.37 ± 0.1
p-values obtained in the comparison of each variable at baseline in the L-T4 and placebo group were > 0.100. * E/A ≤ 1.0 or IRT ≥ 100 ms or DT ≥ 220 ms. ** Frequency of patients with at least one of
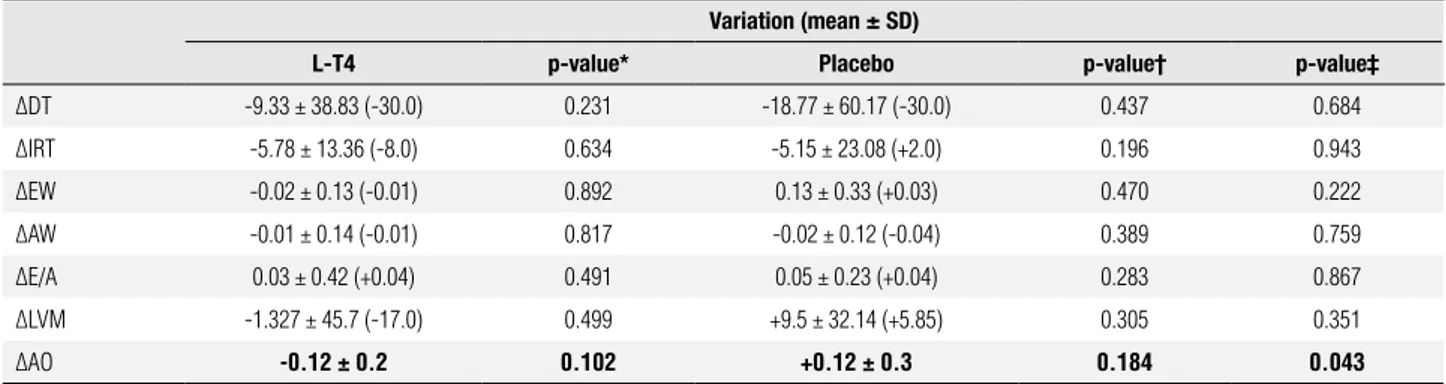
Table 2. Variation in specific parameters of diastolic function, left ventricle mass and aortic root diameter Variation (mean ± SD)
L-T4 p-value* Placebo p-value† p-value‡
ΔDT -9.33 ± 38.83 (-30.0) 0.231 -18.77 ± 60.17 (-30.0) 0.437 0.684 ΔIRT -5.78 ± 13.36 (-8.0) 0.634 -5.15 ± 23.08 (+2.0) 0.196 0.943
ΔEW -0.02 ± 0.13 (-0.01) 0.892 0.13 ± 0.33 (+0.03) 0.470 0.222
ΔAW -0.01 ± 0.14 (-0.01) 0.817 -0.02 ± 0.12 (-0.04) 0.389 0.759
ΔE/A 0.03 ± 0.42 (+0.04) 0.491 0.05 ± 0.23 (+0.04) 0.283 0.867
ΔLVM -1.327 ± 45.7 (-17.0) 0.499 +9.5 ± 32.14 (+5.85) 0.305 0.351
ΔAO -0.12 ± 0.2 0.102 +0.12 ± 0.3 0.184 0.043
*: Comparison between before and after means of the L-T4 group (paired test); †: Comparison between before and after means in the placebo group (paired test); ‡: Comparison between mean variations that occurred in the L-T4 and placebo groups.
Table 2. Variation in specific parameters of diastolic function, left ventricle mass and aortic root diameter Variation (mean ± SD)
L-T4 p-value* Placebo p-value† p-value‡
ΔDT (ms) -9.33 ± 38.83 (-30.0) 0.231 -18.77 ± 60.17 (-30.0) 0.437 0.684 ΔIRT (ms) -5.78 ± 13.36 (-8.0) 0.634 -5.15 ± 23.08 (+2.0) 0.196 0.943
ΔEW (m/s) -0.02 ± 0.13 (-0.01) 0.892 0.13 ± 0.33 (+0.03) 0.470 0.222 ΔAW (m/s) -0.01 ± 0.14 (-0.01) 0.817 -0.02 ± 0.12 (-0.04) 0.389 0.759
ΔE/A 0.03 ± 0.42 (+0.04) 0.491 0.05 ± 0.23 (+0.04) 0.283 0.867
ΔLVM (g) -1.327 ± 45.7 (-17.0) 0.499 +9.5 ± 32.14 (+5.85) 0.305 0.351
ΔAO (cm) -0.12 ± 0.2 0.102 +0.12 ± 0.3 0.184 0.043
*: Comparison between before and after means of the L-T4 group (paired test); †: Comparison between before and after means in the placebo group (paired test); ‡: Comparison between mean variations that occurred in the L-T4 and placebo groups.
Na página 464, na table 2, onde se lê:
Hypertension-related factors in patients with active
and inactive acromegaly: errata
Daniela Fedrizzi, Ticiana Costa Rodrigues, Fabíola Costenaro, Rosana Scalco, Mauro Antônio Czepielewski
Correção do Artigo
Hypertension-related factors in patients with active and inactive acromegaly
Arq Bras Endocrinol Metab. 2011;55(7):468-74
No Abstract onde se lê:
Conclusions: Our findings suggest that blood pressure levels in patients with active acromegaly are very similar, and depend on
excess GH. However, once the disease becomes controlled and IGF-1 levels decrease, their blood pressure levels will depend on the other cardiovascular risk factors.
Leia-se:
Conclusions: Blood pressure (BP) levels in patients with active acromegaly dependent of the GH excess. However, once the
A rational approach to the diagnosis of polycystic
ovarian syndrome during adolescence: errata
Paulina M. Merino, Ethel Codner, Fernando Cassorla
Correção do Artigo
A rational approach to the diagnosis of polycystic ovarian syndrome during adolescence
Arq Bras Endocrinol Metab. 2011;55(8):590-8
Na página 595, primeira coluna, segundo parágrafo onde se lê:
Villarroel and cols. (40), from our group, reported that girls with PCOM have higher AMH levels than girls
with-out PCOM (72.5 ± 6.1
vs
. 33.4 ± 2.6 pmol/L; P < 0.0001), and lower FSH levels (5.4 ± 0.3; 6.2 ± 0.2 mUI/ml;
P < 0.036).
Leia-se:
Villarroel and cols. (40), from our group, reported that girls with PCOM have higher AMH levels than girls without
PCOM (72.5 ± 6.1
vs.
33.4 ± 2.6 pmol/L; P < 0.0001), and lower FSH levels (5.4 ± 0.3
vs.
6.2 ± 0.2 mUI/ml;
P < 0.036).
Na página 595, segunda coluna, último parágrafo onde se lê:
In 160 obese adolescents girls, the subgroup with the metabolic syndrome (48 girls) demonstrated signiicantly
higher testosterone and DHEA-S concentrations compared with the 112 girls without MS.
Leia-se:
In 160 obese adolescents girls, the subgroup with the metabolic syndrome
(MS)
(48 girls) demonstrated
signii-cantly higher testosterone and DHEA-S concentrations compared with the 112 girls without MS.
Na página 595, na legenda da igura, onde se lê:
Figure 1.
Leia-se:
Na página 596, Table 2, onde se lê:
Table 2. Proposed diagnostic criteria for polycystic ovarian syndrome in adolescence. Features: + Present, - Absent, +/- Controversial. The presence of a “√” indicates that this classification agrees that the diagnosis of PCOS phenotype. The diagnosis of oligo-anovulation and hyperandrogenism differ between adults and adolescents (see text). Adapted from “Merino P, Schulin-Zeuthen C, Codner E. Current diagnosis of polycystic ovary syndrome: expanding the phenotype but generating new questions. Rev Med Chil. 2009;137:1071-80” and “Azziz R, Carmina E, Dewailly D, et al. Positions statement: criteria for defining polycystic ovary syndrome as a predominantly hyperandrogenic syndrome: an Androgen Excess Society guideline. J Clin Endocrinol Metab. 2006;91:4237-45”.
Potential phenotypes
Diagnostic criteria A B C D E F G H I J K L M N O P
Biochemical hyperandrogenism + + + + - - + - + - + - - - +
-Hirsutism + + - - + + + + - - + - - + -
-Oligo-anovulation + + + + + + - - - + - - + - -
-PCOM + - + - + - + + + + - + - - -
-PCOS in adults
NIH 1990 √ √ √ √ √ √
Rotterdam 2003 √ √ √ √ √ √ √ √ √ √
AES 2006 √ √ √ √ √ √ √ √ √ √
PCOS in adolescence √ √ √ √ √ √ √ √ √ √
Our proposal √ √ +/- √ √ √ +/-
Long-term metabolic risk √ √ √ √ √ √ +/- +/- +/- -
Leia-se:
Table 2. Proposed diagnostic criteria for polycystic ovarian syndrome in adolescence. Features: + Present, - Absent, +/- Controversial. The presence of a “√” indicates that this classification agrees that the diagnosis of PCOS phenotype. The diagnosis of oligo-anovulation and hyperandrogenism differ between adults and adolescents (see text). Adapted from “Merino P, Schulin-Zeuthen C, Codner E. Current diagnosis of polycystic ovary syndrome: expanding the phenotype but generating new questions. Rev Med Chil. 2009;137:1071-80” and “Azziz R, Carmina E, Dewailly D, et al. Positions statement: criteria for defining polycystic ovary syndrome as a predominantly hyperandrogenic syndrome: an Androgen Excess Society guideline. J Clin Endocrinol Metab. 2006;91:4237-45”.
Potential phenotypes
Diagnostic criteria A B C D E F G H I J K L M N O P
Biochemical Hyperandrogenism + + + + - - + - + - + - - - +
-Hirsutism + + - - + + + + - - + - - + -
-Oligo-anovulation + + + + + + - - - + - - + - -
-PCOM + - + - + - + + + + - + - - -
-PCOS in adults
Hormônio de crescimento em crianças e
adolescentes com ibrose cística: errata
Pollyana Garcia Amorim, Thaís de Barros Mendes, Lílian Santiago Pinho de Oliveira, Gil Guerra-Júnior, José Dirceu Ribeiro