O
riginal
a
r
ticle
RESUMO
Objeivou-se invesigar a correlação exis-tente entre indicadores antropométricos e a qualidade do sono de universitários brasileiros por meio do Índice de Qualidade do Sono de Pitsburgh. Estudo transversal, realizado com 702 universitários entre março de 2010 e junho de 2011. A cor-relação indicou que os casos de obesidade foram maiores entre os estudantes bons dormidores. Por outro lado, o sobrepeso e os valores elevados das circunferências cervical e abdominal predominaram entre os maus dormidores. Assim, além dos prejuízos ocasionados pelos distúrbios do sono isoladamente, ressaltam-se riscos adicionais devido à associação da má quali-dade de sono com o sobrepeso, a obesiquali-dade central e a elevação do perímetro cervical.
DESCRITORES Transtornos do sono Estudantes Obesidade Saúde do adulto ABSTRACT
The current study invesigated the correla-ion between anthropometric indicators and sleep quality among Brazilian university students using the Pitsburgh Sleep Quality Index. A cross-secional assessment with 702 university students was conducted be-tween March 2010 and June 2011. Results showed that cases of obesity were more frequent among students who were good sleepers. On the other hand, overweight and high cervical and abdominal circum-ference was most prominent among poor sleepers. Thus, apart from the damage caused by sleep disorders alone, addiional risks due to the associaion between poor sleep quality and being overweight, central obesity, and increased cervical perimeter are highlighted.
DESCRIPTORS Sleep disorders Students Obesity Adult health
RESUMEN
El objeivo de este estudio fue invesigar la correlación que existe entre los índices antro-pométricos y la calidad del sueño en universi-tarios brasileños, a través del Índice de Calidad del Sueño de Pitsburgh. Estudio transversal, realizado en 702 estudiantes universitarios entre marzo de 2010 y junio de 2011. La correlación indicó que los casos de obesidad fueron mayores entre los estudiantes que dormían bien. Por otra parte, el sobrepeso y elevados valores de circunferencia cervical y abdominal fueron predominantes entre los que dormían poco. Así, además de los daños causados por los trastornos del sueño, aisla-damente, se resaltan los riesgos adicionales debido a la asociación de la mala calidad del sueño con el sobrepeso, la obesidad central y el aumento del perímetro cervical.
DESCRIPTORES Trastornos del sueño Estudiantes Obesidad Salud del adulto
Correlation between anthropometric
indicators and sleep quality among
Brazilian university students
*CORRELAÇÃO ENTRE INDICADORES ANTROPOMÉTRICOS E A QUALIDADE DO SONO DE UNIVERSITÁRIOS BRASILEIROS
CORRELACIÓN ENTRE LOS INDICADORES ANTROPOMÉTRICOS Y LA CALIDAD DEL SUEÑO EN UNIVERSITARIOS BRASILEÑOS
Hérica Cristina Alves de Vasconcelos1, Luciana Vládia Carvalhêdo Fragoso2, Niciane Bandeira Pessoa Marinho3, Márcio Flávio Moura de Araújo4,
Roberto Wagner Júnior Freire de Freitas5, Maria Lúcia Zanetti6, Marta Maria Coelho Damasceno7
*Extracted from the thesis “Qualidade do sono de universitários e sua interface com a síndrome metabólica e indicadores de saúde,” Federal University of Ceará, 2012 1 Nurse. PhD Student, Post-Graduate Course in Nursing, Federal University of Ceará. Professor of Nursing at the Rainha do Sertão Catholic
Faculty. Fortaleza, CE, Brazil. [email protected] 2 Nurse. PhD Student, Post-Graduate Course in Nursing, Federal University of Ceará. Nurse at the
Walter Cantídio University Hospital and São José Hospital. Fortaleza, CE, Brazil. luciana.vladia @hotmail.com 3 Nurse. PhD in Nursing. Professor of Nursing,
Federal University of Maranhão. Imperatriz, MA, Brazil. [email protected] 4 Nurse. PhD Student, Post-Graduate Course in Nursing, Federal
University of Ceará. 1st Assistant Professor of Nursing, Federal University of Piauí. Campus Floriano, PI, Brazil. [email protected] 5 Nurse. PhD in
Nursing. Associate Professor at the Ribeirão Preto Nursing School, University of São Paulo. Ribeirão Preto, SP, Brazil. [email protected] 6 Nurse. PhD in
INTRODUCTION
In recent decades, the introducion of new technolo-gies has transformed cultural habits and lifestyles among university students around the world. However, this has contributed to the development of sleep disorders among these young adults (1). Although poor sleep quality is
com-mon acom-mong the elderly(2) and nightshit workers(3), recent
research has shown that university students have also been afected, both naionally(4) and internaionally(5).
In general, sleep disorders carry various implicaions in-cluding, but not limited to, a loss in quality of life, autonomic dysfuncion, decreased academic and professional perfor-mance, and increased incidences of psychiatric disorders(4).
Moreover, sleep disorders are strongly associated with the appearance of cardiovascular disease(6), which can lead to
early mortality. Further consequences include intolerance to glucose, higher corisol levels during the night, and changes to sympatheic nervous system acivity(7).
The aforemenioned evidence suggests that the architecture and physiology of sleep is an acive, complex, and necessary process for physical and cogniive health. However, the speciic mechanisms involved in the association between sleep duration and mortality are unclear(7). Thus, studies on the
causal relaionships between sleep, living condiions, and non-transmissible chronic diseases, especially among young adults, have been encouraged.
Researchers have already observed correlaions between sleep disorders and anthropometric indicators, such as body mass index and abdominal and cervical diameter(8-11). It is known that these
indica-tors, when outside a healthy range, are also considered risk factors for non-transmissible chronic diseases. Therefore, it is important to invesigate the associaion between these risk factors and sleep disorders to beter understand the complicaions that arise.
Nevertheless, the majority of sleep disorder cases are associated with respiratory disorders, such a sleep apnea syndrome. Such disorders indirectly contribute to low qual-ity sleep due to bouts of nighime awakening and periods of somnolence during the day. However, studies invesigaing the associaion between anthropometric measures and di-rect assessments of sleep quality using speciic instruments are scarce(11).
University students do not always develop healthy sleep habits. A large porion of this populaion has a de-compensated lifestyle, replacing hours meant for sleeping with social aciviies associated with alcohol consumpion and smoking(12). Addiionally, students tend to engage in
supplementary academic aciviies, such as extracurricular
internships, as well as scieniic iniiaion and monitoring, which further contribute to reduced nighime sleeping(4).
University students’ sleep paterns are difereniated from the rest of the populaion in that same age group, mak-ing it important to idenify the presence of irregulariies so that health educaional aciviies are promoted. Therefore, the current study was interested in invesigaing the correla-ion between anthropometric indicators and sleep quality among Brazilian university students using the Pitsburgh Sleep Quality Index (PSQI-BR).
METHOD
A cross-secional study was conducted between March 2010 and June 2011 at a public university in Ceará. At that ime, 17, 228 students were enrolled at all campuses within the city of Fortaleza, distributed across six domains of study: humaniies, exact sciences, agrarian sciences, health, and science and technology.
From this populaion, a simple random sample without replacement was calculated based on a for-mula for ininite populaions. A percentage of 50% (P=50% and Q=50%) was adopted, given that this value provides a maximum sample size when a signiicance level (α=.05) and relaive sampling error of 8% (absolute error=4%) are ixed. Thus, the sample size included 600 subjects. An addiional 10% sample size increase was added due to the loss of informaion from some quesion-naires. Overall, complete data were ob-tained from 702 university students.
The above sample was divided within each of the major areas of study at the in-situion. For paricipant selecion, at least two undergraduate courses were chosen for convenience from each area of study. Within each course, students from diferent semesters were selected.
The inclusion criteria were age ≥18 years; being duly enrolled in undergraduate courses in a classroom mode; residing in Fortaleza, Brazil; having paricipated in both stages of data collecion; and having a landline, cell phone, or e-mail for contact purposes. Those with any condiion that would interfere with the measurement of anthropo-metric data, and those who were pregnant, were excluded. Data collecion took place between February and June 2011 and was performed by three nurses and three previ-ously trained nursing students. Prior to data collecion, meet-ings with the course coordinators and department heads were held in order to explain the objecives and research methodology. It should be noted that informaion about the study was adverised via message boards within the selected courses, student emails, and the university website. This was done in order to include students who were not in the classroom at the ime of the irst recruitment.
University students’ sleep patterns are differentiated from the
rest of the population in that same age
group, making it important to identify
the presence of irregularities so that
Data collecion occurred in two phases. First, in the classroom, students answered a quesionnaire assessing so-ciodemographic data and sleep quality. Soso-ciodemographic data concerned students’ ideniicaion and socioeconomic status. The Brazilian Economic Classification Criterion (CCEB) was used, as prepared by the Naional Associaion of Research Companies (ANEP); this measure has been widely disseminated in the literature. This measure aims to determine the purchasing power of individuals and urban families. No claim is made to characterize the populaion in terms of social classes but in terms of economic classes:
A1 (30–34 points), A2 (25–29 points), B1 (21–24 points), B2 (17–20 points), C (11–16 points), D (6–10 points), and E (0–5 points)(13).
Sleep quality was assessed based on a translated ver-sion of the Pitsburgh Sleep Quality Index (PSQI), which evaluates the quality of sleep over the past month. This measure consists of ten quesions that include seven com-ponents: subjecive quality of sleep, sleep latency, sleep duraion, habitual sleep eiciency, sleep disturbances, use of sleeping medicaion, dayime sleepiness, and dis-turbances during the day(14).
The maximum PSQI score is 21 points, determined by the sum of the seven components. Each component is given a score between zero and three points. These scores are then combined to generate an overall PSQI score; the higher the score, the worse the quality of sleep. An overall PSQI score > 5 points indicates that the individual has diicul-ies in at least two components or moderate diiculdiicul-ies in more than three components. In the end, it is common to classify subjects into two groups: good (PSQI<5) and poor sleepers (PSQI>5)(14).
At a later date, the university students were invited to partake in the second phase of the study, in which the following anthropometric data were measured: weight, height, and abdominal and cervical circumference. Weight was obtained during a single measurement with the stu-dents standing barefoot on a scale (capacity of 150 kg with a precision of 0.1 kg) while wearing light clothing. Height, also obtained in a single measurement, was checked with a measuring tape that included a 0.5 cm scale. To ensure accurate height measurements, respondents were asked to stand erect and moionless, hands lat on their thighs, and heads adjusted to the Frankfurt plane.
From the height and weight measurements obtained, body mass index (BMI) was calculated, deined as the raio between weight (kg) and squared height (m). Students with BMI values ranging from 25.0 to 29.9 kg/m2 were
consid-ered overweight, and those with a BMI≥30 kg/m2(15) were
considered obese.
Abdominal circumference (AC) was measured with an inelasic measuring tape placedover the skin. While students stood upright, circumference was taken at the midpoint between the last rib and the upper edge of the
iliac crest at the end of the expiratory movement. Values ≥ 102 cm and ≥ 88 cm among men and women, respecively, were considered to be high(16).
Neck circumference (NC) was also measured using an inelasic measuring tape. Paricipants were asked to stand erect with their head posiioned in the Frankfurt horizontal plane, eyes facing forward. The measuring tape was posi-ioned just below the top edge of the laryngeal prominence, being applied perpendicularly along the axis of the neck and measured at the midpoint(10). For male paricipants,
the measurement was performed just below the Adam’s apple. Cutof values were set at ≥ 39 cm for men and ≥ 35 cm for women(17).
Data were entered three imes in an Excel worksheet and then exported into STATA version 8.0 staisical sot-ware. Data analysis consisted of validaing the internal consistency of the informaion entered and calculaing measures of central tendency based on a 95% conidence interval. To invesigate diferences between proporions of characterisics under analysis, Pearson’s Chi-squared or Fisher’s exact tests were used (when necessary). To examine the relaionship between anthropometric variables and sleep quality, Spearman’s linear correlaion (rs) and the Mann-Whitney tests were used.
The current study was submited to the Human Research Ethics Commitee of the Health Sciences Center, Federal University of Ceará, and approved according to protocol 208/2010. All ethical aspects concerning human research were followed.
RESULTS
702 university students within 24 undergraduate courses at the educaional insituion paricipated in the study. Most students were women (62.6%). Subjects’ mean age was 21.5 years (SD±4.5 years) with an asymmetrical distribuion to the right (Kolmogorov Sminorv with p<.001). 50.6% of respondents reported being of mixed race, and 36.1% reported being Caucasian (Table 1).
The percentage of students within each academic area was equivalent. A predominant number of students were in their third (20.8%) and irst semesters (19.5%).
Table 1 – Sociodemographic characteristics of university students by gender - Fortaleza, CE, Brazil, 2011
Characteristics n (%)Total
Gender
p-valueb
Men Women
262 (37.4) 439 (62.6)
n (%) n (%)
Age group (years) (n=696) 0.506
18 to 20 350 (50.3) 137 52.2 213 49.0
21 to 25 283 (40.7) 102 38.9 181 41.7
26 to 30 42 (6.0) 13 4.9 29 6.6
31 and older 21 (3.0) 10 3.8 11 2.5
Marital status (n=682)
Married/Partnership 42 (6.0) 11 4.2 31 7.0
Single 648 (93.0) 246 95.3 402 91.5
Widow 2 (0.3) - - 2 0.4
Separated 5 (0.7) 1 0.3 4 0.9
Color (n=682) 0.883
White 246 (36.1) 8 34.6 158 36.9
Black 53 (7.8) 21 8.2 32 7.4
Mixed race 345 (50.6) 132 51.9 213 49.7
Yellow 38 (5.6) 13 5.1 25 5.8
Economic classiication (n=698) 0.525
A 74 (10.6) 33 12.6 41 9.3
B 277 (39.7) 105 40.2 172 39.3
C 277 (39.7) 98 37.5 179 40.9
D and E 70 (10.0) 25 9.5 45 10.3
Family incomea (minimum wage) (n=596) 0.185
Less than 1 MW 24 (4.0) 13 5.8 11 2.9
1 to 3 MW 198 (33.2) 70 31.6 128 34.1
4 to 5 MW 140 (23.5) 46 20.8 94 25
Higher than 5 MW 234 (39.3) 92 41.6 142 37.8
Work status (n=696) 0.001
Only studies 454 (65.2) 149 57.3 305 70
Studies and works informally 126 (18.1) 60 23 56 12.8
Studies and works formally 116 (16.7) 51 19.6 75 17.2
Who the student lives with (n=694) 0.723
Alone 20 (2.9) 183 70.3 311 71.6
Parents 494 (71.2) 45 17.3 73 16.8
Relatives (siblings, uncles/aunts, cousins) 118 (17.0) 11 4.2 16 3.6
Partner 35 (5.0) 11 4.2 24 5.5
Friends 27 (3.9) 10 3.8 10 2.3
Straiicaion of BMI results by gender showed that the groups difered signiicantly (p<.001); women had higher rates of low (6.2%) and normal weight (74.7%), whereas men had higher percentages of overweight (32.4%) and obese (7.6%).
Regarding anthropometric data, AC, NC, weight, and height averages of 79.1 cm (SD±25.5 cm), 33.7 cm (SD±3.3 cm), 64.1 kg (SD±13.7 kg), and 1.65 cm (SD±0.9 cm) were found, respecively. All anthropometric measurements showed asymmetrical distribuions to the right, as follows: weight, BMI, AC, NC (Kolmogorov-Sminorv with p<.000), and height (Kolmogorov-Sminorv with p<.021).
After analysis of the seven PSQI components, we observed that a higher proporion of university students (95.2%) had poor sleep quality (PSQI>5). Overall, the aver-age PSQI score obtained was 9.4 (SD±2.2 points).
The relaionship between BMI and the PSQI revealed that the proporion of obese people in the sample was higher among good sleepers (6.1%), while overweight people were more frequent among poor sleepers (22%). On the other hand, the proporion of individuals with normal weight was equal in both groups, and the proporion of individuals of a low weight was twice as high among good sleepers (12.1%) (p=.089).
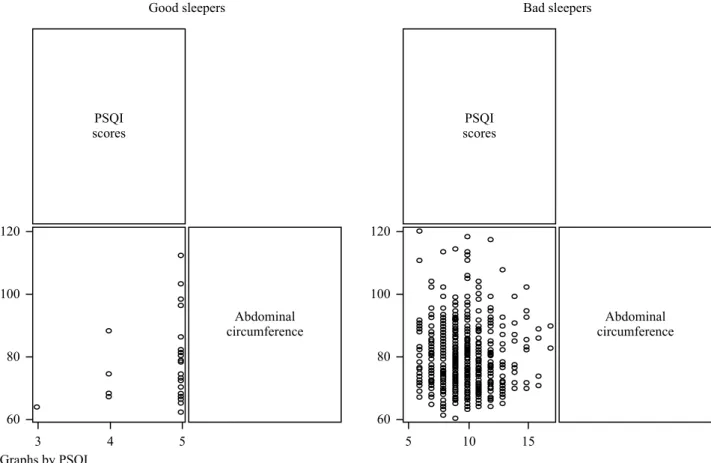
Comparisons were also made between AC and NC and sleep quality using the Mann-Whitney test. Poor sleepers showed higher a NC (33.8 SD±3.5 cm) than students who slept well. However, this difference was not statistically significant (p=.159). There was also no statistically significant association between quality of sleep and AC (p=.421).
Associaions were also assessed between AC and NC and PSQI scores. Figure 1 shows that the relationship between AC and the PSQI among good sleepers was posiive and weak (ρ=.209; p=.241) and negaive and weak (ρ=-.033; p=.382) among bad sleepers.
As with AC, the relaionship between PSQI scores and NC was also posiive and weak among good sleepers, (ρ=.026; p=.885) and negative and weak among poor sleepers (ρ=-.070; p=.070) (Figure 2).
Figure 1 – Correlation between PSQI scores and abdominal circumference - Fortaleza, CE, Brazil, 2011
Good sleepers
PSQI scores
Abdominal circumference 120
100
80
60 3 Graphs by PSQI
4 5
Bad sleepers
PSQI scores
Abdominal circumference 120
100
80
60
DISCUSSION
The current study consisted of a 702-student sample with a mean age of 21.5 years. Similar age ranges have been observed among university samples from other studies(18).
This sample allowed for the assessment of relaionships with individuals who were predominantly unmarried, living with their parents, and full-ime students.
Regarding the classiicaion of students concerning BMI, a prevalence of excess weight (overweight and obese) was observed among males, while women were classiied as un-derweight and at a normal weight. Most of the paricipants were female and belonged to income classes B and C. Thus, the low prevalence of overweight women in this study may be related to past research suggesing that the quest for a lean body is very common among women belonging to more favored social classes(19).
In addiion to measures of weight and height to calculate BMI, students also had their AC and NC anthropometric data values quaniied. The average AC was 79.1 cm. Although dif-ferences between genders were not taken into account, the calculated averages suggest that the students were within normal standards(16). Values not only higher than the ones
ob-served in the current study, but also outside the normal limits for both genders, have been revealed in other studies(10,20).
A study conducted in Rio de Janeiro with 40 university students found that 15% of the students showed increased AC(21). Meanwhile, a study with 605 students from the
Fed-eral University of Piauí detected abdominal obesity in only 2.4% of students(22).
Furthermore, the current sample had an average NC of 33.7, also within a healthy range. Past studies have shown lower(11), similar(17), and higher(8) NC values.
Researchers say that youth is a criical period for the de-velopment of cardiovascular risk factors while recommending intervenions to avoid unfavorable outcomes in adulthood(23).
The detecion of overweight and elevated abdominal and cervical circumferences among university students becomes especially important due to the lifestyle led by this popula-ion. These individuals oten leave the comfort of their homes and start living alone or with colleagues, begin unhealthy food habits, do not eat during correct imes, and work or study at night. This lifestyle leads to eaing in a more pracical way, with canned and fried foods; this facilitates excess weight and increased adiposity and body perimeters(24).
The evaluaion of sleep quality among students was also possible via the PSQI(14). We found that about 95% of the
students were classiied as bad sleepers, as found in other studies using the PSQI(11), as well as when other
classiica-ions are employed(8).
Figure 2 – Correlation between PSQI scores and neck circumference measurement - Fortaleza, CE, Brazil, 2011
Good sleepers
PSQI scores
40
3 Graphs by PSQI
4 5
35
30
Bad sleepers
PSQI scores
Neck circumference
measurement Neck
circumference measurement
45
40
35
30
1. Ban DJ, Lee TJ. Sleep duraion, subjecive sleep disturbances and associated factors among university students in Korea. J Korean Med Sci. 2001;16(4):475-80.
2. Araújo CLO, Ceolim MF. Sleep quality of elders living in long-term care insituions. Rev Esc Enferm USP [Internet]. 2010 [cited 2012 May 15];44(3):619-26. Available from: htp:// www.scielo.br/pdf/reeusp/v44n3/en_10.pdf
3. Rocha MCP, De Marino MMF. Stress and sleep quality of nurses working diferent hospital shits. Rev Esc Enferm USP [Internet]. 2010 [cited 2012 May 15];44(2):280-6. Available from: htp://www.scielo.br/pdf/reeusp/v44n2/en_06.pdf
4. Cardoso HC, Bueno FCC, Mata JC, Alves APR, Jochims I, Vaz Filho IHR, et al. Avaliação da qualidade do sono de estudantes de medicina. Rev Bras Educ Med. 2009;33(3):349-55.
5. Kang JH, Chen SC. Effects of an irregular bedtime Schedule on sleep quality, daytime sleepiness, and fatigue among university students in Taiwan. BMC Public Health. 2009;9:248.
6. Hamer M, Baty GD, Kivimaki M. Sleep loss due to worry and future risk of cardiovascular disease and all-cause mortality: the Scoish Health Survey. Eur J Prev Cardiol. 2012;19(6):1437-43.
7. Spiegel K, Knutson K, Leproult, Tasali E, Cauter EV. Sleep loss: a novel risk factor for insulin resistance and Type 2 diabetes. J Appl Physiol. 2005;99(5):2008-19.
8. Chan ET, Shiao GM. Craniofacial abnormaliies in Chinese paients with obstrucive and posiional sleep apnea. Sleep Med. 2008;9(4):403-10.
REFERENCES
No staisically signiicant associaion between gender and sleep quality among students was found in this study, similar to that of most previous studies (1,4-5).
The neurobiological processes that occur during sleep are necessary for the maintenance of physical and cogni-ive acivity. Disorders associated with poor sleep quality can impair performance in school, work, and with family and social relaionships. Sleep disorders are also associated with an increased risk of accidents(25). Therefore, university
students who lack adequate sleep quanity and quality may see learning and academic performance afected as a result. This can predispose this populaion to cogniive and psychosomaic problems(12).
When assessing associaions between anthropometric data and sleep quality among university students, it was apparent that poor sleepers showed higher BMI, AC, and NC values as compared to good sleepers. Nevertheless, when relaing AC and NC measurements with PSQI scores, all relaionships were negaive among individuals classiied as bad sleepers. This leads to the conclusion that, as PSQI scores increase (i.e., when there is a worsening in quality of sleep) anthropometric measurement values tend to decrease, with no associaion or staisically signiicant correlaion with PSQI scores.
Despite this, in a consulted systematic review, there was a consensus that the duration and quality of sleep were independently related to human cardiometabolic risk. This occurs through the development of problems such as obesity, DM 2, hypertension, dyslipidemia, is-sues associated with Metabolic Syndrome, and vascular failure markers(26).
In addiion to the damage caused by sleep disorders alone, addiional risks exist due to the associaion between
these disorders and poor sleep quality with obesity, central obesity, and other anthropometric data.
A review of the literature on the relaionship between sleep and obesity presented at least eight studies that correlate short duraion of sleep ime with increased BMI within diferent populaions(27). Elevated BMI and AC values
associated with poor quality of sleep have been found elsewhere(8-9). Although less signiicant, associaions have
also been found between elevated NC and the presence of disorders related to sleep, which can contribute to poor quality(11,17).
CONCLUSION
This study invesigated the correlaion between an-thropometric indicators and sleep quality among Brazilian university students using the PSQI-BR. Most paricipants were classiied as bad sleepers. The relaionship between BMI and the PSQI showed that overweight individuals were more frequent among bad sleepers, who also showed NCs larger than those of students who slept well; however, this relaionship was not staisically signiicant. Results were similar when assessing relaionships with AC.
Although no staisically signiicant diferences were detected between the anthropometric measurements and the PSQI, healthcare professionals are advised to pay special atenion to university students during early clinical stages, considering the high chance of therapeuic success and decreased prevalence of several cardiometabolic problems in the future.
9. Barcelo X, Mirapeix RM, Bugés J, Cobos A, Domingo C. Oropharyngeal examinaion to predict sleep apnea severity. Arch Otolaryngol Head Neck Surg. 2011;137(10):990-6.
10. Preis SR, Massaro JM, Hofmann U, D’Agosinho RB, Levy D, Robins SJ, et al. Neck circumference as a novel measure of cardiometabolic risk: the Framingham Heart Study. Fox J Clin Endocrinol Metab. 2010;95(8):3701-10.
11. Medeiros CAM, Bruin VMS, Silva CC, Araújo SMHA, Chaves
Junior CM, Bruin PFC.Neck circumference, a bedside clinical
feature related to mortality of acute ischemic stroke.Rev
Assoc Med Bras. 2011;57(5):559-64.
12. Pereira EG, Gordia AP, Quadros TMB. Padrão do sono em universitários brasileiros e sua relação com a prática de aividades ísicas: uma revisão da literatura. Rev Bras Ciênc Saúde. 2011;9(30):55-60.
13. Associação Brasileira de Empresas de Pesquisas (ABEP). Critério de classiicação econômica Brasil [Internet]. São Paulo; 2008 [citado 2012 jun. 28]. Disponível em: htp://www.abep. org/novo/Content.aspx?ContentID=139
14. Bertolazi NA, Fagondes SC, Hoff LS, Dartora EG, Miozzo IC, Barba ME, et al. Validaion of the Brazilian Portuguese version of the Pitsburgh Sleep Quality Index. Sleep Med. 2011;12(1):70-5.
15. World Health Organizaion (WHO). Obesity: prevening and managing the global epidemic. Report of a WHO Consultaion. Geneva; 2004. (Technical Report Series nº 894).
16. Smith C, Essop MF. Gender diferences in metabolic risk factor prevalence in a South African student populaion. Cardiovasc J Afr. 2009;20(3):178-82.
17. Yang GR, Yuan SY, Fu HJ, Wan G, Zhu LX, Bu XL, et al. Neck circumference positively related with central obesity, overweight, and metabolic syndrome in Chinese subjects with type 2 diabetes: Beijing Community Diabetes Study 4. Diabetes Care. 2010;33(11):2465-7.
18. Petribú MMV, Cabral PC, Arruda IKG. Estado nutricional, consumo alimentar e risco cardiovascular: um estudo em universitários. Rev Nutr. 2009;22(6):837-46.
19. Magalhães VC, Mendonça GAS. Prevalência e fatores associados a sobrepeso e obesidade em adolescentes de 15 a 19 anos das regiões Nordeste e Sudeste do Brasil, 1996 a 1997. Cad Saúde Pública. 2003;19 Supl.1:S129-39.
20. Davidson TM, Patel MR. Waist circumference and sleep disordered breathing Laryngoscope. 2008;118(2):339-47.
21. Vilarinho RMF, Lisboa MTL, Thiré PK, França PV. Prevalência de fatores de risco de natureza modiicável para a ocorrência de diabetes mellitus tipo 2. Esc Anna Nery Rev Enferm. 2008;12(3):452-56.
22. Marins MCC, Ricart IF, Rocha CHL, Maia RB, Silva VBS, Veras AB, et al. Pressão arterial, excesso de peso e nível de aividade ísica em estudantes de universidade pública. Arq Bras Cardiol.
2010;95(2):192-9.
23. Wang Y, Monteiro C, Popkin BM. Trends of obesity and underweight in older children and adolescents in the United States, Brazil, China and Russia. Am J Clin Nutr. 2002;75(6):971-7. 24. Matsudo SM, Matsudo VR, Araújo T, Andrade D, Oliveira L.
Nível de aividade ísica da população do Estado de São Paulo: análise de acordo com o gênero, idade, nível socioeconômico, distribuição geográica e de conhecimento. Rev Bras Ciênc Mov. 2002;4(10):41-50.
25. Antonelli IR, Marra C, Salvigni BL, Petrone A, Gemma A, Selvaggio D, et al. Does cogniive disfuncion conform to a disincive pattern in obstructive sleep apnea syndrome? J Sleep Res. 2004;13(1):79-86.
26. Cappuccio FP, Cooper D, D’Elia L, Strazzullo P, Miller MA. Sleep duration predicts cardiovascular outcomes: a systematic review and meta-analysis of prospecive studies. Eur Heart J. 2011;32(12):1484-92.
27. Crispim CA, Zalcman I, Dáilo M, Padilha HG, Tuik S, Mello MT. Relação entre sono e obesidade: uma revisão da literatura. Arq Bras Endocrinol Metab. 2007;51(7):1041-9.
Acknowledgment