Original Article 79
-PREVALENCE OF COMPLIANCE WITH HEALTHY EATING IN OLDER
ADULTS FROM THE RURAL ZONE
Sara Franco Diniz Heitor1, Leiner Resende Rodrigues2, Darlene Mara dos Santos Tavares3
1 Master in Health Care. Nutritionist. Substitute Professor of the Department of Nutrition at Universidade Federal do Triângulo
Mineiro (UFTM). Minas Gerais, Brazil. E-mail: [email protected]
2 Ph.D. in Nursing. Adjunct Professor 2 of the Nursing Undergraduate Course at UFTM. Minas Gerais, Brazil. E-mail: leinerrr@
bol.com.br
3 Ph.D. in Nursing. Associate Professor of the Department of Nursing at UFTM. Minas Gerais, Brazil. E-mail: darlenetavares@
enfermagem.uftm.edu.br
ABSTRACT: Eating preferences play a relevant role throughout life, and they may inluence disease based on inappropriate choices. This study aimed at determining the prevalence of compliance with the guide 10 steps to healthy eating in older adults, in addition to characterizing the sociodemographic, economic and anthropometric proile of 850 older adults from the rural zone of Uberaba-MG. The study consists of a home survey with cross-sectional and observational components. The prevalence of following the steps was determined through a questionnaire of eating frequencies. Data analysis consisted of the distribution of simple frequencies. Most participants were men, up to 70 years of age, married and living with their spouse, with a low level of education, an income of one minimum wage and well-nourished. None of the subjects followed all ten steps outlined in the guide. Step 8, which refers to the ingestion of salt, showed the greatest compliance. On the other hand, step 5, referring to the ingestion of lean meat and milk, presented the lowest compliance. Knowing the population and their habits is important for the implementation of strategies to improve quality of life.
DESCRIPTORS: Elderly. Nutrition assessment. Food habits. Rural population. Aging.
PREVALÊNCIA DA ADEQUAÇÃO À ALIMENTAÇÃO SAUDÁVEL DE
IDOSOS RESIDENTES EM ZONA RURAL
RESUMO: Preferências alimentares desempenham papel relevante ao longo da vida. Se pautadas em escolhas inadequadas, podem desencadear doenças. Este estudo objetivou determinar a prevalência da adequação ao Guia “10 passos para uma alimentação saudável para a pessoa idosa”, além de caracterizar o peril sociodemográico, econômico e antropométrico de 850 idosos da zona rural de Uberaba-MG. Inquérito domiciliar, transversal e observacional. A prevalência dos passos foi coletada com questionário de frequência e consumo alimentar. A análise dos dados consistiu de distribuição de frequência simples. A maioria era do sexo masculino, até 70 anos, casada, morava com o cônjuge, baixa escolaridade, renda de um salário mínimo e eutróicos. Nenhum idoso seguia todos os passos. O passo 8, ingestão de sal, mostrou o maior seguimento. O passo 5, consumo de carnes magras e leite, apresentou o menor. Conhecer a população e seus hábitos é importante na implementação de estratégias que melhorem a qualidade de vida.
DESCRITORES: Idoso. Avaliação nutricional. Hábitos alimentares. População rural. Envelhecimento.
PREVALENCIA DE LA ADECUACIóN A LA ALIMENTACIóN
SALUDABLE DE ANCIANOS RESIDENTES EN ZONA RURAL
RESUMEN: Preferencias alimentarias desempeñan papel relevante a lo largo de la vida. Caso sean basadas en elecciones inadecuadas pueden desencadenar enfermedades. Este estudio ha objetivado determinar la prevalencia de la adecuación a la Guía “10 pasos para una alimentación saludable para la persona anciana”, además de caracterizar el peril sociodemograico económico y antropométrico de 850 ancianos de la zona rural de Uberaba-MG. Inquérito domiciliar, transversal y observacional. La prevalencia de los pasos ha sido colectada con cuestionario de frecuencia y consumo alimentario. El análisis de datos consistió en la distribución de frecuencia simple. La mayoría era del sexo masculino, hasta 70 años, casada, vivía con el cónyuge, baja escolaridad, renta de un sueldo mínimo y eutróicos. Ningún anciano seguía todos los pasos. Paso 8, ingestión de sal, se ha mostrado el más grande seguimiento. Paso 5, consumo de carnes delgadas y leche, presentó el menor. Conocer la población y sus hábitos es importante en la implementación de estratégias que mejoren la calidad de vida.
INTRODUCTION
The growth of the elderly population is a phenomenon observed on all continents, and which is occurring at an unprecedented level.1 In parallel, the prevalence of Chronic Degenerative Diseases (CDD) is increasing. These diseases af-fect approximately 9.3% of the individuals aged between zero and 14 years of age, whereas in older adults this rate reaches 75.5%.2 Moreover, when this geriatric population resides in a rural area, several barriers, including long distances to health services, transportation difficulties, low income and reduced level of education, may aggravate health conditions. These factors may contribute to the greater vulnerability of older adults in these areas.3
Among the main causes for these diseases are inappropriate eating habits. The eating his-tory of each individual has a close relationship to their health-disease proile.4 Therefore, nutri-tion, as an integrating part of institutional and individual health practices, has an important role throughout life.
It is important to highlight that in the rural areas there is a higher concentration of families with low incomes.3 Thus, these individuals often consume reined foods, which have a lower cost and are easier to prepare, with a high number of calories resulting from a high glycemic index, carbohydrates and fats. Nutrients are mainly of animal origin rather than from other low energy density types of foods like fruits and vegetables. These constitute some of the most important fac-tors in explaining the increase of CDD and high morbimortality.5 These diseases, inversely, affect the individual’s nutritional state, either due to the need for certain dietary restrictions, altered absorption and excretion of nutrients, or drug-nutrients interactions, since there is often a need for medication.4
Therefore, the increased aging of the popula-tion makes it necessary to plan and develop health interventions that may contribute to the improve-ment in the quality of life of the elderly, such as measures related to healthy eating, promoting more pleasure, comfort and safety.
In Brazil, the Ministry of Health elaborated 10 steps to healthy eating in older adults.6 This action is part of a policy that aims at assuring integral care to the geriatric population.7
Hence, the present study aims at deter-mining, in the rural zone of Uberaba-MG, the
prevalence of compliance with the guide 10 steps to healthy eating in older adults,in addition to char-acterizing these subjects in terms of sociodemo-graphic, economic and anthropometric variables.
METHODS
This cross-sectional, observational home survey is part of a greater study, which was de-veloped in the rural zone of the municipality of Uberaba-MG in the period between June 2010 and March 2011. The rural space of this municipality is divided into three sanitary districts. Four teams from the Family Health Strategy (FHS) cover 100% of the area. The population of this rural zone was obtained in June 2010 through the number of older adults registered in the FHS, totaling 1,297 subjects.
The inclusion criteria adopted in the present study were: being 60 years or older, living in the rural zone of the municipality of Uberaba-MG and not presenting cognitive deterioration. The established criteria were met by 850 older adults. On the other hand, 447 older adults were excluded due to: address change (117), presenting cognitive deterioration (105), refusal to participate (75), not being found at home after three visits (57), death (11), hospitalization (3) and other reasons (79).
Data were collected in the home of the older adults by trained interviewers. Community Health Agents (CHA) contributed in inding the location of the houses and this activity was authorized by the City Health Department.
A cognitive evaluation of the older adults was performed before the interview in order to verify their ability to answer the questionnaire. A version of the Mini-Mental State Examination (MMSE) that has been translated and validated in Brazil was applied. The MMSE score varies between 0 and 30 points, with cut-off points con-sidered as ≤ 13 for older adults with no education, ≤ 18 points for 1 to 11 years of education and ≤ 26 for those with more than 11 years of education.8
other of their generation, with children, with grandchildren, other arrangements); education in study years (no education, 1├4, 4├8, eight, nine or more years); and individual income in minimum wages (no income, < 1, 1, 1┤3, 3┤5, > 5).
Anthropometric data were measured in all older adults, wearing light clothing and no shoes. Weight (kg) was measured using a por-table digital anthropometric platform scale, (Bal brand). Height (m) was measured using a lexible inelastic measuring tape, which was ixed on a lat and regular wall without skirting, having the barefoot older adult placed in the orthostatic position with their feet together, back to the marker and looking at the horizon. Body mass index (BMI) was calculated using the formula kg/m2. The classiication of the nutritional state was performed through the BMI, using the cut-off points for older adults proposed by the Nutrition Screening Initiative:10 underweight (BMI≤22 kg/ m2), eutrophy (BMI between 22 and 27 kg/m2) and overweight (BMI>27 kg/m2).
Eating was evaluated through the adapted food frequency questionnaire (FFQ), built by the technical team of the General Coordination of Nutrition Policy (GCNP) of the Healthcare Depart-ment of the Ministry of Health.11 This instrument was previously tested with a group of the Brazilian adult population, but is applicable to the elderly since the eating recommendations are similar for all individuals over two years old, according to the Eating Guide of the Brazilian Population.12
Food quantities were reported by the older adults according to their usual form of inges-tion (units, pieces, slices, spoons and cups). The conversion to the number of portions was made according to the Adapted Brazilian Food Pyra-mid.13 After the application of the questionnaire, the eating habits of the older adults were evalu-ated using as reference the eating Guide 10 steps to healthy eating in older adults proposed by the Brazilian Ministry of Health. The irst nine steps are related speciically to food ingestion, and the tenth is related to the attitude towards a healthier lifestyle,6 as described below:
1. Have at least three meals and two snacks a day, and do not skip meals; 2. Include six daily portions of cereal (rice, corn, wheat, tuber – potato, roots, manioc, cassava – or pasta) with meals, pref-erably whole grains and natural foods; 3. Eat at least three portions of vegetables and three or more portions of fruit; 4. Eat rice and beans everyday or at least ive times a week; 5. Have three portions of
milk and dairy products and one portion of meat daily (beef, poultry, ish or eggs) and remove the visible fat from the meat and skin from the poultry in their preparation; 6. Have one daily portion, at the most, of vegetable oil, olive oil, butter or margarine; 7. Avoid soda and industrialized juice, cakes, cookies, desserts and sweets. Eat those, at most, twice a week; 8. Reduce the quantity of salt in food and remove the saltshaker from the table; 9. Drink at least two liters of water a day (six to eight glasses) and drink it in the intervals between meals; 10. Live a healthier life-practice at least 30 minutes of physical activity every day and avoid alcoholic drinks and smoking.
Data regarding the irst nine steps referring to eating, ingestion of alcoholic drinks and physi-cal exercise, categories that are part of the 10th step, were collected through the FFQ adapted by the GCNP. The category regarding the act of smoking, which is also part of the 10th step, was measured by asking the question: “Are you a smoker?”.
com-pliance with step 9. Comcom-pliance with step 10 was considered positive when the older adult reported practicing at least 30 minutes of physical activity every day, in addition to abstaining from smoking and consuming alcoholic drinks every day. Based on these values, dietetic ingestion was categorized as being in compliance or not.
An electronic database was built using the Excel® program. Data from the interviews, after being reviewed and coded, were processed in a microcomputer by two people, with double input. At the end of data entry, the consistency between the two databases was veriied. In cases of incon-sistent data, the original interview was veriied and the correction was made. The authors then proceeded to statistical analysis through the
dis-tribution of absolute and percentage frequencies and prevalence rates.
This project was approved by the Human Research Ethics Committee of the Universidade Federal do Triângulo Mineiro, protocol n. 1477. The study purposes and pertinent information were presented to the older adults. The interview proceeded after the signature of the Free and Clariied Consent Form or the agreement to par-ticipate through the collection of the ingerprint of illiterate subjects.
RESULTS
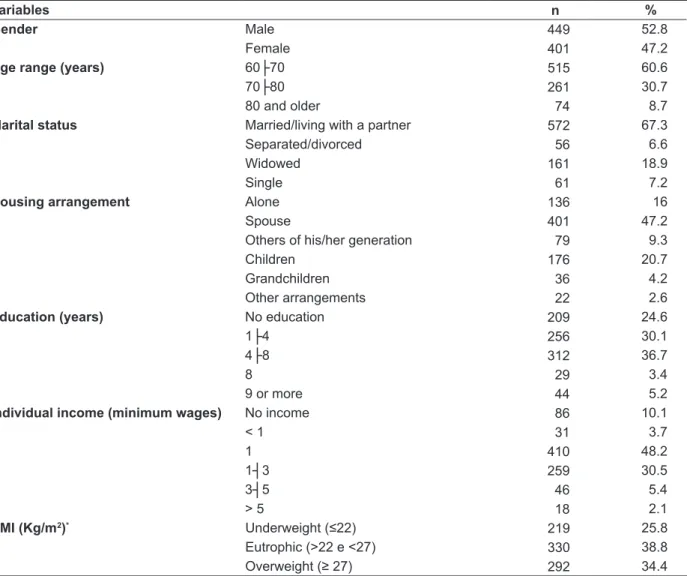
Table 1 describes the characteristics of the population, according to sociodemographic, eco-nomic and anthropometric variables.
Table 1 – Frequency of sociodemographic, economic and anthropometric variables of older adults living in the rural zone. Uberaba-MG, 2012 (n=850)
Variables n %
Gender Male 449 52.8
Female 401 47.2
Age range (years) 60├70 515 60.6
70├80 261 30.7
80 and older 74 8.7
Marital status Married/living with a partner 572 67.3
Separated/divorced 56 6.6
Widowed 161 18.9
Single 61 7.2
Housing arrangement Alone 136 16
Spouse 401 47.2
Others of his/her generation 79 9.3
Children 176 20.7
Grandchildren 36 4.2
Other arrangements 22 2.6
Education (years) No education 209 24.6
1├4 256 30.1
4├8 312 36.7
8 29 3.4
9 or more 44 5.2
Individual income (minimum wages) No income 86 10.1
< 1 31 3.7
1 410 48.2
1┤3 259 30.5
3┤5 46 5.4
> 5 18 2.1
BMI (Kg/m2)* Underweight (≤22) 219 25.8
Eutrophic (>22 e <27) 330 38.8
Overweight (≥ 27) 292 34.4
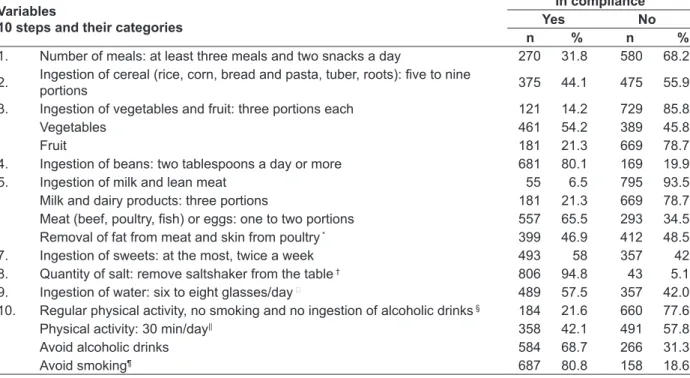
The prevalence of compliance with the 10 steps to healthy eating in older adults and its subdivision into categories are presented in table 2. Step 8 presented the greatest compliance, as approximately 95% of the subjects stated they do not add extra salt to their food once it has been prepared. The ingestion of milk and lean meat was the step with the lowest compliance (6.5%). Once the steps that had more than one category
were subdivided and analyzed separately, those with lower compliance were found to be equal (21.3%) regarding the low ingestion of fruit and milk and dairy products. On the other hand, the category with the greatest compliance was step 10, which refers to not smoking. It was evidenced that the ingestion of beans at least ive times a week (step 4) was followed by a signiicant part of the population (80.1%).
Table 2 - Prevalence of the 10 steps to healthy eating in older adults and their subdivision into categories, in the geriatric population of a rural zone. Uberaba-MG, 2012
Variables
10 steps and their categories
In compliance Yes No
n % n %
1. Number of meals: at least three meals and two snacks a day 270 31.8 580 68.2 2. Ingestion of cereal (rice, corn, bread and pasta, tuber, roots): ive to nine portions 375 44.1 475 55.9 3. Ingestion of vegetables and fruit: three portions each 121 14.2 729 85.8
Vegetables 461 54.2 389 45.8
Fruit 181 21.3 669 78.7
4. Ingestion of beans: two tablespoons a day or more 681 80.1 169 19.9
5. Ingestion of milk and lean meat 55 6.5 795 93.5
Milk and dairy products: three portions 181 21.3 669 78.7
Meat (beef, poultry, ish) or eggs: one to two portions 557 65.5 293 34.5
Removal of fat from meat and skin from poultry * 399 46.9 412 48.5
7. Ingestion of sweets: at the most, twice a week 493 58 357 42
8. Quantity of salt: remove saltshaker from the table † 806 94.8 43 5.1
9. Ingestion of water: six to eight glasses/day 489 57.5 357 42.0
10. Regular physical activity, no smoking and no ingestion of alcoholic drinks § 184 21.6 660 77.6
Physical activity: 30 min/day|| 358 42.1 491 57.8
Avoid alcoholic drinks 584 68.7 266 31.3
Avoid smoking¶ 687 80.8 158 18.6
Note: step 6 was not measured, as described in the methodology. *4.6% of the older adults do not eat meat, therefore they did not
answer this question; †0.1% of the older adults could not answer; ¶0.5% of the older adults could not answer; §0.7% of the older adults
could not answer; ||0.1% of the older adults could not answer; ¶0.6% of the older adults could not answer.
DISCUSSION
When considering the sociodemographic, eco-nomic and anthropometric proile, it is believed that the male concentration in the rural environment, contrary to another study with older adults in the countryside in which female subjects prevailed14, is due to the fact that men, despite being older, still work as rural workers even after retiring.15
Moreover, women move to the cities to seek lighter activities or to be closer to their children and/or grandchildren, who often live in urban areas.3
Regarding age range, there was a prevalence observed of younger older adults, which agrees with a study in the rural zone of Rio Grande do Sul (RS).14 The oldest older adults migrate to the urban environment to seek the company of children and/
or relatives, better life conditions, public services and access to health services.15
As for marital status, most of the subjects were married, agreeing with a study developed in a geriatric rural community in RS.14 Having a partner is healthy, since psychosocial factors, such as the loss of a spouse and social isolation, may lead to qualitative and quantitative changes in food ingestion through loss of appetite, refusal to eat or lack of motivation to prepare food16, thus reducing the consumption of energy and, conse-quently, nutrients. In this sense, all possible means to improve the appetite of older adults must be considered in order to encourage food ingestion.
spouse, higher values than the data from urban and rural Brazil stand out.17 Not living alone and sitting at the table in the company of other people promotes social integration and positively inlu-ences food acceptance.16
In terms of education, other surveys found similar results,17 with a prevalence of 4├8 years of education. In RS, most of the older adults living in the rural zone reported they studied for up to three years.14 Based on the prevalence of low education in the rural environment, there is an assumption that the parents of these older adults did not value school as the center of their children’s life. Men were raised to work in the ield,14 whereas women were raised to perform household duties.18 Considering the education of this population may contribute to new strategies to be used in the ap-proach to nutritional education.
Regarding individual monthly income, this study agrees with another study of the geriatric population living in a rural zone.3 In this area, retirement means a positive impact, an extra in-come. A study developed in Minas Gerais (MG) observed that rural retirement was important in improving conditions of life and independence of the older adult.19 These data lead to the need for attention, since a reduced income may limit the access of the subjects to proper nutrition and social care, signiicantly compromising the quality of life of these people.18
Although eutrophy had the highest frequen-cy among older adults in this study, being over-weight was also remarkable. This fact is in agree-ment with a study developed with the Brazilian population, including the elderly, which observed that in the period of two decades weight excess doubled within the rural geriatric population in the most developed region of Brazil (Southeast), and tripled among older adults in the poorest Brazilian rural zone (Northeast). Parallel to this, underweight and eutrophy was reduced but was still signiicant,20 demonstrating the nutritional transition that has been taking place in the country. In face of the exposed scenario, it is observed that in Brazil there is a prevalence of over- and un-derweight, especially in less developed areas, both rural and urban.20 Considering the adverse effects that this anthropometric proile may cause in the older population, activities must be developed in order to promote improvement in the quality of life of these subjects.
Regarding the compliance with healthy eating, the ingestion of at least three daily meals
and two snacks (step 1) was higher than that ob-served in a study with adults from the rural zone of Espírito Santo (31.8% vs. 6%),21 and lower than a study developed with older adults in Sweden.22 This study showed that splitting meals is inversely proportional to insulin resistance (IR) and meta-bolic syndrome (MS), despite the traditional risk factors and diet composition.22 The metabolic syndrome is multifactorial and is inluenced by genetic and environmental factors, which are related, among others, to the frequency of meals. The lipid proile improves with the increase in the number of meals, whereas waist circumference, BMI and triglycerides decrease.22
Regarding step 2, which is followed by less than half the subjects, it is important to highlight that complex carbohydrates (starch) in the form of tubers (such as potato), roots (such as manioc), and grains such as rice, corn, and wheat from bread and pasta are the main sources of energy and the main component of most meals.12 The insuficient inges-tion of this food group may induce underweight or lead to a diet containing a greater quantity of fat, thus predisposing the subjects to metabolic diseases.23 On the other hand, excessive ingestion may generate fat accumulation in the abdomi-nal region, which is potentially atherogenic, by stimulating glycogenesis and reducing muscular collection of glucose, resulting in hyperglycemia, hyperinsulinemia and hyperlipidemia,24 compro-mising quality of life and predisposing to CDDs.
As for step 3 (ingestion of three portions of vegetables and three portions of fruit a day), the results of the present study were considered signiicantly low, given the scientiic evidences of protection against several CDDs granted by this food group.25 It is believed that the interviewees have easy access to these types of food. During data collection, it was observed that several rural properties grow vegetables and fruit, with a wide variety of fruit and vegetables. The explanation for low ingestion may be due to different fac-tors, for instance: available crops and in between crops characteristic of this food group, as well as the growing of these foods being more directed at commercialization rather than consumption.21
85 -of fruit and vegetables (< 400g/day) is responsible
for 31% of ischemic heart diseases, 11% of cerebro-vascular diseases, 19% of gastrointestinal cancers and 2.7 million deaths around the world yearly. Considering, thus, that the beneits of ingesting this food group for one’s health are irrefutable, professionals must instruct the geriatric popula-tion regarding the importance of quantity and variety in the ingestion of fruit and vegetables, and encourage different forms of preparation to elevate their lavors. Valuing regional and sea-sonal foods is a way of encouraging consumption. Combining vegetables, in order to compose a col-orful plate, will guarantee adequate consumption of several nutrients.
Regarding the ingestion of beans (step 4), compliance was observed in a signiicant por-tion of the older adults, which is a superior result to that found in RS.27 The present study did not conirm that the Brazilian habit of eating beans has decreased.12-13 This legume contains complex carbohydrates and is rich in vitamins, minerals, bioactive compounds and fiber, presenting a lower glycemic index. When ingested with rice, it becomes a complete source of proteins, thus its ingestion must be encouraged.12 It is believed that in the rural environment, the population maintains this deep-rooted and traditional Brazilian eating habit, the typical combination of rice and beans.
As for step 5, which involves the ingestion of milk and/or dairy products and lean meat, compliance was signiicantly low (6.5%). This re-sult contained three categories analyzed together. When the analyses were calculated separately, it was shown that consumption of milk and/or dairy products (three portions/day) had the lowest com-pliance. The category of meats or eggs (one or two portions/day) had 65.5% compliance, and almost half the older adults removed fat from the meat and skin from poultry at the time of preparation. It is important to highlight that calcium, which is present in milk, is the nutrient most commonly associated with bone remodeling, formation and metabolism. Its inappropriate ingestion may lead to bone density loss, which in older adults predis-poses to higher risk of fractures.28
In the analysis of the ingestion of lean meat or eggs, it is important to highlight that these types of food contain proteins of high biological value, including saturated fatty acids, B-complex vitamins (especially B6 and B12), high bioavail-ability iron, selenium and potassium,13 and that their deiciency represents a crucial factor in the
inhibition of the immune system.12 A study devel-oped in Santa Catarina (SC) demonstrated that the daily ingestion of meat, ish or eggs was inversely proportional to the risk of malnutrition in older adults.29 Considering the third category of step 5, removing fat from meat and skin from poultry, almost half the subjects did not show compliance, which is a higher value than that found in a Vigitel study among adults-older adults.25 According to the WHO,26 dyslipidemia, ischemic heart disease and cerebrovascular diseases are primarily caused by the excessive ingestion of saturated fat of ani-mal origin.
Step 6, regarding the maximum ingestion of one daily portion of vegetable oils, olive oils, butter or margarine was not calculated in this study, as described in the methodology.
The ingestion of sweets, less than twice a week (step 7), was not followed by almost half of the older adults, in agreement with the results of the study in RS.27 A diet rich in high glycemic index carbohydrates, such as sweets in general, soda and others, reaches the bloodstream rapidly, increas-ing the concentration of glucose in the blood, and may predispose to hyperglycemia or diabetes mellitus (DM) in the long-term. Furthermore, through the stimulus of a greater production of very low density lipoprotein (VLDL), the risk of cardiovascular diseases increases.30 The ingestion of this food group must be reduced by at least a third in the average population.12
Not adding salt to already-prepared food stands out as the step with greatest compliance (step 8), which agrees with another study with adults-older adults.27 Not using additional salt (sodium) reduces blood pressure and is associ-ated with a lower incidence of stroke and heart disease.31 The high compliance with step 8 may be due to the fact that older adults are concerned mainly, and perhaps only, with the ingestion of salt to prevent and treat arterial hypertension. It is suggested that this result is the effect of the teaching provided by health professionals in basic health units.
ucts.12 Good hydration maintains vascular volume, regulates temperature and removes residues from the body.31 Moreover, it improves the weight and consistency of feces, increases the number of gas-trocolic relexes and contributes to the lubrication of the intestine.12 The need for liquids in healthy older adults is inluenced by the level of physi-cal activity, ambient temperature and the use of medications. Apart from this, homeostatic mecha-nisms, such as the loss of the thirst sensation, can be compromised, especially in the oldest older adults, and may result in dehydration.31
Step 10 contained the analysis of three cat-egories together. Among them, avoiding alcoholic drinks and smoking obtained the best compli-ance among the subjects. However, the absence of physical activity was the category that most inluenced the noncompliance to this step.
In the United States, a third of older adults report regular ingestion of alcoholic drinks,31 which is a similar result to this study. In the pres-ence of alcohol, B-complex vitamins and ascorbic acid (vitamin C) are drained from the body. Con-comitantly, appetite is affected negatively in these dependent subjects, altering their nutritional state. This effect, if associated with inadequate eating, may lead to malnutrition.12 In the oldest older adults, alcohol may affect mental, neurological and emotional functions, inducing forgetfulness and increasing the risk of dementia and depression. Alcohol ingestion, even within acceptable limits, has been associated with dificulties in performing instrumental activities of daily living.31
Regarding the smoking category, a study developed with older adults in the rural zone of RS also found few smokers.3 Smoking is the greatest isolated risk factor for severe and lethal illnesses, such as chronic obstructive pulmonary disease, stroke and neoplasms. Over 12% of all death causes around the world result from cancer, with approximately 10 million new cases and seven million deaths per year. According to estimates from the WHO, around 40% of all cancers could be prevented through preventive measures such as abstaining from tobacco, regular physical activity and a healthy diet.32 Moreover, smoking, among other factors, decreases the olfactory perception of older adults. This decrease may contribute to the inadequate ingestion of food, leading to poor nutrition and weight loss.33
In the present study, despite sedentarism being more frequent, a higher percentage of older adults who practice at least 30 minutes of physical
activity a day was observed when compared to a study in the urban area of RS (42.1% vs. 1.1%).27 It is important to highlight that in the rural zone, older adults are more active due to the nature of their work. They are commonly involved in some type of farming activity such as manual cow milk-ing, growing vegetables and fruit and taking care of breeding and domestic animals. Women com-monly take part in farming activities, in addition to handling the housework15,which is a favorable
aspect to the quality of life of this population. Concerning physical activity, it is funda-mental to growing old in good physical condi-tion. Older adults aged 65 years or more have substantial beneits for their health if they engage in some form of physical activity. When practiced with regularity, it is one of the main components in the prevention or delay of CDD and osteopo-rosis. Therefore, being active produces favorable effects that reduce the risks of coronary events and death.31
CONCLUSION
The present study has achieved its pur-poses, contributing to the characterization and knowledge regarding eating habits of older adults residing in the rural zone of Brazil, since few studies have been developed in this scenario. Regarding the compliance with the eating Guide 10 steps to healthy eating in older adults, step 8 obtained the greatest compliance, and step 5 the least. Steps 1, 2, 3 and 10 were not followed prop-erly by a large portion of the geriatric population. Steps 7 and 9 were followed by a little more than half the subjects, whereas step 4 showed signii-cant compliance.
REFERENCES
1. Instituto Brasileiro de Geografia e Estatística.
Indicadores sociodemográicos e de saúde no Brasil.
Rio de Janeiro (RJ): Ministério do Planejamento; Orçamento e Gestão, 2009.
2. Veras R, Parahyba Ml. O anacronismo dos modelos
assistenciais para os idosos na área da saúde: desaios para o setor privado. Cad Saúde Pública.
2007 Out; 23(10):2479-89.
3. Morais EPM, Rodrigues RAPR, Gerhardt TE. Os idosos mais velhos no meio rural: realidade de vida
e saúde de uma população do interior gaúcho. Texto
Contexto Enferm. 2008 Abr-Jun; 17(2):374-83. 4. Amado TCF, Arruda IKG, Ferreira RAR. Aspectos
alimentares, nutricionais e de saúde de idosas atendidas no Núcleo de Atenção ao Idoso - NAI, Recife/2005. Arch Latinoam Nutr. 2007 Out; 57(4):366-71.
5. Jaime PC, Monteiro, CA. Fruit and vegetable intake by Brazilian adults, 2003. Cad Saúde Pública. 2005
Set; 21(1): 9-24.
6. Ministério da Saúde (BR). Secretaria de Atenção
à Saúde. Coordenação Geral da Política de
Alimentação e Nutrição. Alimentação saudável
para pessoas com mais de 60 anos:siga os dez
passos. Brasília (DF): 2007. [acesso 2011 Ago 13].
Disponível em: http://189.28.128.100/nutricao/ docs/geral/10passosIdosos.pdf
7. Ministério da Saúde. Secretaria de Atenção à Saúde. Departamento de Atenção Básica. Coordenação Geral
da Política de Alimentação e Nutrição. Relatório de
Gestão – 2009.Brasília (DF):MS;2010. [acesso 2011
Ago 03]. Disponível em: http://189.28.128.100/ nutricao/docs/geral/relatorio_2009_cgpan.pdf
8. Bertolucci PHF, Brucki SMD, Campacci SR, Juliano Y. O mini-exame do estado mental em uma população geral: impacto da escolaridade. Arq
Neuropsiquiatria. 1994 Mar; 52(1):1-7.
9. Ramos LR. Growing old in São Paulo, Brazil: assessment of health status and family support of the elderly of different socio-economic strata living in
the community [tese]. London (UK): London School
of Hygiene and Tropical Medicine; 1987.
10. American Dietetic Association, American Academy of Family Physicians, National Council on the Aging. Nutrition interventions manual for professionals caring for older Americans. Washington (US):
Nutrition Screening Initiative; 1992.
11. Ministério da Saúde. Secretaria de Atenção à Saúde.
Coordenação Geral da Política de Alimentação e Nutrição. Política Nacional de Alimentação e Nutrição. Como está sua alimentação? Brasília (DF): MS; 2006 [acesso 2011 Jan 02]. Disponível em: http:// nutricao.saude.gov.br/teste_alimentacao.php
12. Ministério da Saúde (BR). Secretaria de Atenção
à Saúde. Coordenação Geral da Política de
Alimentação e Nutrição. Política Nacional de
Alimentação e Nutrição. Guia alimentar para a população brasileira: promovendo a alimentação
saudável. Brasília (DF): MS; 2005.
13. Philippi ST. Guia alimentar para a população
brasileira e o uso da pirâmide. In: Waitzberg DL,
organizador. Nutrição oral, enteral e parenteral
na prática clínica. 4a. ed. São Paulo (SP): Atheneu; 2009. p.605-18.
14. Rigo II, Paskulin LMG, Morais EP. Capacidade funcional de idosos de uma comunidade rural do
Rio Grande do Sul. Rev Gaúch Enferm. 2010 Jun; 31(2):254-61.
15. Budó MLD, Saupe R. Modos de cuidar em
comunidades rurais: a cultura permeando o cuidado
de enfermagem. Texto Contexto Enferm. 2005 Abr-Mai; 14(2):177-85.
16. Monteiro MAM. Percepção sensorial dos alimentos
em idosos. Rev Espaço para a Saúde. 2009 Jun; 10(2):
34-42.
17. Instituto Brasileiro de Geograia e Estatística. Síntese de Indicadores Sociais: uma análise das condições de vida da população brasileira. Rio de Janeiro (RJ): Ministério do Planejamento, Orçamento e Gestão, 2009.
18. Inouye K, Pedrazzani ES. Nível de instrução, status
socioeconômico e avaliação de algumas dimensões da qualidade de vida dos octogenários. Rev Latino-am Enfermagem. 2007 Set-Out; 15(Esp):742-7.
19. Tavares VO, Teixeira KMD, Wajnman S, Loreto MDS. Interface entre a renda dos idosos aposentados rurais e contexto familiar. Textos Contextos. 2011 Jan-Jul; 10(1):94-108.
20. Cunha A S, Sichieri R. Trends in underweight, overweight and body mass index among elderly population of Brazil. J Nutr Health Aging. 2007
Jan-Feb; 11(1):15-9.
21. Carvalho EO, Rocha EF. Consumo alimentar de população adulta residente em área rural da cidade
de Ibatiba (ES, Brasil). Ciênc Saúde Coletiva. 2011 Jan; 16(1):179-85.
22. Sierra-Johnson J, Undén AL, Linestrand M, Rosell M,
Sjogren P, kolak M, et.al. Eating meals irregularly: a novel environmental risk factor for the metabolic
syndrome. Obesity(Silver Spring). 2008 Jun;
16(6):1302-7.
23. Associação Brasileira para o estudo da Obesidade
e da Síndrome Metabólica. Sobrepeso e obesidade:
diagnóstico. In: Abeso. Diretrizes brasileiras de
obesidade. 3a Ed. Itapevi (SP): AC Farmacêutica,
2009; p. 11-4.
24. Fisberg RM, Colucci ACA. Inquéritos Alimentares.
In: Waitzberg D, organizador. Métodos e bases
cientíicas. São Paulo (SP): Atheneu; 2009. p.373-79.
25. Malta D C, Oliveira MR, Moura EC, Silva AS, Zouain
para doenças crônicas não transmissíveis entre beneiciários da saúde suplementar: resultados do inquérito telefônico Vigitel, Brasil, 2008. Ciênc Saúde
Coletiva. 2011 Mar; 16(3):2011-22.
26. World Health Organization. Global Strategy on diet,
physical activity and health. Geneva: WHO; 2004.
27. Vinholes DB, Assunção MCF, Neutzling MB. Frequência de hábitos saudáveis de alimentação medidos a partir dos 10 Passos da Alimentação
Saudável do Ministério da Saúde. Pelotas, Rio Grande do Sul, Brasil. Cad Saúde Pública. 2009 Abr; 25(4):791-9.
28. Jorge RA, Cople RCS. Papel dos nutrientes na
prevenção e no tratamento da osteoporose: [revisão]. Rev Bras Nutr Clín. 2009 Jan-Mar; 24(1):66-71.
29. Ribeiro RSV, Rosa MI, Bozzetti MC. Malnutrition and associated variables in an elderly population
of Criciúma, SC.Rev Assoc Med Bras. 2011 Jan-Fev;
57(1):56-61.
30. Coutinho VF, Mendes RR, Rogero MM. Bioquímica e metabolismo dos carboidratos. In: Silva SMCS, Mura
JDP, organizadores.Tratado de alimentação, nutrição
e dietoterapia. São Paulo (SP): Roca; 2007. p. 21-53.
31. Lichtenstein AH, Rasmussen H, Yu WW, Epstein SR,
Russell RM. Modiied mypyramid for older adults. J Nutr. 2008 Jan; 138: 5-12.
32. World Health Organization. Cancer. Geneva: WHO,
2009. [acesso 2011 Nov 23]. Disponível em: http:// www.who.int/mediacentre/factsheets/fs297/en/
index.html
33. Marucci MFN, Alves RP, Gomes MMBC. Nutrição na geriatria. In: Silva SMCS, Mura JDP, organizadores. Tratado de alimentação, nutrição e dietoterapia. São Paulo (SP): Roca; 2007. p. 391-416.
Correspondence: Sara Franco Diniz Heitor Rua Tiradentes, 81
38200-000 – Centro, Frutal, MG, Brasil E-mail: [email protected]