DISCLOSURES AND DISCLAIMER AT THE END OF THE DOCUMENT PAGE 1/32 SEE MORE INFORMATION AT WWW.FE.UNL.PT
2009 can be seen as the year of the recovery of the financial markets, but not the whole economy. While the PSI-20
index has gone up 33.5%, the EURO area GDP still trails 4.1%
YoY according to the last numbers, and unemployment rates keeps increasing and are now at 9.8% for the Euro area.
BES main financial indicators seem to be improving. Net
profit increased 7.8% YoY on the first 9 months of the year with a
ROE annualized of 9.4%. We expect a 6.1% net profit CAGR 08-18E, and 5.4% net interest income CAGR 08-18E, driven by a increase on spreads, and 12.2% net interest income CAGR
08-18E on BES Angola (due to the expansion of Angolan economy) . Operating costs increased only 2.5% YoY, following a strategy of reducing expenditures (5.8% CAGR 08-18E). While the
provision levels rose 70.1% YoY (18.3% CAGR 08-18E) due to Economic recession, higher demand for credit and fear of default on loans.
After issuing new shares on April, 2009 core Tier I level was up to 8.2% and should end the year at 8.4% after the capital increase and stake selling of BES Angola. However we should expect core Tier I of 7.8% on 2012 unless happens a new capital increase or new shares issued in the next years. The requirement of Portuguese Central Bank is a core Tier I of 8.0%.
Company description
Banco Espírito Santo SA (BES) is a Portuguese commercial Bank. It is the Portuguese bank with the highest market capitalization. It main focus is on Corporate Banking, but also works as a Retail and Investment Bank. BES is part of the Espírito Santo Group. Besides Portugal it operates in Angola, Brazil, Spain, France and USA among others. Until September 2009, the international activity represented 35.2% of BES total net income of 2009.
04
J
ANUARY2010
BES
COMPANY REPORT
B
ANKING
A
NALYST
:
F
ELIPE
M
OSA
[email protected]
BES is a buy stock
After the turmoil of the crisis BES seems as the best
option in the PSI-20 for the bank sector
Recommendation: BUY
Vs Previous Recommendation BUY
Price Target FY10: 5.65 €
Vs Previous Price Target 5.56€
Price (as of 4-Jan-10) 4.65€
Reuters: BES.LS, Bloomberg: BES PL
52-week range (€) 2.65-5.34
Market Cap (€m) 5,427
Outstanding Shares (m) 1,167 Beta 1.21 Source: BES, Reuters, NOVA Research Team
Source: NYSE Euronext
(Values in € millions) 2008 2009E 2010E Net Interest Income (NII) 1,086 1,204 1,270 Net Fees and Commissions 599 679 714 Operating Costs 1,002 1,061 1,121 Net Income 402 475 519 Total Assets 75,187 81,514 86,429 Spread (%) 1.76 1.83 1.83 NII / Total Assets (%) 1.44 1.48 1.47 Banking Income/Assets (%) 2.51 2.61 2.64 Operating Costs/Assets (%) 1.33 1.30 1.30 Loans/Deposits (%) 178.3 181.7 179.6 Assets/Equity 16.16 12.52 12.85
EPS 0.51 0.41 0.45
P/E Ratio 11.9 11.2 12.7 ROA (%) 0.56 0.58 0.60 ROE (%) 9.76 7.30 7.72 Cost to Income (%) 53.0 56.75 49.89 Core Tier I Standard (%) 5.7 8.4 8.2 Source: BES, Bloomberg, Reuters, NOVA Research Team
60 80 100 120 140
Jan-09 Apr-09 Jul-09 Oct-09
BES vs PSI 20
PAGE 2/32
Table of Contents
EXECUTIVE SUMMARY ... 3
MAIN EVENTS OF 2009... 4
MACROECONOMIC ANALYSIS ... 5
WORLD DEVELOPMENT IN 2009 AND EXPECTATIONS FOR THE FUTURE ... 5
PORTUGAL, ANGOLA, BRAZIL AND SPAIN IN 2009 AND EXPECTATIONS FOR THE FUTURE ... 7
COMPANY OVERVIEW ... 9
COMPANY DESCRIPTION ... 10
Corporate Banking ... 11
Retail Banking ... 13
Banco Espírito Santo Angola (BESA) ... 17
Banco Espírito Santo de Investimento (BESI) ... 19
BESI and BESA Importance ... 21
BES PENSION FUND ... 21
SHAREHOLDER STRUCTURE ... 22
THE SECTOR ...23
SENSITIVITY ANALYSIS OF COST OF EQUITY AND G ... 26
SENSITVITY ANALYSIS OF SPREAD AND CREDIT TO CUSTOMER’S ... 26
CASE SCENARIOS ... 28
ANNEX: FINANCIAL STATEMENTS ...29
INCOME STATEMENT ... 29
BALANCE SHEET ... 30
PERFORMANCE RATIOS ... 31
SHARE PRICE STRUCTURE ... 31
PAGE 3/32
Executive summary
BES price target has been set for the year of 2010 at 5.65 Euros per share. This represents 21.50% return above today’s market price of 4.65 Euros per share. BES’s stock price today means a positive return of 8.3% YoY, the BCP share shows a return of 3.7% YoY and BPI share has a positive performance in 2009, with a return of 21.1%.
All the stocks had a negative performance on the first quarter of the year. BPI stock was the first one to show profit over the year, on middle April right before the announcement of the first quarter results. BES and BCP only showed gains since January, on July and August respectively. The recovery of the
Portuguese economy and of the stock exchanges around the world has allowed the stocks of the PSI-20 to have a positive return on 2009.
If we enlarge our perspective to 2008 we can see that all the three shares are trading now below 2008 levels, but we should expect then to increase value at a slow pace on the next months, as they seem to have reached the bottom on March 2009.
BES, for example, was trading at 9.40 Euros on January 2008. Today it is being traded at 4.65 Euros, meaning a negative return of 51%. But of the three shares, BES is the one that lost less value. BCP share devaluated 65%, from 2.52 Euros on January 2008, it is now worth 0.88 Euros. BPI has a negative return of 58%.
60 80 100 120 140
Jan-09 Mar-09 May-09 Jul-09 Sep-09 Nov-09
Graph I - Stock Closing Prices in 2009
BES BCP BPI
Index: January 2009=100
Source: Euronext
20 40 60 80 100
Jan-08 Apr-08 Jul-08 Oct-08 Jan-09 Apr-09 Jul-09 Oct-09
Graph II - Stock Closing Prices 2008 - 2010
BES BCP BPI
Index: January 2008=100
Source: Euronext
PAGE 4/32
Main Events of 2009
January
BES Angola issued 53 thousand new shares, raising its Capital level to 10.5 billion dollars at the time. BES participation on BESA dropped from 80.0% to 75.9%.
March
BES sold its participation on Morumbi Capital Fund, profiting 832 thousand Euros.
BES was authorized by the Bank of Portugal to use the foundation IRB method for its credit risk in order to calculate its level of capital requirements. This allows the Bank to have lower levels of provisions. BES Core Tier I and Tier I of the third quarter of the year are at 8.2% and 8.8% respectively.
April
On April, BES launched in the market 666.7 million new shares. And now the Bank has 1,166.7 million shares on the stock market. The capital level rose from 2.5 billion Euros to 3.5 billion Euros.
June
On the first semester of the year, the Bank issued 3.7 billion Euros in debt (the debt to refinance in 2009 was of 3.2 billion Euros). On the third quarter BES issued more 0.7 billion of Euros on debt. A total of 4.4 billion Euros in the year.
August
BES created a new holding Company. With a capital of 100 million Euros, and more than 1 billion Euros in Assets, Avistar holds BES participations on Portugal Telecom (owns 9.34% of PT’s capital), EDP (2.35%) and Bradesco (5.33%).
November
BES issued more 1 billion Euros in debt. A total of 5.4 billion Euros over the year.
BES bought 40% of Libya’s Aman Bank, on an investment of approximately 37.8 million Euros. The acquisition intends to expand the international activities of the Bank and confirms the strategy of the bank to spread its activities on North Africa.
The IRB method was established on Basel II
BES issued 68.7% more debt than the whole amount of debt to refinance in 2009 BES market capitalization as of today is of 5.3 billion Euros
PAGE 5/32
BESA distributed extraordinary dividends of approximately 122.7 million Euros; there was also a capital increase from 10 million dollars to 170.5 million dollars.
December
BES sold 24% of its participation on BESA for approximately 254.2 million Euros, a financial gain of 180 million Euros. It seems a good deal that BES has made there, and we will discuss more of it on BESA chapter.
Macroeconomic Analysis
World Development in 2009 and Expectations for
the Future
The year of 2009 started with the major economies of the World facing
recession. The GDP of the Euro area had a decrease of 2.4% QoQ on the first quarter of the year, a drop of 5.0% YoY. The United States faced a drop of 1.6% QoQ and 3.3% YoY on the first quarter; and Japan a reduction of 3.2% QoQ and 8.4% YoY in the same period.
But in the third quarter of the year the numbers changed significantly. The Euro Area had an increase of 0.4% QoQ but still a drop of 4.1% YoY. The United States also recovered from technical recession on the third quarter of the year with an increase of 0.7% QoQ and a drop of 2.5% YoY. Japan was able to recover even before, at the second quarter the GDP increased 0.7% QoQ, and the numbers of the third quarter reveal a rise of 1.2% QoQ and 4.4% YoY drop. The forecast is that 2010 and 2011 show low but positive growths of the
GDP. GDP growth rate is important in the sense it signals to the market the health of the economy. A positive growth rate means that the economy is growing and so we should expect higher expenditures of either public or private sectors. More investments means more financing is needed and therefore banks have more activity. During a recession period the demand is low and the savings are higher. Higher savings means more interest earning liabilities for banks, resulting in higher costs. So for the banking activity a positive growth rate is
desirable and that is what we expect for the next years.
4Q 2008 1Q 2009 2Q 2009 3Q 2009 USA -1,90% -3,30% -3,80% -2,50% Euro Area -1,80% -5,00% -4,80% -4,10% Japan -4,40% -8,40% -7,10% -4,40%
-9,0% -7,0% -5,0% -3,0%
-1,0% GDP Growth YoY
USA Euro Area Japan Source: Eurostat
4Q 2008 1Q 2009 2Q 2009 3Q 2009 USA -1,40% -1,60% -0,20% 0,70% Euro Area -1,90% -2,40% -0,20% 0,40% Japan -3,00% -3,20% 0,70% 1,20%
-3,5% -2,5% -1,5% -0,5% 0,5%
1,5% GDP Growth QoQ
USA Euro Area Japan Source: Eurostat
PAGE 6/32 4,0% 5,5% 7,0% 8,5% 10,0%
nov/2008 feb/2009 may/2009 aug/2009
Evolution of Unemployment Rates 2008 - 2009
Euro Area USA Japan Source: Eurostat -1,0 0,0 1,0 2,0 3,0 4,0
2000 2001 2002 2003 2004 2005 2006 2007 2008 2009F
Evolution of Annual Average Inflation Rate 2000 - oct/2009
Euro Area USA Japan Source: Eurostat, IMF
(%) 3,5 5,0 6,5 8,0 9,5 11,0
2005 Jan 2006 Jan 2007 Jan 2008 Jan 2009 Jan
Evolution of Unemployment Rates jan/2005 - oct/2009
Euro Area USA Japan Source: Eurostat (%) 99 100 101 102 103
jan/2009 apr/2009 jul/2009 oct/2009
Evolution of Inflation Rate in 2009
Euro Area USA Japan Source: Eurostat, IMF
Index: January 2009=100
Another important indicator to analyse the development of the economy is the unemployment rate. But opposed to the GDP growth rate, the unemployment rates doesn’t seem to be getting back to its low levels any time soon. As of October 2009, the Euro area rate increased 130 bp since the beginning of
the year, and the United States rate raised the double, 260 bp. The Japanese rate increased 90 basis points, but shows signs of recovery because it has been decreasing since August.
High levels of unemployment translates into lower spending of the economy, and less credit demand because credit customers will not take loans if they don’t know if they will have jobs (in the case of private loans) or clients (in the case of corporate loans). Therefore high unemployment rates are undesirable for
banking activity. The expectation however is that levels of unemployment rate stays high in Europe for the next periods.
The inflation rate has dropped in a sharp way when comparing 2009 levels
to the ones of 2008. The aggregated inflation of 2009 up to October is of 1.3%
in the Euro area, when the historical average from 2000 to 2008 was 2.3%. Very
low levels of inflation can put a country next to a deflation level and that is not wanted for an economy due to the fact that deflation means liquidity trap and low levels of economic activity. But with the recovery of the economic activity we can expect higher levels of inflation in the near future.
The main interest rate of interbank euro lending is the euribor rate for
3-months, and as expected on a recession scenario, it has dropped in 2009. But it actually plummeted 216 basis points, from 2.859% to 0.700%. This result can be explained by the aid provided by the European Central Bank (ECB) during the crisis, by offering high levels of liquidity supplies for banks in order to stimulate the economic activity.
Flattens and low levels of Euribor rates reduces the mismatch effect of spreads, and therefore the spreads are usually lower at this kind of scenario.
-6,0 -4,0 -2,0 0,0 2,0 4,0
2000 2001 2002 2003 2004 2005 2006 2007 2008 2009 F 2010 F 2011 F
Graph III - Evolution of GDP growth
Rate 2000 - 2011F
Euro Area USA Japan Source: Eurostat (%) 0,5 1,0 1,5 2,0 2,5 3,0
Jan-09 Apr-09 Jul-09 Oct-09
euribor 3-months
euribor 3-months
PAGE 7/32
70 90 110 130 150
Jan-09 Apr-09 Jul-09 Oct-09
Stock Markets Index Return
S&P 500 Nasdaq DAX Nikkei 225 Source: Bloomberg
Index: January 2009=100
However with low interest rates the credit demand is higher, and banks can make money through the total amount of interest bearing assets and liabilities .
The expectation on the market is that Euribor rates will start to rise in the next periods, and with a upward slope yield curve, we should expect lower demand but higher spreads.
The Euro has appreciated 3.5% in 2009 against the US dollar. For an International bank like BES, it means that the international position at Angola, Brazil and the United States for example, have a lower impact/risk than before.
The expectation however is that the Euro depreciate against the dollar in the next periods due to the high levels of indebtedness of public accounts of the European governments and the lower credit offer.
The main stock markets around the world showed recovery in 2009. They started the year still declining, but in March the indexes started to rise. At the end of 2009, the S&P 500 returned 23.45%, Nasdaq 43.89%, DAX 23.85% and the
Nikkei 225 from the Tokyo Exchange has a return on the year of 19.04%. These numbers demonstrates that the financial turmoil in the stock markets seems to be in the past. With the highest values being reached at the last days of the year, signs of recovery are all around the world’s stock markets, and therefore we
shall expect an increase of the stock prices for the next months.
So we can conclude that the world seems to be recovering from the crisis with a slow pace, but rising unemployment rates and deficit levels of countries and corporations are a concern to the world. Higher rates of unemployment mean lower consumption, which could lead to lower production and consequently lower increase of the GDP. A way to fight that would be for companies and governments to invest more, however both are struggling to keep their budgets positive, so it will not be an easy task to put the economy back to its track. Therefore we can see that the crisis is still not over.
But in the financial markets the perspective is the opposite. The stock indexes are all rising, and this could be due to several factors, but one of them is the reduction of the interest rates, that for companies means lower costs of financing, and for private investors means lower opportunity costs to invest in the stock markets, the gains on the stock markets shall continue as long as stocks remains undervalued.
Portugal, Angola, Brazil and Spain in 2009 and
Expectations for the Future
Portugal is the main market for BES, and in the International activity BES’s has a strategic triangle formed by Angola, Brazil and Spain. Therefore it is
1,25 1,35 1,45 1,55
Jan-09 Apr-09 Jul-09 Oct-09
EUR/USD
EUR/USD Source: Bloomberg
1,0 2,0 3,0 4,0 5,0
2003 2004 2005 2006 2007 2008 2009E 2010F 2011F
Euribor 3-months 2003 - 2011F (Year Average)
euribor 3-months Source: Euribor
PAGE 8/32 important to take an outlook on how the economies of these countries have been developing in 2009 and what are our expectations for the future periods.
The GDP growth rate of these countries shows that they were all affected by the world crisis. On the third quarter of 2009, the Portuguese GDPhaddecreased
2.4% YoY, but showed a 0.9% increase QoQ. The Spanish GDP decreased
4.0% YoY and 0.3% QoQ in the same period. Brazil’s GDP decreased on the last quarter of 2008, historical 3.4% QoQ, but in the last figures published by the Brazilian Government it shows 1.3% rise QoQ, and 1.2% decrease YoY. The Angolan Minister of Economy stated on November that he expects the Angolan
GDP to rise 1.3% this year, in the previous year the GDP rose 13.2% according to IMF.
Although showing slightly recent recovery, Portugal and Spain should expect a
difficult year in 2010 and in the next years. With high levels of budget deficit (both countries are in the list of the four highest levels in the Euro area) and unemployment rates, those countries will need aid from the EU in order to improve its macroeconomic status.
The high level of public debt drove down the Portuguese Sovereign Credit rating. This impacts in the Portuguese banks ratings. Banks have to pay higher
spreads over new debts with lower ratings; this is due to the fact that banks become more risky to investors in terms of making a default.
On the good side, Portuguese private consumption has increased in the last
months, which can drive the increase of the GDP, since the Government will have to combat the public debt by reducing expenditures (or by increasing taxes) and therefore investing less.
Spain will still be affected by the bubble on the housing market, and consumer confidence, differently as in Portugal, still has not increased. It will be a difficult year for Spain, but hopes surge with the Spanish presidency of the European Council.
Brazil and Angola face a different perspective for next year’s than Spain and Portugal. With Brazilian economy rising from recession at full power with positive trade balance and appreciation of the national currency, we should expect
Brazil to continue its growth. The recent rise on the oil price, the increase of OPEC’s quota and the investment on non-oil activities, Angola economy will return its rise, but probably won’t see double digits GDP growth rates in the
near future.
The unemployment rate of Brazil decreased from 8.2% at the beginning of the year to 7.5% in October this year. The Spanish and the Portuguese rates keep rising since January. The Spanish rate is at 19.3% and the Portuguese at
4Q 2008 1Q 2009 2Q 2009 3Q 2009 Spain -1,1% -1,6% -1,1% -0,3% Portugal -1,7% -2,0% 0,5% 0,9% Brazil -3,40% -1,00% 1,10% 1,30% -3,5%
-2,5% -1,5% -0,5% 0,5%
1,5% GDP Growth QoQ
Spain Portugal Brazil Source: Eurostat, IBGE
4Q 2008 1Q 2009 2Q 2009 3Q 2009 Spain -1,2% -3,2% -4,2% -4,0% Portugal -1,9% -4,0% -3,7% -2,4% Brazil 0,8% -2,1% -1,6% -1,2% -5,0%
-3,0% -1,0%
1,0% GDP Growth YoY
Spain Portugal Brazil Source: Eurostat, IBGE
6% 9% 12% 15% 18% 21%
nov/2008 feb/2009 may/2009 aug/2009
Evolution of Unemployment Rates
Portugal Spain Brazil
PAGE 9/32
10.2%. Those are very concerning numbers to the recovery of the economy, since they do not seem to be decreasing in the next months.
Brazil has inflationary pressure due to high levels of consumptions, and
Spain and Portugal are facing not wanted scenarios of negative inflation.
Angola inflation rates has decreased significantly over the last few years (from 325% per year in 2000 to 12.5% per year in 2008), but we should still
expect double digits inflation rates for the next years. As of October the Portuguese aggregated inflation for the year is 0.4%, the Spanish 1.6% and the Brazilian 3.0%. If the consumers’ confidence level doesn’t increase in the next months, Portugal and Spain can still face a deflation. For Brazil it is more likely that the targeted inflation of 4% will be reached in 2010.
The PSI-20, the IBEX 35 and the IBOVESPA showed positive performance in 2009. The IBOVESPA from the Brazilian stock market returned astonishing
82.7%. The PSI-20 had a return of 33.5% in the year, and the IBEX 35 of
29.8%.
With the data above we can see that the Brazilian economy has been able to deal better with the crisis than Spain and Portugal. And if the expectations of the Minister of Economy of Angola concretize, than Angola will still have a positive growth on its economy for the year of 2009. Those two countries seem as a good opportunity to place new investments, and so for BES it is important to be present in this markets that weren’t as affected as Europe, United States and Japan by the crisis.
Company overview
BES is a commercial Portuguese bank. The largest Portuguese bank in market capitalization and the third-largest Bank in total assets. It main activities are
Corporate, Retail and Investment Banking.
Differently than its peers, BES follows an organic growth. According to the bank data its market share in Portugal has evolved from 8.5% in 1992 to 20.7% in 2008. The number of clients has increased from 1.4 million in 1991 to 2.2 million in 2008. The number of accounts also rose from 6 million in 2005 to 7.8 million in 2008.
BES is also an International bank, with a stake of 51.94% on BES Angola, a stake of 40% in Aman Bank of Libya, and branches and offices on Spain, Brazil (where BES is the biggest Portuguese Bank with activities there), France, United Kingdom, and United States among others. Its main international focus is on Spain, Brazil and Angola forming the called Strategic Triangle.
99 100 101 102 103
jan/2009 apr/2009 jul/2009 oct/200
Evolution of Montlhy Average Inflation Rate in 2009
Portugal Spain Brazil Source: Eurostat, IBGE
Index: January 2009=100
70 100 130 160 190
Dec-08 Mar-09 Jun-09 Sep-09 Dec-09
Stock Markets Index Return
PSI-20 IBEX 35 Ibovespa Source: Bloomberg
Index: January 2009=100
5.4 billion Euros in Market Capitalization, and 80.7 billion Euros in Total Assets
BES also bought a participation of 2.5%
on Denmark’s Saxo
PAGE 10/32 The strategy behind BES international expansion is to support Portuguese
firms around the world and also countries that have ties with the Portuguese culture; this is also the advantage of BES to other international banks investing in those countries.
For example, the number of Portuguese exporting companies in Spain is near 6 thousand, in Angola 2.5 thousand and in Brazil more than 1 thousand. Countries geographically near Portugal and with high growth rates are also in BES’s plans. BES is present in Morocco (IMF estimates Morocco to grow 3.2% in 2010), Algeria (3.7%), Tunisia (4.0%) and Lybia.
The main activity performed by BES in international territory is Corporate Banking in Angola and Spain; Investment Banking in Brazil, Spain and Angola;
Private Banking in Angola, Spain and United States; and Wholesale Banking in the UK and USA.
Mr. Ricardo Salgado, BES’s CEO, has said that BES is now aiming at others
countries to expand the international frontier of the bank, namely
Mozambique and China. This strategy follows the rationale that the Portuguese banking activity is saturated, and in order for BES to grow it must explore new countries, especially the developing economies.
Company description
BES numbers recorded for the first time in 2009 a year over year increase on net profits according to the bank press release of October 2009. In the first nine months of the year the bank had a 7.8% YoY increase on net profit, and an
annualized ROE of 9.4%. The Core Tier I and Tier levels were of 8.2% and 8.8%respectively, attending the Portuguese Central Bank requirement of 8%.
In the graph IV bellow we can see that net interest income, operating costs
and net comissions have all followed a positive tendency since 2004. And we shall expect the positive growth to maintain in 2010. In our estimates NII will
rise 5.5% YoY, Operating Costs 5.7%, an Net Comissions 5.1%.
PAGE 11/32
BES more profitable sector according to the first three quarters of 2009 is the
Corporate Banking Sector, with 35.9% of total net profit before taxes. In 2008, that number was even higher at 54.1% in the same period. It is also the sector with higher demand for credit to customers. 41% of total credit to customers went to the Corporate Banking Sector.
Retail Banking and International Commercial Banking are also 2 major drivers of BES value. They were responsible for 25.2% and 26.1% respectively, of total net profit before taxes. Retail Banking had the most banking income for BES (26.7%), but also the highest operating costs (40.2%). And International commercial banking had the highest part of BES total resources from clients (45.1%).
Corporate Banking
According to the bank numbers, BES has 23.8% of the market share in
Portugal on Corporate Banking, the second highest (only behind Caixa Geral de Depósitos); in total banking activity the share is lower at 20.7%, the third highest.
The Corporate Banking activity aggregates not only corporations (from small to large Business) but also municipalities and institutions. BES has 0
50 100 150 200 250 300 350
1Q04 1Q05 1Q06 1Q07 1Q08 1Q09
In
M
il
li
on Eur
os
Graph IV - BES main P&L indicators since 2004
Net Interest Income Net Comissions Operating Costs Net Profit
Source: Bank Release
25%
41%
22%
6%
36% 36%
26%
36%
27%
40%
5%
25% 45%
22% 20%
15%
22%
26%
0% 10% 20% 30% 40% 50%
Resources from clients
Credit to Customers
Banking Income Operating Costs Provisions Net profit before taxes
Graph V - Weights of different sectors on Global BES
activity on 9M 2009
Corporate Banking Retail Banking International
Source: October 2009, Bank Release Total Net Profit
before taxes & minorities of 9M 2009 is 470.4 million Euros (+12.5% YoY)
PAGE 12/32 28 Corporate Centres’ that provides services for its clients such as credit, renting, insurance, factoring, leasing, financial advisory, and others.
This sector showed on the first three quarters of 2009 a banking income increase of 16% YoY, but a net profit drop of 25.4% YoY, mainly due to the increase of 200% or 110 million Euros on net provisions.
An important factor to notice is that opposing to major Portuguese banks like BCP and BPI that have a high supply of private credit either by mortgage or other private credit, BES main supply of credit goes to Corporations. The corporate lending was responsible for 66.9% of BES total credit supply on the first three quarters of 2009. On the same period of 2008 the importance of corporate loans was of 65.5%.
For a bank it is very interesting to have on its assets this kind of credit portfolio since corporate loans have potentially lower risk (credit default risk and
interest rate risk) and have more easily adjustable contracts due to the fact they usually are short-term contracts and often are renewed after expiration.
Mortgage loans usually have a longer extension and higher risk (credit default risk and interest rate risk), and so they are more rigid in terms of changing initial conditions of the contract.
Euribor evolution and the Repricing Case
The reference interest rate of funding (deposits, interbank loans, debt obligations and other liabilities earning assets) and lending (credit and other earning assets) in most cases is the Euribor 3-months, the spread between the rates on
receivables and payables is where the banks earns money (also through commissions, investments, and others). The flatter the yield curve of the interest rate the lower the margin a bank can have on interest.
If the yield curve has an upward slope, then banks can take advantage of it and earn higher spreads. This happens because the interest earning assets often have longer maturities, meaning that in the case of interest rates raising in the horizon the assets will have higher value than the liabilities. This is called in the market as the mismatch effect.
66,9% 27,8%
5,3%
Graph VI - Credit Portfolio on 9M 2009
Corporate
Mortgage
Other private credit
Source: October 2009, Bank Release BCP has 54% to
corporate, 39% to mortgage and 7% to others
BPI has 44% to corporate, 40% to mortgage and 16% to others
Companies differently than individuals can have their probability of default measured by a credit rating agency. Therefore Banks have some kind of better knowledge of whom they are lending money for.
PAGE 13/32 What we are seeing nowadays is the flattening of the Euribor rate at a low level (from September 2009 to today’s level the Euribor 3–months felt 5 bp; from September 2008 to September 2009 the rate decreased from 5.28% to 0.75%). So we should assume banking net income to reduce, but due to the repricing
that BES was able to do with its assets, the margin even increased in the last quarter (opposed to what happened to BCP, for example).
BES was able to reprice the interest rate of a significant number of its credit contracts, due to the credit portfolio of high weight on corporate loans.
The spread of the Bank went from 1.70% (euribor 3-months average of 4.77%)
on September 2008 to 1.89% (euribor 3-months of 1.40%) on September 2009.
The tax over earning liabilities felt 173 bp in this one year period, but the tax over earning assets decreased 154 bp, a significant 19 bp difference.
Retail Banking
Although on net income before taxes the Retail banking sector had a positive
growth of 13.8% YoY on 2009 compared to 2008, this segment of the company showed a poor performance on banking income with an 8.6% YoY drop. This
1% 2% 3% 4% 5%
4Q 2007 1Q 2008 2Q 2008 3Q 2008 4Q 2008 1Q 2009 2Q 2009 3Q 2009
Graph VII - BES and BCP Spreads and Euribor Evolution
BES BCP Euribor 3-months average
Source: Bank releases and Euribor
2% 3% 4% 5% 6% 7%
4Q 2007 1Q 2008 2Q 2008 3Q 2008 4Q 2008 1Q 2009 2Q 2009 3Q 2009
Graph VIII - BES and BCP Spreads over Credit to
Customers and Deposits
BES rate on credit to customer's BES rate on Deposits
BCP rate on credit to customer's BCP rate on Deposits
PAGE 14/32 result was mainly driven by the drop of the Euribor rates, but also to the high
competition on the Portuguese market for deposits of clients that drove the profits of the activity down (BES spread over deposits felt from 3.07% at the end of 2008 to 2.06% at the third quarter of 2009).
Although there was higher competition for deposits on the Portuguese market, BES was able to increase its number of clients of retail banking. In 2009 the
bank incorporated a total of 97 thousand new clients. In the same period
resources from customers and loans1 have also increased with a YoY rise of 5.62%. BES had an active policy of getting new clients through cross-selling activity (BES created on the beginning of the year a private unemployment insurance responsible for 7% of the new clients, and cross-selling campaigns with hotels that brought 18% of the new clients) and increasing the number of branches (responsible for bringing 18% of the new clients). The Assurfinance program delivered 19% of the new clients; the program provides the insurance branches (Tranquilidade Seguros) the possibility to sell not only insurance products but also banking products.
BES market share of Resources from customers and loans is of 11.5% as of the first half of 2009, an increase of 100 bp when comparing to the first quarter of 2007, and qualifying BES as the third bank in resources from client in
Portugal. In the same period BCP, BPI and CGD also raised their shares, by 218 bp, 159 bp and 22 bp, respectively. Of the major 5 banks in Portugal, Santander Totta is the only one who lost market share, a total of 116 bp.
BES market share on resources from customers and loans has been slowly decreasing in the last 2 quarters but we should not assume that it continues. We shall expect that BES maintains its role as the third banking in terms of deposits.
1
Resources from Customers and loans represents the deposits of clients and other debits of clients
17 19 21 23 25 27
1Q04 1Q05 1Q06 1Q07 1Q08 1Q09
In
B
il
li
on
Euros
Graph IX - Quarterly Evolution of BES's Resources from
customers and loans
Source: Bank Release
PAGE 15/32 In the first three quarters of 2009, all the major banks of Portugal (BES, BCP, CGD, BPI and Santander Totta) had an increase of credit to customer’s level, and only BPI showed a reduction of resources from clients. This means that the economic activity on Portugal is growing and we should expect even better numbers when the crisis is over.
BES’s credit to customer’s level is increasing at a rate of 3.34% YoY. BES
market share in Portugal over credit to customers was of 14.76% on June 2009, a figure 84 bp higher than in the first quarter of 2007. In the same period CGD raised 192 bp and BCP 37 bp, while BPI dropped 76 bp and Santander Totta 61bp. BES remained as the third place in market share of credit to
customers over the period.
10,4% 10,8% 11,2% 11,6% 12,0%
170 180 190 200 210 220
1Q07 2Q07 3Q07 4Q07 1Q08 2Q08 3Q08 4Q08 1Q09 2Q09
In
B
il
li
on Eur
os
Graph X - Quarterly Evolution in Portugal and BES market
share over Resources from Customers and Loans
Aggregated Portuguese Banks BES share
Source: Portuguese Central Bank and BESRelease
5,0% 10,0% 15,0% 20,0% 25,0%
1Q07 2Q07 3Q07 4Q07 1Q08 2Q08 3Q08 4Q08 1Q09 2Q09
Graph XI - Quarterly Evolution of BES's Peers Market Share on
Resources from Customers and Loans
BCP share BPI share CGD share Santander Totta share
Source: Portuguese Central Bank and Bank Releases
The 5 major banks in Portugal represent 82% of total credit to
PAGE 16/32
But as levels of Credit to customers are increasing, so are the levels of provisions. Since 2004 the CAGR of credit to customers is of 11.54% and of
provisions is 10.63%. The provision represents the savings of the banks against a default of the borrower, is like a safe deposit. The higher the risk on the credit portfolio, the higher should be the provision. So if we are observing an 26
30 34 38 42 46 50
1Q04 1Q05 1Q06 1Q07 1Q08 1Q09
In
B
il
li
on Eur
os
Graph XII - Quarterly Evolution of BES's Credit to Customer's
Source: Bank Release
13,9% 14,2% 14,5% 14,8%
250 270 290 310 330
1Q07 2Q07 3Q07 4Q07 1Q08 2Q08 3Q08 4Q08 1Q09 2Q09
In
B
il
li
on
E
u
ros
Graph XIII - Quarterly Evolution in Portugal over Credit to
Customers and BES Market Share
Aggregated Portuguese Banks BES share
Source: Portuguese Central Bank and BES Release
8,0% 12,0% 16,0% 20,0% 24,0%
1Q07 2Q07 3Q07 4Q07 1Q08 2Q08 3Q08 4Q08 1Q09 2Q09
Graph XIV - Quarterly Evolution of BES's Peers Market Share
on Credit to Customers
BCP share BPI share CGD share Santander Totta share
PAGE 17/32
increase of credit to customers higher than the provisions we should have a portfolio less risky over time. And that is what happened form 2004 to 2008. The risk cost (provision for credit / credit to customers’) of BES felt from 0.79 to 0.57. However in 2009, this value almost doubled to 1.03% due to uncertainties of the market.
Two main branches of retail banking of BES are BEST (Banco Electrónico de Serviço Total) and Banco Espírito Santo dos Açores. BEST showed a
positive result of 3.8% YoY on net profit, mainly driven by the increase of credit to customers of 20% YoY. On the other hand, BES dos Açores showed a
negative result of 21% YoY on net profit, and 10% YoY drop on banking income.
Banco Espírito Santo Angola (BESA)
BESA is perhaps nowadays the most important arm of the BES Group outside Portugal. Angola shows a high speed development of the economy over the past years, mainly due to the oil production and the end of the civil war. And as so, Angola presents itself as an excellent opportunity for BES to invest.
The estimative for 2009 is a low GDP growth of 1.3%, but next year expectations are of a GDP growth rate of 11.4%. The GDP felt this year due to the slump on the oil price, but Angola is now investing in other sectors of the economy such as infrastructure in order to not depend so much on the oil industry. The oil price however still represents a high risk on the investments made over there.
Others concerning factors of Angola economy is almost 50% unemployment rates, and double digits inflation rates. Also political instability and corruption common to undeveloped countries plays an important role on the country.
However BES has been able to make massive profits on the Angolan activity. BES strategy over Angolan market is very different than the BPI strategy over there, for example. While BES focuses on Corporate Banking aiding more
80 100 120 140 160 180 200 220
1Q04 1Q05 1Q06 1Q07 1Q08 1Q09
Graph XV - Quarterly Evolution of BES's Credit to
Customer's and Provisions growth rate
Credit to Customers Provisions Source: Bank Release
Index 1Q 2004 = 100
PAGE 18/32 Portuguese companies, BPI focuses on retail banking. It has been a fortunate strategy since the credit risk seems lower for Corporations than for Angolan investors. And also the expenditure with tangible fixed assets and staff costs is lower in this kind of business.
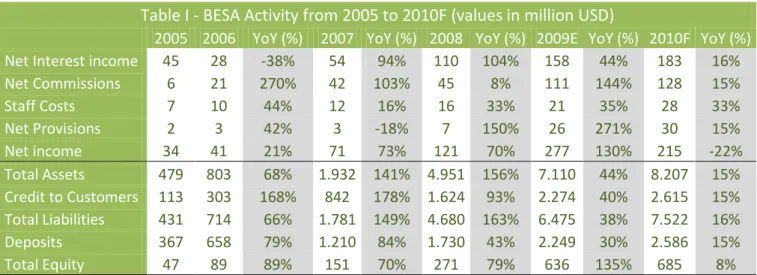
In 2005, BESA had a net income of 34 million dollars; in the end of 2008 this numbers was 120.5 million dollars, an impressive CAGR of 52.46% in net
income. But in assets the figure is even higher, from 479 million dollars in total assets in 2005 to 5 billion dollars at the end of 2008, a CAGR of 118% in total
assets. The ROE on 2008 was of 44.5%, BES’s ROE on the same year was of 9.76%
In September 2009 the net profit has increased 66% YoY, driven mainly by
Capital Markets and other results with a 211% YoY rise, and Net Interest
Income increase of 43% YoY. The credit to customer’s level was 62% YoY
higher, and resources from clients 8% YoY.
Bellow we can see the evolution of BESA main drivers since 2005:
Table I - BESA Activity from 2005 to 2010F (values in million USD)
2005 2006 YoY (%) 2007 YoY (%) 2008 YoY (%) 2009E YoY (%) 2010F YoY (%)
Net Interest income
45
28
-38%
54
94%
110
104%
158
44%
183
16%
Net Commissions
6
21
270%
42
103%
45
8%
111
144%
128
15%
Staff Costs
7
10
44%
12
16%
16
33%
21
35%
28
33%
Net Provisions
2
3
42%
3
-18%
7
150%
26
271%
30
15%
Net income
34
41
21%
71
73%
121
70%
277
130%
215
-22%
Total Assets
479
803
68%
1.932 141% 4.951 156%
7.110
44%
8.207
15%
Credit to Customers
113
303
168%
842
178% 1.624
93%
2.274
40%
2.615
15%
Total Liabilities
431
714
66%
1.781 149% 4.680 163%
6.475
38%
7.522
16%
Deposits
367
658
79%
1.210
84%
1.730
43%
2.249
30%
2.586
15%
Total Equity
47
89
89%
151
70%
271
79%
636
135%
685
8%
Source: BESA releases and Analyst Estimates and Forecasts
As expected, the importance of BESA has increased on BES’s income before taxes. It has passed from 8.2% on 2005, up to 17.0% in 2008 and to 21.2%
over the first nine months of the year.
0%
5% 10% 15% 20% 25%
2005 2006 2007 2008 9M 2009
Graph XVI - BESA participation on BES total net Income
before Taxes and Total Assets
PAGE 19/32 And if we take into account that the international participation on 2008 was of 36.6% of BES total net income, we can see that BESA represented 56% of all the international activity of BES in 2008, and astonishing 78.5% over the first three quarters of 2009.
On recent days, BES sold 24% of its participation on BESA to Portmill Investimentos & Telecomunicações (a group of Angolan investors), for a value of approximately 254 million Euros (evaluating BESA total value at 1.06 billion Euros, a number that corresponds to 20% of BES market capitalization at date), a capital gain of 180 million Euros. BES participation shrunk from
75.94% to 51.94% which still provides BES the majority of the shares, and also the possibility of consolidating 100% of BESA in BES numbers.
Before the selling, BESA had announced extraordinary dividend payments of
122.7 million Euros, and raised the capital level of the bank from 10 million dollars up to 170.5 million dollars.
BES had to sell part of BESA due to Angolan legislation over banks. But the decision to stay on Angola was a choice that BES made, and since the Angolan bank has a big contribute to BES operations it seems a wise decision to
maintain the activity over there. Angola is the main branch outside Portugal, and the expectation is that Angolan economy will keep recording high GDP growth rates, and not only in the oil industry, but all over the economy. And also, Portuguese companies are moving major parts of their activities to there, so staying in Angola means a very good opportunity for BES to profit.
BES has also other international branches of Commercial Banking on
countries like United Kingdom, Spain, United States, France, Macau and Cape Verde, among others, but they represented together approximately 19% of BES total income before taxes of international commercial banking activity over the first nine months of 2009.
Banco Espírito Santo de Investimento (BESI)
BESI is the Investment Banking arm of BES, with activities in Portugal, Spain, Brazil and United Kingdom among others. It is 100% controlled by BES. It core businesses are Corporate and Project Finance, Leverage Finance and Equity Capital Markets, it is a sector very linked with the Corporate Banking activity.
Investment banking activity represented 14.5% of BES total net profit before taxes in the first half of 2009, but showed disappointing 30.2% YoY drop. This result was mainly affect due to level of provisions that increased 224%
YoY and operating costs that rose 8.9%. On the other hand banking income had a positive evolution of 7.6% YoY.
The Angolan legislation stipulates that at least 49% of international banks capital must be held by Angolans
PAGE 20/32 BES had to increase its provisions in the foreign activities due to the world economic recession, only in Spain for example, BES made available more 40 million Euros in the first half of 2009.
The BESI results of the first half of 2009, like the results of Investment Banking sector, are not good. The net income shows a 32.2% YoY drop conditioned by a remarkable 305% YoY increase on net provisions and 8.3% YoY rise on
operating costs. Net interest margin actually showed strengthen of 102%, but is not the main core income of BESI, the main return activity is fees and
commissions that showed a 5% YoY rise. The asset level showed no major alterations when comparing July 2009 to July 2008.
Bellow we can observe the evolution since 2005 of the main P&L indicators; and our forecasts. We can see that 2008 represented a break on the expansion of the Bank activity, but with 2009 first half results better on the income side we should expect the next years to be stronger for BESI.
BESIrepresented 10.4% of BES total net profit before taxes on the first half of 2009, against 13.2% on 2008, and 6.6% of total assets on 2009, against 7.1% on 2008. Even thought the importance has declined, BESI still represents a considerable part of the BES Group.
20 40 60 80 100 120 140
2005 2006 2007 2008 2009E 2010F
In
M
il
li
on Eur
os
Graph XVII - BESI main P&L Indicators
Net interest Income Net comissions Operating costs Net Profit
Source: BESI Releases
6% 9% 12% 15% 18%
2005 2006 2007 2008 1H 2009
Graph XVIII - BESI participation on BES total net Income
before Taxes and Total Assets
PAGE 21/32
BESI and BESA Importance
BESI and BESA had together 30% of BES total net income before profits on 2008 and 12% of BES total assets on the same year. Therefore they deserve special attention on our estimations for the bank value. In our model we will use the sum of the parts where BES individual results plus BESA and BESI are the 3 parts of the company.
BES Pension Fund
BES Pension Fund numbers are calculated twice a year. The last numbers of 2009 are the following.
The actuarial differences jumped from 328 million Euros in the middle of
2008 to 971 million Euros at the end of 2008. This was mainly due to a
negative return of the retirement pension fund in 2008 (the fund lost 612 million euros and therefore received 10 times more contributions than in 2007 a total of 434 million euros).
According to previous legislation the values of the outside corridor should be
fully deducted of Core Tier I capital. But the legislation changed and for 2008
only the expected return of the fund should be deducted. In that way the negative impact on core Tier I was of 160 million Euros and not 765 million Euros. This meant a deduction of approximately 27 bp on the Bank Core Tier I in
6% 11% 16% 21% 26% 31%
2005 2006 2007 2008
Graph XIX - BESI + BESA participation on BES total net Income
before Taxes and Total Assets
net income before taxes total assets Source: Bank Release
2.044 2.045
Assets Liabilities
Graph XX - Pension Funds Assets and Liabilities
(in million euros)
Source: Bank release
209 206 204
284
765 718
1H2008 2008 1H2009
Graph XXI - Actuarial Differences
(in million euros)
corridor outside corridor Source: Bank release
328
PAGE 22/32 2008 that ended the year at 5.7%. With previous legislation the impact would be of 120bp, a core Tier I of 4.7%
However this legislation changes progressively and on 2013 this new rule expires. In 2009 the corridor value will be deducted from the expected return of the fund. Therefore using the first half values of 2009: corridor value of 204 million Euros and positive expected return of 62 million Euros, we end up with a deduction on core Tier I capital of 142 million Euros. This deduction means an estimate negative impact of 21 bp, and a estimate core Tier I of 8.4%
In 2010 the deduction on the expected return of the fund will be of 75% of the corridor value, in 2011 of 50% and in 2012 of 25%. In 2013 the rule expires. BES needs to solve its problem with pension funds actuarial difference in the next years, otherwise the bank will probably decrease even more core Tier I levels. In order to meet Portuguese Central Bank requirements BES will
need to raise capital or issue new shares.
Shareholder structure
BES shareholder structure is composed of: 40.0% owned by BESPAR SGPS – a jointly sub holding of Espírito Santo Financial Group (ESFG) and Credit Agricole. ESFG is a holding company based in Luxembourg with participations on BES, Tranquilidade Vida, Tranquilidade Seguros and Espirito Santo Seguros, among others.
10.8% by Credit Agricole – Credit Agricole is a leading company on France in the bank and assurance market
6.1% by Bradesco – Banco Bradesco is the second largest bank on Brazil. BES owns 5.3% of Bradesco’s capital.
2.6% by PT Telecom – through Pension Funds, BES also holds participation on PT.
40.6% by Free Floaters
40,0% 40,6% 10,8%
6,1% 2,6%
Graph XXII - BES Shareholders Structure
BESPAR Free Floaters Credit Agricole Bradesco PT Telecom Source: BES
BES has in the market 1,167 million shares
ESFG and Credit
PAGE 23/32
The Sector
The Banking sector in Portugal is composed mainly by Millenium BCP, Banco
Espírito Santo (BES), Banco Português de Investimento (BPI), Caixa Geral de Depósitos (CGD), and Banco Santander Totta. The first three Banks are listed on Euronext Lisbon and are part of the index PSI-20. CGD is public held and not listed, and Santander Totta is incorporated to a major bank, the Spanish Banco Santander.
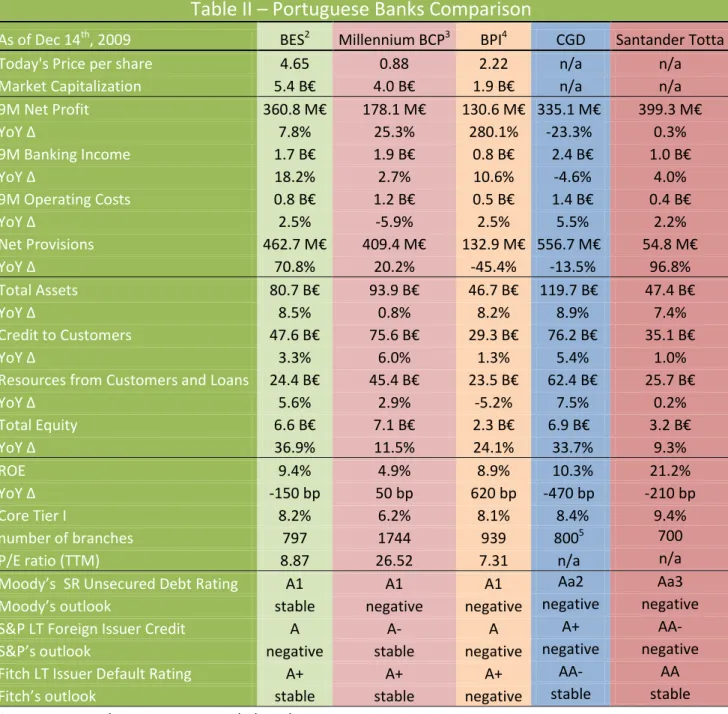
Table II – Portuguese Banks Comparison
As of Dec 14
th, 2009
BES
2Millennium BCP
3BPI
4CGD
Santander Totta
Today's Price per share
4.65
0.88
2.22
n/a
n/a
Market Capitalization
5.4
B€
4.0
B€
1.9 B€
n/a
n/a
9M Net Profit
360.8 M€
178.1 M€
130.6 M€
335.
1 M€
399.3 M€
YoY
Δ
7.8%
25.3%
280.1%
-23.3%
0.3%
9M Banking Income
1.7 B€
1.9 B€
0.8 B€
2.4 B€
1.0 B€
YoY
Δ
18.2%
2.7%
10.6%
-4.6%
4.0%
9M Operating Costs
0.8 B
€
1.2 B
€
0.5 B
€
1.4 B€
0.4 B
€
YoY
Δ
2.5%
-5.9%
2.5%
5.5%
2.2%
Net Provisions
462.7 M€
409.4 M€
132.9 M€
556.7 M€
54.8 M€
YoY
Δ
70.8%
20.2%
-45.4%
-13.5%
96.8%
Total Assets
80.7 B€
93.9 B€
46.7 B€
119.
7 B€
47.4 B€
YoY
Δ
8.5%
0.8%
8.2%
8.9%
7.4%
Credit to Customers
47.6 B€
75.6 B€
29.3 B€
76.2 B€
35.1 B€
YoY
Δ
3.3%
6.0%
1.3%
5.4%
1.0%
Resources from Customers and Loans
24.4 B€
45.4 B€
23.5 B€
62.4 B€
25.7
B€
YoY Δ
5.6%
2.9%
-5.2%
7.5%
0.2%
Total Equity
6.6 B€
7.1 B€
2.3 B€
6.
9 B€
3.2 B€
YoY
Δ
36.9%
11.5%
24.1%
33.7%
9.3%
ROE
9.4%
4.9%
8.9%
10.3%
21.2%
YoY
Δ
-150 bp
50 bp
620 bp
-470 bp
-210 bp
Core Tier I
8.2%
6.2%
8.1%
8.4%
9.4%
number of branches
797
1744
939
800
5700
P/E ratio (TTM)
8.87
26.52
7.31
n/a
n/a
Moody’s SR Unsecured Debt Rating
A1
A1
A1
Aa2
Aa3
Moody’s outlook
stable
negative
negative
negative
negative
S&P LT Foreign Issuer Credit
A
A-
A
A+
AA-
S&P’s outlook
negative
stable
negative
negative
negative
Fitch LT Issuer Default Rating
A+
A+
A+
AA-
AA
Fitch’s outlook
stable
stable
negative
stable
stable
Source: Press Releases, Reuters and Bloomberg
2
Listed on PSI - 20
3
Listed on PSI - 20
4
Listed on PSI - 20
5
PAGE 24/32 Looking at the table above, we can see that BES has the highest market
capitalization, the second highest profit in the first nine months of 2009, and is the third in total assets. BES also has the highest ROE and Core Tier I
Capital of the listed banks.
On the downside, BES had the lowest YoY net profit increase of the listed banks, and is the only of the listed banks to have ROE decreased in 2009. We can also observe that BES has fewer branches than its peers. It can be explained by the fact that BES is more focused on Corporate Bank, than
Retail Bank, therefore it doesn’t need to have a large number of branches.
The high increase of total equity of BES (36.9% YoY) can be explained by the
issuance of new shares on April this year.
In terms of Credit Rating all the PSI-20 banks have similar ratings for all
agencies (the two non-listed banks have higher ratings), being the exception
the Millennium BCP for the Standard and Poor’s perspective, BCP has a lower grade of A- against BES’s and BPI’s higher grade of A. Overall the outlooks seems better to BES, if the changes of the outlook confirms, BES will have the higher grades of default risk against its peers.
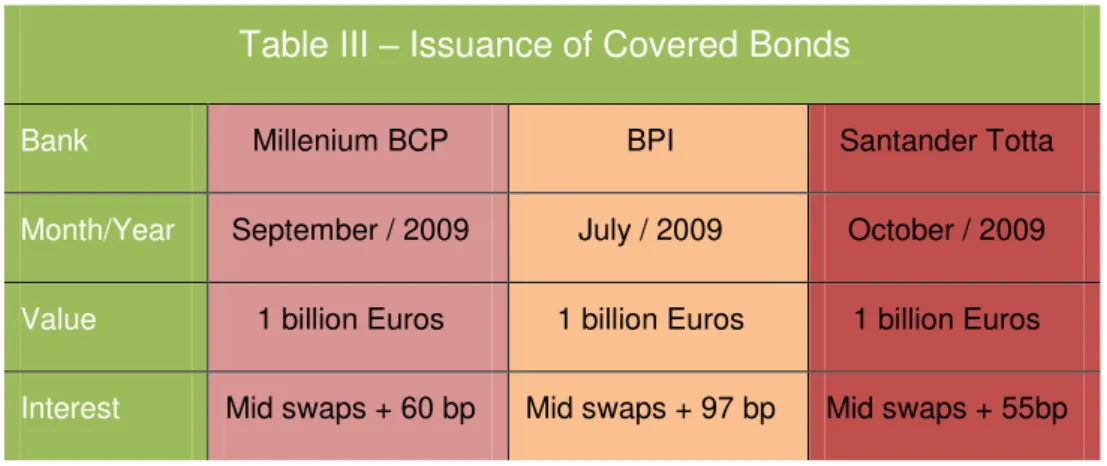
Table III
–
Issuance of Covered Bonds
Bank Millenium BCP BPI Santander Totta
Month/Year September / 2009 July / 2009 October / 2009
Value 1 billion Euros 1 billion Euros 1 billion Euros
Interest Mid swaps + 60 bp Mid swaps + 97 bp Mid swaps + 55bp
BPI high level of net profit increase of 280.1% YoY is mainly the result of financial losses of 177 million Euros due to the selling of BCP participation on 2008. Without these losses and other extraordinary losses, the net profit actually decreases 38.5% YoY.
The high levels of operating costs of BCP also call attention. The level of costs is more than 50% of BES operating costs. But BCP has been able to reduce these levels mainly because of Poland operations. The operating costs of domestic activities dropped 2.4%, and from the international activity plummeted 12.0%.
The highest the Credit Default Rating, the lower the risk, and
consequently the lower the rate a bank can raise funds
Banco Santander Totta has the highest rate overall, since it is backed up by Banco Santander, one of the largest banks in the World
BCP had a lower spread than BPI even though BPI rating is higher than BCP for the Standard &
Poor’s agency.
The better performance of the stock market on September comparing to
July’s can help explain
the better confidence on
PAGE 25/32 In the year over year comparison BCP was able to increase more than its
peers the credit to customers (6.0% YoY), and CGD managed to rise more
its levels of deposits (7.5% YoY).
Overall, analyzing the ROE, the Core Tier I, the net profit, the Banking Income increase, the level of equity and the market capitalization, BES seems to be in a
better position than its peers.
Valuation
The valuation model used on BES is the discounted free cash flow to
shareholders. This model is used instead of discounted free cash flow because banks can produce value from the liability side of the balance sheet. Banks can finance themselves through customer deposits, a quality that other kinds of companies cannot have as they usually have to finance through capital markets.
So a regular discounted free cash flow model would not be able to capture these gains provided by the liability side.
In order to evaluate the Bank the sum of the parts method was used. Being the parts BES SA, BES Angola and BES Investimentos. In 2008, their sum corresponded to 82% of total net profit of BES, and 87% of total equity.
The free cash flow to shareholders is calculated by subtracting from the net profit, plus depreciation and amortization, the required amount to grow the balance sheet (assets minus liabilities is used as a proxy). This amount is the total cash that can be distributed as dividends, although usually this value is not all distributed. Free cash flow to shareholders is then discounted by the cost of equity.
The cost of equity was calculated through the CAPM model. Being the risk
free rate the 10-years German Bund with a yield of 3.21 as of December, 2009. In order to calculate the expected market return, it was used as a proxy the
DAX historic average return since the inception of the index in 1990, the data used was monthly based. The historic return calculated was 7.44%. This provided a market premium of 4.23%. The Beta was calculated as an average
of the betas of the Portuguese listed banks. Each beta was calculated through covariance between the stock returns and the PSI-20 since the beginning of the year. The beta of the sector founded was 1.27, using the same method with the betas provided by Reuters we got 1.21, a 5% difference.
Therefore the cost of equity used in the model is 8.59%. Using the nominal
perpetuity growth rate (G) of 2% we find an enterprise value for the year of 2010 of 6.6 billion Euros, 5.65 Euros per share.
FCF to Shareholders = Net Profit + Amortization
–Δ Assets + Δ Liabilities
Cost of Equity = yield of 10 – years Bund + Beta of the Bank sector (DAX historical return – yield of 10 – years Bund)
Cost of Equity = 8.59% Perpetuity Growth Rate = 2% All the rates in the model are nominal.
BES and BESI values are calculate in Euros
PAGE 26/32
Sensitivity Analysis of Cost of Equity and G
In order to evaluate a Company, two of the most important variables are the
discount rate and the growth rate for the perpetuity. In the Discounted free cash flow to the shareholders model the discount rate is the cost of equity. The cost of equity is a very subjective rate and its value depends among others on the source and the time frequency of the data, and also on the Beta estimation. So it is interesting to see the behaviour of our price target if we had used anther value for the cost of equity. And the perpetuity is so important that it represented in our first estimation 41.17% of the total value of BES.
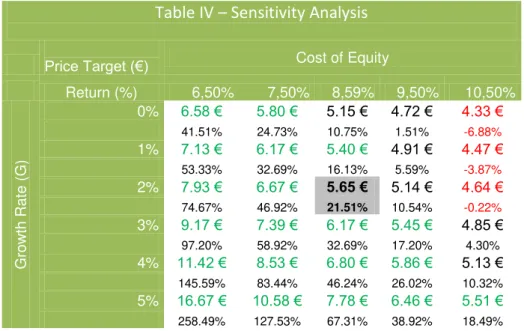
Table IV
–
Sensitivity Analysis
Price Target (€) Cost of Equity
Return (%) 6,50% 7,50% 8,59% 9,50% 10,50%
G
rowth
Rat
e (G
)
0% 6.58 € 5.80 € 5.15 € 4.72 € 4.33 €
41.51% 24.73% 10.75% 1.51% -6.88%
1% 7.13 € 6.17 € 5.40 € 4.91 € 4.47 €
53.33% 32.69% 16.13% 5.59% -3.87%
2% 7.93 € 6.67 € 5.65 € 5.14 € 4.64 €
74.67% 46.92% 21.51% 10.54% -0.22%
3% 9.17 € 7.39 € 6.17 € 5.45 € 4.85 €
97.20% 58.92% 32.69% 17.20% 4.30%
4% 11.42 € 8.53 € 6.80 € 5.86 € 5.13 € 145.59% 83.44% 46.24% 26.02% 10.32%
5% 16.67 € 10.58 € 7.78 € 6.46 € 5.51 € 258.49% 127.53% 67.31% 38.92% 18.49% So analysing the table above, we can observe the following conclusions:
In only three of the cases the recommendation would change to sell (only in the cases we had considered a higher cost of equity), and only in 24% of the cases the recommendation would change to hold.
If we had chosen a cost of equity higher than 9.5%, then most likely our recommendation would be to hold or even to sell.
Although shown on the table above, we should not expected a zero
growth rate as we expect economies to recover on a long term base, and a cost of equity of 200 bp above our estimatives (25% of deviation) is not expected as well.
Therefore selling the stock doesn’t appear to be a good investment
strategy.
Sensitivity Analysis of Spread and Credit to Customer
’
s
As we have seen before, the spread level is the main responsible for a bank’s profit (also fees and commissions plays an important role). BES has been able to increase spreads in the last quarters, even though the interest rates have been The shaded cell is our
estimates.
The green price targets stands for buy recommendation. The black price targets stands for hold recommendation The red price targets stand for sell recommendation
The percentage values means
the return versus today’s share