Determinants of Supply and Demand for Trade Credit by Micro, Small
and Medium-Sized Enterprises
Claudinê Jordão de Carvalho
Universidade Federal de Uberlândia, Faculdade de Gestão e Negócios, Uberlândia, MG, Brazil
Rafael Felipe Schiozer
Fundação Getúlio Vargas, Departamento de Contabilidade, Finanças e Controle, São Paulo, SP, Brazil
Received on 07.31.2014 – Desk acceptance on 08.24.2014 – 2nd version accepted on 12.31.2014
ABSTRACT
This article investigates the determinant factors of supply and demand for trade credit by micro, small and medium-sized enterprises (MSMEs), using data collected in a survey of managers from 481 firms in 32 cities in the states of São Paulo and Minas Gerais (Brazil) between 2008 and 2010. The multivariate relationship model proposed here is grounded in trade credit, agency and transaction costs theories. This study is based on a technique known as path analysis that uses a system of simple regressions estimated by simultaneous equations. The main results show the following: (i) trade credit and short-term bank loans are supplementary (and not substitute) sources of funds for MSMEs, which demonstrates that trade credit can be used by financial institutions as an indicator of the creditworthiness of the company; (ii) the proportion of credit sales, the days sales outstanding measure and sales growth are positively related to the amount of trade credit demanded, which suggests that trade credit is transferred along the supply chain; and (iii) the supply of trade credit is positively related to the importance that management ascribes to both internal capital and bank credit, which illustrates the strategic use of the supply of trade credit to increase sales. These results have important implications for companies’ managers, financial institutions and the government agencies responsible for formulating policies that support and promote the development of small and medium-sized enterprises.
1 INTRODUCTION
Thus, TC might be an indicator of applicant quality, and this information might be used as part of a credit eva-luation by financial institutions (Alphonse, Ducret, & Séverin, 2004). Therefore, TC can operate as a comple-ment to traditional bank loans.
García-Teruel and Martínez-Solano (2010) investiga-ted the determinants of TC by small English firms and demonstrated that larger firms with better access to both internal and external financing at a lower cost require less TC from suppliers and that firms with larger growth opportunities make greater use of TC to fund additio-nal sales volumes. In addition, TC may be used to re-tain strategic customers and/or suppliers (Wilner, 2000). Pike and Cheng (2001) noted that British managers who supply TC are signaling their intentions to maintain a long-term business relationship with a customer. Hill, Kelly and Highfield (2010) show that operational and financial conditions are a determinant of TC supply and demand policy: companies with greater access to ex-ternal financing use these resources to fund the supply of TC, whereas more financially constrained firms use their accounts payable to fund long-term assets.
The literature on short-term corporate finance fe-atures a considerable number of studies on aspects related to both the supply of (Soufani & Poutziouris, 2004; García-Teruel & Martínez-Solano, 2010) and the demand for (Danielson & Scott, 2000; García-Teruel & Martínez-Solano, 2010; Summers & Wilson, 2000; De-loof & Jegers, 1999) credit among firms.
The few studies on TC in Brazil (Saito & Bandeira, 2010; Schiozer & Brando, 2011) are based on data from large companies listed on the Brazilian Stock Exchan-ge. In addition, Sheng, Bortoluzzo, and Santos (2013) use information from companies listed on the stock ex-changes of other Latin American countries.
However, studies of unlisted companies, who most li-kely are more inancially constrained, are scarce. Carvalho and Schiozer (2012) studied short-term inancial mana-gement style in Brazilian MSEs and found evidence that Brazilian managers revise working capital management routines more frequently than UK managers and that the management style of most Brazilian managers focuses on managing payment terms. he cause for this focus may be the high cost of bank loans in Brazil, which demands that companies pay more attention to inancial management. In addition, the study indicated that although Brazilian ma-nagers supply less TC than their UK counterparts, they are more concerned with activities related to the supply of cre-dit to customers. Conversely, there are proportionally more managers focused on inventory and cash management in the UK (Howorth & Westhead, 2003) than in Brazil.
This study expands Carvalho and Schiozer (2012) by investigating the determinant factors of the supply
and demand for TC by MSMEs1. In these
circumstan-Trade credit (TC) is an important financing and in-vestment channel that companies commonly demand and supply to one another. For example, TC is embo-died in a contractual arrangement in which, as part of a transaction, a buyer and a supplier agree that payment may be deferred until a predetermined date following the physical delivery of goods or services. The econo-mics and financial literature highlights the importance of the use of TC among companies. Operations invol-ving TC represent 69% and 52% of the current assets and liabilities, respectively, of Spanish micro and small enterprises (García-Teruel & Martínez-Solano, 2007), 41% of the total debt of medium-sized firms in the Uni-ted Kingdom and 35% in the USA. In Brazil, Carvalho and Schiozer (2012) show that 75% of national micro and small enterprises (MSEs) make more than 50% of their purchases as forward purchases.
In addition, TC continues to have a relevant non--financial role because it can reduce transaction costs (Ferris, 1981), discriminate prices among customers that have different negotiating leverage and solvency conditions (Brennan, Maksimovic, & Zechner, 1988), and promote long-term relationships with customers (Summers & Wilson, 2000). In addition, TC can provide quality assurance when customers cannot evaluate the promised features and benefits of the product in advan-ce (Long, Malitz, & Ravid, 1993).
In this context, Petersen and Rajan (1997) demonstrate that American firms bear an effective opportunity cost of capital of approximately 40% per annum by not using the discount offered for cash payment, while the market for short-term bank loans offers substantially lower interest rates. However, certain shortcomings of the financial market (particularly information asymmetry and transaction and monitoring costs) prevent bank credit from flowing to all companies. Thus, company managers seek working capital from suppliers in the supply chain in which they operate. In this scenario, TC is a resource substitute for bank loans.
Howorth and Wilson (1999) show that the shortco-mings that constrain firms from obtaining bank loans are more common in small enterprises. As a result, a substantial number of these companies have limited ac-cess to bank loans to support their business operations and, in many cases, their long-term investment pro-jects. Information opacity, uncertainties regarding ma-nagement quality, lack of public data on the companies (Ang, Cole & Lin, 2000) and the lack of real guarantees as collateral for loans are the main reasons for the finan-cial industry to consider micro, small and medium-size enterprises (MSMEs) as high-risk borrowers. In light of the foregoing, the more direct operational relationship between suppliers and customers allows the former to monitor the latter at lower cost than it might cost banks.
1 Our criteria considered MSMEs to be those companies with up to 99 employees regardless of the industry in which they operate. The sample is similar to that used by Carvalho and Schiozer (2012), and the only
ces, the core purpose of this study is to investigate the determinants of the supply of and demand for TC by MSMEs. More specifically, the objectives are as follo-ws: (i) to test the hypotheses of complementarity and/ or substitution between TC and external bank loans; (ii) to verify whether the hypothesis of the strategic use of TC in the relationship model proposed by Carvalho and Schiozer (2010) is validated; and (iii) to identify a pos-sible transfer of TC within the supply chain (i.e., to de-termine whether the financing obtained from suppliers is transferred to customers).
This article represents a novel contribution to the li-terature on short-term financial administration because it is the first study that identifies the determinant fac-tors regarding the supply of and demand for TC by MS-MEs in Brazil, using a sample of 481 MSMS-MEs from the states of Minas Gerais and São Paulo. Methodologically,
this study is also innovative with respect to data treat-ment because it uses simultaneous regressions applied to the causal relationships in a path analysis.
The results of this study indicate that the frequency with which bank financing is employed is positively associated with the use of TC as a source of working capital by MSMEs, which supports the hypothesis that TC might act as a complement to bank loans. Conco-mitantly, we find that the proportion of credit sales is a determinant of the demand for TC by MSMEs.
Following this introduction, section 2 of this article presents the theoretical framework of agency, transaction costs and trade credit theories and develops the hypotheses related to the demand for TC. Sections 3 and 4 describe the survey and the variables and methodology used, respecti-vely. he analysis of the results is performed in section 5, and inal considerations are presented in section 6.
2 THEORETICAL CONTEXT AND FORMULATION OF HYPOTHESES
According to the theoretical framework of the mo-del for stages of small business development (Churchill & Lewis, 1983; Dodge & Robbins, 1992), the growth of operations and assets is the core challenge faced by ow-ners of companies in seeking to achieve business suc-cess. Therefore, “sales growth has a direct impact on the amount of working capital required to finance growth in the operational activities of companies” (Etiennot, Preve, & Sarria-Allende, 2012, p. 163). Thus, net opera-ting working capital (NOWC) results from calculaopera-ting the residual value between the supply and demand in credit, plus the investment in inventory.
According to Hill et al. (2010, p. 783): “Net opera-ting working capital captures multiple dimensions of fir-ms’ adjustments to operating and financial conditions”.
Such conditions include sales growth and uncertainty, onerous external financing and the ability of a firm to finance its operating working capital. According to the authors, a firm adopts a conservative working capital policy when the working capital required to support its operations is positive. In this case, the need for additio-nal capital may be financed interadditio-nally by free cash flow or externally by means of commercial paper (seldom used by MSMEs) or lines of credit (Hill, Kelly, & Lo-ckhart, 2012). According to these authors, firms would follow a preferential sequence of funding, following the guiding principles of pecking order theory (Myers & Majluf, 1984). In this adapted version of pecking or-der theory, the firm first uses internally generated fun-ds that are considered to the cheapest capital, then TC, then debt, and finally capital injection by shareholders.
The motivation for growth occurs because managers consider that investment projects with positive net pre-sent values have the potential to generate more future free cash flow. Internally generating significant amounts of cash leads to retained and accumulated profits to support the increase in sales. Within this perspective,
it is expected that expanding operations increases the return on investment of companies. Titman and Wes-sels (1988) show that there is a significant and positive correlation between growth opportunities and internal capital in US firms. The variable chosen to measure the amount of internal capital in this study was ROA – re-turn on assets (profit on total investment). Thus, this association is also expected in the firms that are part of this study sample.
H1A: growth in operations is positively related to the potential to generate free cash.
However, when firms experience rapid growth, the increased level of operations may consume both retai-ned profits and the current free cash flow generated. In such situations involving the depletion of retained pro-fits, the increased level of operations leads to the need to capture additional funds from other sources, such as the institutional credit market. Based on this argument, we formulate the following hypothesis:
H1B: operations growth is positively associated with the frequency with which traditional bank credit lines are used.
to obtain capital from third parties in the institutional credit market.
H2: return on assets is negatively associated with the frequency with which bank loans are used.
Internal capital is the main source of funds to fi-nance corporate investment (Islam & Mozundar, 2007). According to these authors, firms operating in less de-veloped capital markets (including Brazil) tend to place a strong trust in internal funds. Bates, Kahle, and Stulz (2009) corroborate these results by demonstrating a consistent trend of increased cash holdings in US firms. This result is explained by precautionary cash holdings due to the increase in uncertainties regarding compa-nies’ future cash flows. In this case, a firm accumulates a significant stock of available capital to create a liqui-dity cushion to support continuous business growth. A relevant factor in the demand for TC is the financial reputation of the company in honoring its obligations
with suppliers. Thus,an inverse relationship between
accumulated liquidity and late payment to suppliers is considered in hypothesis H3A.
H3A:companies’ level of internal capital has a nega-tive effect on the frequency of payment delays to TC suppliers.
Another valuable aspect of excess liquidity is the possibility that a company might be able to pay for goo-ds in cash. This decision is made based on the trade-off between the costs to maintain liquidity (often with ne-gative net present value) and the returns on capital when exploiting discounts for acquisition of inventory. Bates et al. (2009) state that companies’ decisions to maintain larger cash reserves are justified by the flexibility provi-ded for transactions under situations of uncertainty and credit restrictions. In this case, the firm no longer uses the suppliers’ capital when paying upon delivery of the goods, thus requiring less TC and being rewarded with price advantages compared with their direct competi-tors who are using TC. Based on these arguments, the following association is expected.
H3B: internal capital – ROA – is negatively associated with the demand for TC.
Another use for cash is in transactions inherent in the business. García-Teruel and Martínez-Solano (2010) show significant and positive correlations be-tween free cash flow holdings, growth opportunities and the amount of accounts receivable for companies in the Euro zone. The decision to grow requires increasing investments in projects with the potential for future operating profits. One investment alternative for inter-nal funds is in inventory and customers’ accounts. This decision requires a trade-off between opportunity costs and marginal returns. “However, if it is possible to sell on credit and also to impose a carrying charge on the receivables that are outstanding, then credit sales can actually be more profitable than cash sales” (Brigham & Ehrhardt, 2007, p. 867). Receivables are valuable assets because they can be used as collateral for lines of credit, can generate excess return to shareholders (Hill et al.,
2012), or can be discounted in case of need (Mian & Smith, 1992). Under this perspective, it is expected that available internal capital will be the fuel for increased credit sales.
H3C:internal capital – ROA – is directly related to credit supply to customers.
Credit institutions are another determinant factor for TC demand and supply. However, traditional bank credit lines are not always available to MSMEs. In this scenario, funds from business partners in the supply chain may be a financing alternative to minimize the frictions resulting from limited access to bank loans.
However, young and small firms such as MSMEs have a little reputational history and minimum econo-mic and financial disclosure, which may explain why it is difficult for them to obtain loans in the traditional credit market (Petersen & Rajan, 1994). There is evi-dence that the MSMEs’ degree of access to bank loans is heterogeneous and that banks – and not TC suppliers – are the main source of third-party capital to small firms. Consistent with this argument, Cole, Wolken, and Woo-dburn (1996) report that more than 60% of the loans to small US firms are made by banks.
In this scenario, it is expected that firms with more access to bank loans are those with lower credit risk; because they have more liquidity, they are also more likely to pay their suppliers on time. Moreover, addi-tional funds from revenue growth may be required to ensure the necessary liquidity and, in a scenario invol-ving insufficient internal cash to pay suppliers becau-se of the increabecau-sed demand for funds resulting from operations growth, the firm may delay its payments to suppliers. Under this condition, bank loans can be used by firms to pay their debts to suppliers. A nega-tive association is expected between the frequency of bank loans and the default rate of MSMEs with their suppliers. Thus, based on this argument, we formulate the following hypothesis:
H4A: there is a negative association between the fre-quency of the use of bank loans and late payments to suppliers.
Revenue growth typically affects firms’ needs for net working capital. In this case, the purchase of goods must be increased to meet desired sales levels. Therefore, the firm may demand an increase in goods’ financing by su-ppliers (through more TC) and expanded bank lines of credit for investment in receivables and/or inventory. In other words, if the cash conversion cycle is positive and if the values of its components (days sales outstanding, days payables outstanding and days inventory outstan-ding) are maintained as constant, the higher the sales volume is, the larger the need for funds to finance the incremental investment in accounts receivable and in-ventory.
works as an indicator of a firm’s credit quality and facili-tates access to bank loans. These results showing the use of TC as an additional financing source are consistent with the findings of Matias (2006) for Portuguese and Spanish MSMEs. However, it is not clear in the litera-ture whether the inverse relationship is valid. We tried to overcome this gap by analyzing the impact of the fre-quency of use of external bank loans on the demand for TC by firms.
Atanasova (2012) found strong evidence that TC facilitates access to conventional bank loans for firms that have high agency costs. This result corroborates the study by Alphonse et al. (2004), and the evidence is also consistent with theories based on the indicator role of TC supply and on the advantages of suppliers liquida-ting product.
In addition, TC is positively associated with the avai-lability of credit lines (Petersen & Rajan, 1997) and is an important financing source that complements bank lo-ans (Cole, 2013). Under these conditions, firms begin to rely on external financing sources to invest in receiva-bles and inventory resulting from growing operations. However, the empirical results in the literature on the relationship between TC use and bank credit are incon-sistent. Thus, we attempted to clarify this relationship in this study.
The relationship between the frequency of use of external lines of credit and the demand for TC can be either positive or negative in hypothesis H4B.
H4B: demand for TC is (is positively and/or negati-vely) associated with the more frequent use of external credit lines.
Petersen and Rajan (1997) and García-Teruel and Martínez-Solano (2010) found evidence that firms with more access to credit institutions (i.e., greater ability to obtain funds more frequently) supply more credit to their customers. These results corroborate the idea proposed by Meltzer (1960) that firms with greater ac-cess to the banking system can obtain more loans and transfer them to their customers with little access to the financial market. In this theoretical context, firms with more access to credit lines act as financial inter-mediaries for customers with financial constraints by supplying short-term TC. In addition, a larger supply of credit is useful to support the growth of credit sales.
However, a substantial number of MSMEs are per-ceived as high-risk firms by credit institutions because of issues involving information asymmetry and agency costs. In this scenario, companies with financial cons-traints and difficulties accessing banks may face credit restrictions when attempting to increase their supply of credit sales to customers and their investment in inven-tory. Consistent with this reasoning, Molina and Pre-ve (2009) found evidence that companies experiencing financial difficulties give less TC to their customers. Thus, we expect a direct relationship between the fre-quency of use of lines of credit and the supply of credit to customers.
H4C: a higher frequency in the use of traditional bank lines of credit positively affects the proportion of credit sales.
If sales growth affects the amount of credit purcha-ses, the company may adopt a conservative policy of investing in goods and/or products to avoid the loss of revenue due to lack of inventory. Based on this decision, product turnover may be lower than planned and ope-rating cash flow may be insufficient to pay suppliers, le-ading the firm to default on its debt obligations. Howor-th and Reber (2003) and Carvalho and Schiozer (2012) found that, on average, nearly 80% of UK and Brazilian MSMEs delayed payments to suppliers. The following theories may explain the reason why firms might not paying their suppliers on time: lack of cash liquidity (Ebben & Johnson, 2010), bad financial practices (Paul & Boden, 2011), demand for additional funds (Howorth & Reber, 2003) and higher market power of the buyer compared with the seller, which generates little incen-tive for a buyer to pay its bills on time (Wilson, 2008).
Boissay and Gropp (2007) investigated the behavior of small French companies regarding late payment to suppliers and did not find significant evidence of reta-liation by suppliers. In other words, there is tolerance of customers (buyers) that do not honor the obligation to pay on time. With this lack of liquidity, it can be expec-ted that firms that delay their payments demand more TC from their suppliers because of the trust and busi-ness relationship built over time.
In these situations, the possibility of renegotiating overdue debts results in the opportunity to resume the supply of goods through TC. In addition, Pike and Cheng (2001) found evidence that companies that delay payments to suppliers more frequently do so because their cash cycle is long – the days payable outstanding to suppliers may be shorter than the days sales outstan-ding of customers. Therefore, the longer the days paya-ble outstanding to suppliers, the smaller the likelihood of delay in TC payments (considering that the days in-ventory outstanding and days sales outstanding are kept constant), which would enable the company to generate a liquidity cushion to honor its commitments in case of external liquidity shocks. Based on this reasoning, we propose the following hypothesis:
H5: there is a positive relationship between the fre-quency of late payment to suppliers and the proportion of credit purchases.
The ratio between credit purchases and total purcha-ses (which proxies for the required amount of TC) and the total assets may be indirectly associated with sales growth and directly associated with average payment terms received from suppliers and offered to customers (Peel, Wilson, & Howorth, 2000).
sup-ply more TC because they have more assets with which to guarantee bank loans (collateral), which means that it is easier for these firms to access external financing (Soufani & Poutzouris, 2004). In this scenario, payment terms offered to customers and conditions and policies of TC supply and demand are critical to firms with little access to credit institutions that want to increase their sales.
In addition, Shi, Yang, and Zhou (2011) offer evi-dence that there is a transfer mechanism for payment terms received from suppliers and offered to customers; in other words, the days payable outstanding to sup-pliers is used as a benchmark to define payment terms of credit sales to customers. In this scenario, extending payment terms to customers must act as an incentive for revenue growth through credit sales. This decision considers the trade-off between the benefits of incre-mental revenue and the opportunity costs of investing in accounts receivable. Thus, a direct relationship is ex-pected between the proportion of credit sales and to-tal sales and the days sales outstanding. Based on these arguments, we formulate hypotheses H6A, H6B andH6C, respectively:
H6A: the proportion of credit sales is directly related to the average payment terms offered to customers.
In addition to the hypotheses of cash liquidity and its strategic use to increase credit sales, TC demand (the proportion of credit purchases relative to total purcha-ses) may be directly affected by the proportion of credit sales to customers (Pike & Cheng, 2001).
H6B: the proportion of credit sales is positively asso-ciated with the proportion of credit purchases.
If the firm has a liberal and aggressive policy of credit concession to increase credit sales and market share, there is an increased risk of overdue receivables and defaults. In this scenario, we expect an inverse re-lationship between the credit supply effort and custo-mers’ timeliness.
H6C: the proportion of credit sales negatively affects the level of overdue accounts receivable.
The investment in accounts receivable is one of the most important investments (García-Teruel & Martí-nez-Solano, 2010) based on its share in the total assets of firms. However, the risk of late payment by custo-mers, default and losses is substantial. Howorth and Re-ber (2003) posit that 53.44% of UK customers typically pay suppliers after the agreed-upon date of payment. This event may negatively affect the firm’s cash flow by affecting its current liquidity and transferring this situ-ation to other partners in the supply chain. Thus, in this case, it is expected that firms whose customers have low levels of timeliness demand more financing from sup-pliers to balance their cash cycle. Thus, we propose that: H7A: timely payment of accounts receivable has a ne-gative influence on the demand for TC.
However, customers’ default of obligations may be-come a profitable transaction for the vendor firm. If the firm has cash availability, the eventual untimely
payment of accounts receivables may generate income higher than the operating profit of credit sales, which increases the firm’s internal capital because of the col-lection of already established penalties in Brazil for late payments (penalty fee plus default interests). A recent survey by the authors of this study in MSMEs in the sta-tes of São Paulo and Minas Gerais indicasta-tes penalty fees as a result of overdue payments in the range of 72% to 480% per annum. Based on this argument, we propose the following hypothesis:
H7B: the timely payment of accounts receivable is po-sitively related to internal capital.
Hill et al. (2010) postulate that the market power of the firm positively affects management of required working capital. According to these authors, market power is the ability of the firm to negotiate bilaterally with customers and suppliers. In this scenario, the ex-tension of TC terms (longer average payment terms to suppliers) and the reduction of inventory levels may be directly related to the buyer’s market power. In other words, if the firm obtains more generous terms from its suppliers at no additional cost, it can use this benefit strategically to increase its market power with its consu-mers by offering longer payment terms to them.
This hypothesis of transfer of terms is consistent with the evidence found by Shi et al. (2011). Accor-ding to this rationale, the firm might need to increase its credit purchases to meet the likely increase of sales resulting from favorable terms. We expect a direct rela-tionship between the average payment terms of credit sales and the volume of credit purchases.
Based on the argument above, we propose the follo-wing hypothesis:
H8: the average payment term ofered to customers is positively associated with the volume of credit purchases.
2.1 Theoretical model and tests of the
hypotheses.
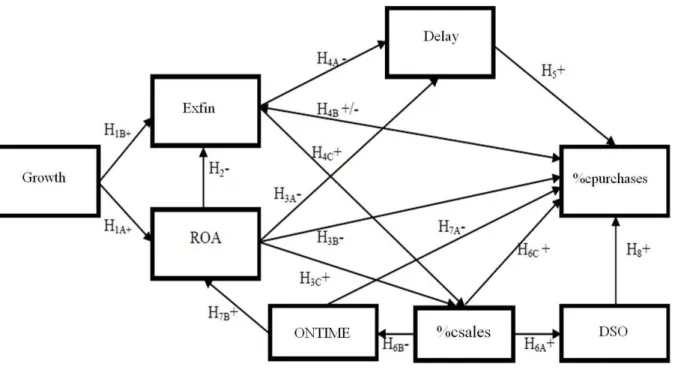
Figure 1 shows the diagram of relationships among the variables of the theoretical model proposed in this study and the expected direction of the hypotheses.
Considering the study design, the objectives and the hypotheses discussed in the previous section, this study adopts the path analysis technique, which is a particular case of the structural equation model (SEM), to empi-rically assess the correlations between the variables ob-served in the optimal model. This data treatment me-thod was selected due to the existence of dependence (or mediation) relationships among the independent variables that affect the dependent variable(s), a situa-tion in which there may be a problem of multicollinea-rity and indirect effects on the predicted variable.
(2009) argue that regression analysis does not control for measuring errors of scale and addresses one depen-dent variable at a time. In turn, SEM not only controls
for measuring errors of scale, but it is also suitable for addressing more than one dependent variable, such as in the case of the model idealized for this study.
he path analysis, also known as a causal model (or efect model, not necessarily of causality), focuses on evaluating the plausibility of models consisting of a ne-twork of relationships between measured variables. It is particularly useful to explore hypothetical models for-med by complex interrelationships between indicator variables and theoretical constructs. According to Hair, Anderson, Tatham and Black (2005, p. 466), path analy-sis “is an approach that employs simple bivariate corre-lations to estimate recorre-lationships in a SEM model” in a si-multaneous manner. As with any statistical method, path analysis depends fundamentally on a theoretical model behind the hypothetical relationships, and the causal in-terpretation of the associations found must be supported by the theory.
he seminal work by Titman and Wessels (1988) on the determinants of capital structure was the irst to use SEM in inance. hese authors proposed the use of SEM as a strategy to overcome problems of regression analysis associated with estimating parameters when proxies for non-observable theoretical attributes are used in the study. Ater that, other studies in inance also adopted this statis-tical technique, such as: Maddala and Nimalendran (1995), Örtqvis, Masli, Rahman, and Selvarajah (2006), Chang et al. (2009), Yang, Lee, Gu, and Lee (2010) and Carvalho and Schiozer (2011). As suggested in previous sections, this stu-dy uses measures of perception and opinions of managers and employs scales to measure non-observable variables. We believe that the decision to use the SEM is consistent with the nature of the problem of interest.
3 DATA COLLECTION AND SAMPLING PROCEDURES
The data used in this study were collected using a cross-section survey that allowed for the capture of de-mographic information and data on companies’ opera-tional and financial practices and policies. According to Taylor-Powell and Hermann (2000), the use of the sur-vey method is recommended when some aspects cannot
be observed directly or when it is impossible or imprac-tical for the researcher to observe the study object direc-tly. When the study objects are small and medium-sized companies, financial and management information is not publicly available, and the survey method has been largely used in such situations in the finance literature. Figure 1 Diagram of relationship and direction of the study hypotheses
Bakerm, Singleton and Veit (2011) documented the wide use of surveys in research on corporate finance whose results were published in English-language journals.
However, survey-based studies are subject to limita-tions, such as potential bias of: (i) non-respondents; (ii) acquiescence; (iii) straight-lining; and (iv) socially de-sired responses. In addition, questionnaires structured in a certain country require special attention from the researcher regarding their validation, translation and inferences obtained from the scale applied in different markets. Balbinotti, Benetti, and Terra (2006) call the attention of researchers to the use of questionnaires with respect to their replication in studies involving different cultures and propose a methodology that is adequate for a translation consistent with the theoretical dimensions intended for the original data collection instrument.
3.1 Data collection and sampling instrument.
he data collection instrument was a questionnai-re that contained items on working capital management practices that was composed of theoretical elements of operational, inancial and economic management of the irms, in addition to demographic data that were measu-red in ratio or ordinal scales and adapted from Howorth and Westhead (2003) and translated into Portuguese2. he questions in the questionnaires are consistent with the theoretical nature of the measured variable, as shown in Table 1. he pre-test of the data collection instrument was performed with eight managers of MSMEs. his proce-dure enabled us to adjust the questionnaire’s inal model by considering the speciicities of the local market. he questions in the questionnaires are shown in the Appen-dix. Data collection was performed by trained surveyors. The data of the questionnaires were collected at three different time-points: the first two in each half of 2008 and the third in the second half of 2010. Carvalho and
Schiozer (2012) note that the difference between data collection time-points does not introduce any relevant bias in this case because management practices are rea-sonably stable over time.
he units of analysis in this study were MSMEs located in the states of Minas Gerais and São Paulo that agreed to participate in the survey. he respondents were managing owners and/or manager of the companies because these people are expected to have the main inancial and stra-tegic information and the best perception of the manage-ment practices established in these companies. According to Marconi and Lakatos (2003), direct contact is establi-shed with people that possibly have knowledge regarding the data and information sought by the researcher. In this study, the managers of the irms in the sample were acces-sed according to the interviewer’s convenience.
he data collection was performed at companies loca-ted in 32 cities in the states of São Paulo (22) and Minas Ge-rais (10), the two largest Brazilian states in terms of Gross Domestic Product (GDP) (Instituto Brasileiro de Geograia e Estatística - IBGE, 2011). At the end of the data collection stage, we had obtained an exclusive and unique database from a sample of 481 irms (347 in Minas Gerais and 134 in São Paulo)3, all non-inancial and privately owned, of dife-rent sizes, not listed on the stock exchange and operating in a variety of industries, including manufacturing, services, civil construction, retail and distribution.
3.2 Variables.
The literature on TC indicates the use of a series of proxies involving the demand for TC, including the ratio between accounts payable/current liabilities, the ratio between accounts payable/total liabilities (Rodrí-guez-Rodríguez, 2006) and the accounts payable on the balance sheet (García-Teruel & Martínez-Solano, 2010).
Table 1 summarizes the variables used in this study.
2 A detailed description of the questionnaire, collection procedure and statistics of the responses can be found in Carvalho and Schiozer (2012).
3 There are more irms from the state of Minas Gerais in the sample because there were more surveyors available in that state because of logistical and inancial reasons. 4 Credit lines are: overdraft protection, check or invoice discounting, working capital loans, leasing and BNDES.
Variables Code Interpretation Measurement scale Reference literature
Days sales outstanding DSO Average term provided by the company for credit sales.
Continuous Pike and Cheng (2001); Deloof (2003); García-Teruel and Martínez-Solano (2010); Shi, Yang, and Zhou (2011).
Growth GROWTH
Importance of sales growth in the past three years.
Ordinal: 1 = not important to 9 = very important
Petersen and Rajan (1994); Deloof (2003); García-Teruel and Martínez-Solano (2010); Howorth and Westhead (2003).
Credit purchases %CPURCHASES Average proportion of credit purchases in the past three years.
Percentage of purchases (1 – 100)
García-Teruel and Martínez-Solano (2010).
Late payments LATE Frequency of late payments to suppliers.
Ordinal: 1 = never to 9 = very frequent
Petersen and Rajan (1994); Peel, Wilson, and Howorth (2000); Bastos and Pindado (2007); Howorth and Westhead (2003).
External inancing4 EXFIN Frequency of use of external inancing in the past three years.
Ordinal: 5 = never used any of the ive sources to 25 = very frequent use
Petersen and Rajan (1994); Atanasova (2012); Deloof (2003); García-Teruel and Martínez-Solano (2010); Howorth and Westhead (2003).
Timely payments of receivables
ONTIME Average proportion of accounts receivable paid on time in the past three years.
Percentage of accounts receivable paid on time (0-100)
Petersen and Rajan (1994); Peel, Wilson, and Howorth (2000); Howorth and Westhead (2003).
Internal inancing generated by the operation of the irms
ROA Average proportion between proits and total assets in the past three years.
Percentage of return García-Teruel and Martínez-Solano (2010).
The proxy chosen to capture the demand for TC from suppliers is the proportion of credit purchases re-lative to total purchases (%cpurchases) previously used by Shi et al. (2011). We understand that it is a measure better than those discussed above because it is obtai-ned directly from the managers using question 6 of the questionnaire (see Appendix) and does not depend on balance sheets that may reflect a static and momentary situation. In addition, this question does not generate resistance or suspicion from the respondents because it does not make refer to confidential financial informa-tion of the firms.
The other variables listed below were also answered directly by the interviewees.
Days sales outstanding (dso, measured in days) is a strong driver for sales growth. The credit concession policy influences the financial structure of firms, consi-dering that the longer the payment term, the larger the need for investment in accounts receivable. If the inter-nal cash generation capability is not sufficient to finan-ce the sales growth, the company must search for addi-tional financing through TC from suppliers or through the banking system, in the event that approved credit is available. This information is obtained from question 7.b of the questionnaire (see Appendix).
Growth (growth, scale of 1-9) was measured accor-ding to the manager’s perception of the importance of historical sales on the size of the firm. According to the fundamentals of the theories of growth stages, of finan-cing of working capital needs (Ettienot, Preve, & Sarria--Allende, 2012) and the theory of resources, the growth path of the firms may induce managers to adopt con-sistent control, financial strategies and sales strategies to support these dynamics. This variable was measured by an ordinal scale of importance and obtained from question 4 of the questionnaire.
Proportion of late payments to suppliers (late, scale 1 to 9): this variable indicates the unilateral extension of the terms of trade credit received from suppliers and is an indicator of the level of default of the firm with its suppliers. The variable measures the average proportion of overdue accounts payable relative to total accounts payable. Historical behavior may affect the firm’s credit reputation with the supplier. In addition, increasing the values paid as default penalties increases financial ex-penses and reduces firm profitability. This variable may be connected to low levels of payment timeliness by customers, which establishes a transfer channel of late
payments along the supply chain. It is obtained from question 8 of the questionnaire.
External financing (Exfin, ordinal scale of 5 to 25) is the proxy chosen to capture the use of debt and finan-cial leveraging and was measured as the frequency of use of the main bank lines of credit available for MSMEs in Brazil. This variable is relevant because both theore-tical and empirical literature on trade credit indicate the hypothesis of complementarity and substitution of the two sources of funds. The variable was obtained from question 5 of the questionnaire.
Timely payment of receivables (ontime, % from 0 to 100) indicates the risk of the investment in accounts receivable of the firms and measures the historical pro-portion of receivables paid on time relative to total re-ceivables from credit sales. A larger proportion reduces the uncertainty of cash inflows and may indicate a pru-dent policy of credit concession to customers. Conver-sely, a liberal policy of credit concession may result in loss of receivables. Question 10 of the collection instru-ment captured this parameter.
Internal financing generated by the firms’ operation (ROA, %) is part of the literature on short-term finance reports that internal capital is the main source of invest-ment funds for firms with little access to credit institu-tions. An attitude of this variable is that it controls for the business’s economic performance by the value of the investment. Companies with high amounts of internal capital may use it both to increase the credit supply and to reduce the demand for bank and/or trade financing. Question 11 of the questionnaire recorded this variable.
3.3 Internal and external validity.
According to Baker et al. (2011, p.27), the validity of answers in surveys “refers to the degree to which a study accurately reflects or assesses the specific concept that the researcher wants to measure”. The external validity indicates the extent to which the results of a study can be generalized, while the internal validity refers to the accuracy with which the surveyor performed the study. The size of the sample (481 respondents), the geographic dispersion of the companies (States of Minas Gerais and São Paulo), the number of cities (32) and the diversity of industries in which the companies operate (46, according to the National Classification of Economic Activities of IBGE) are relevant parameters of this study. All this provides a good external validity potential to evaluate the generalization of the results.
4 METHODS
After performing the data exploratory analysis, che-cking for missing data and inspecting for outliers, the descriptive statistics were prepared to summarize the profile and distribution behavior of the collected data and the correlation matrix between dependent and
1. Because each regression equation represents the cause (or the effect) of one or more variables on one another and its influence is indicated by arrows, each equation can be conceived of as a summary of the impact of all the relevant variables observed in the model on a specific variable, in the case of this study, %cpurchases.
The specification of the linear regression equations that comprise the model is as follows:
(1) %cpurchases = b11dso + b12%csales + b13exfin +
b14late + b15ontime + b16roa + e%cpurchases (2) exfin = b21growth + b22roa + eexfin (3) roa = b31growth + b32ontime + eroa (4) %csales = b41exfin+ b42roa +e%csales (5) late = b51exfin + b52roa + elate,
(6) ontime = b61%csales+eontime
(7) dso=b71%csales + edso
Where the variables e%cpurchases, eexin, eroa, e%csales, elate, eontime and edso are the errors each regression equation of the model.
he test of multivariate normality of the variable data was applied to evaluate both the symmetry and kurtosis in-dices (Mardia’s coeicient), and there is no statistical sup-port to reject the null hypothesis of multivariate normality. he adequacy of the model estimates for the empirical data was evaluated through the chi-square statistic measure and the goodness-of-it measures suggested by the literature on SEM (NFI; CFI; PCFI; RMSEA) and generated by compa-ring the correlation matrices of the model with those of the collected database. he regressions were estimated using the SSPSS v.18 and AMOS statistical sotware.
5 RESULTS
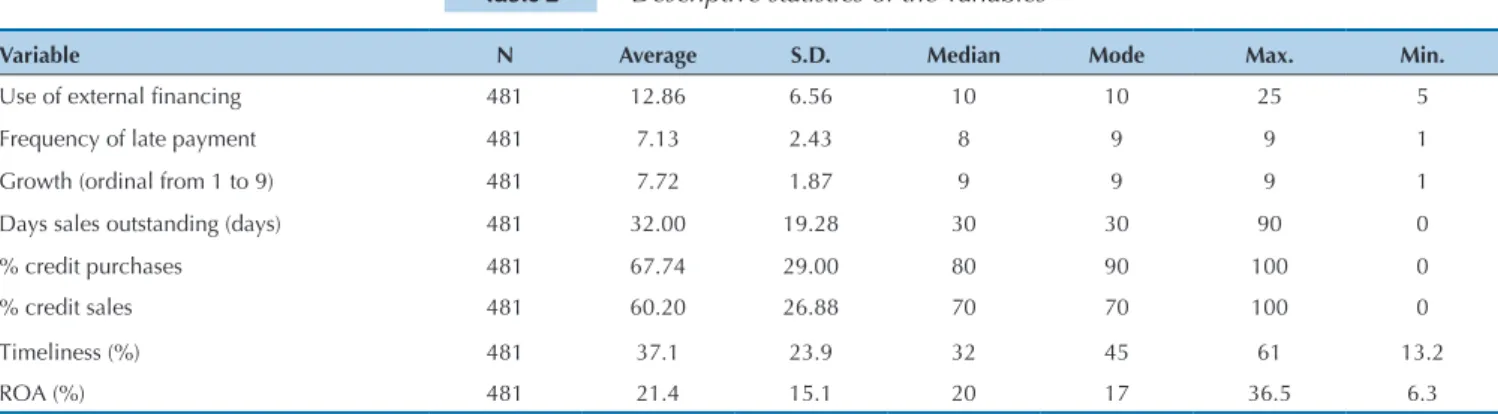
he descriptive statistics of the variables in this study obtained from the responses of the managers are recorded in Table 2.
he data on the frequency of the use of bank loans (Exin)
Bank credit lines are mostly short-term because they finance operating capital. Typical payment terms in the sample are 30 days (median and mode), for both ac-counts receivable and payable. The use of trade credit
– measured as the proportion of credit purchases relati-ve to total purchases – is high among the companies in the sample. The average percentage of credit purchases was 67.74%. Most firms seek TC from suppliers (80% or more of total purchases), which reveals high trust from business partners to continuously supply credit. Despite this trust, most firms also reveal late payments to sup-pliers.
The Pearson and Spearmann correlations between the variables are transcribed in the following paragraph.
Table 3 shows that the correlation between the percentage of credit purchases and the days sales
and on days that sales were outstanding show distributions with positive asymmetries as well as a wide dispersion of values. hese statistics relect the large variability of the sample regar-ding inancial leverage and payment terms ofered customers.
outstanding is positive and significant (p-value < 0.01). In other words, the offer of longer payment terms stimulates sales growth and, consequently, the amount of credit purchases to support that expansion (although the correlation analysis does not confirm a cause-and-effect relationship). This can be explained by the redistributive role of trade credit demanded from suppliers (Ogawa, Sterken, & Tokutsu, 2011); in other words, the longer the payment terms to suppliers, the longer the payment terms from customers and the larger the credit sales amounts and the need for external financing. These associations are positive and significant at less than 1%. The evidence indicates the non-rejection of the hypothesis of the complementarity of trade credit and corroborates the findings of Ogawa, Sterken, and Tokutsu (2011).
Variable N Average S.D. Median Mode Max. Min.
Use of external inancing 481 12.86 6.56 10 10 25 5
Frequency of late payment 481 7.13 2.43 8 9 9 1
Growth (ordinal from 1 to 9) 481 7.72 1.87 9 9 9 1
Days sales outstanding (days) 481 32.00 19.28 30 30 90 0
% credit purchases 481 67.74 29.00 80 90 100 0
% credit sales 481 60.20 26.88 70 70 100 0
Timeliness (%) 481 37.1 23.9 32 45 61 13.2
ROA (%) 481 21.4 15.1 20 17 36.5 6.3
Source: Prepared by the authors from the responses of the managers in the sample.
There is evidence (p-value < 5%) that historical sales growth is directly related to the frequent use of short--term bank loans. In addition, companies that less fre-quently resort to late payments seem to access the tra-ditional loan market more frequently (p-value < 0.01).
5.1 Measurement model.
According to Byrne (2001) and Hair et al. (2005), the overall goodness-of-fit of the estimated model must be determined through a set of measurements. Some of the fit statistics are shown in Table 4. The model ex-plains 74.18% of the variance of the data regarding TC demand and supply (%cpurchases; %csales).
he it indicator is within the conservative interval of 1.0 to 2.0, when evaluated by the statistical ratio chi-square/de-grees of freedom (Hair, Anderson, Tatham, & Black, 2005). However, these statistics may be inluenced by the size of the sample (481 companies); therefore, we must evaluate whether other additional it measures are at an acceptable level. he incremental normalized it index (NFI) of 0.93, which is slightly higher than the recommended level by Hair et al. (2005) of 0.90, indicates a good it of the model.
The Root Mean Square Error of Approximation (RMSEA) is lower than 5%, as suggested by Hair et al. (2005), and the upper limit of the confidence interval does not exceed 0.10 (Kline, 2011).
The joint evaluation of the indices shows that the results are a good representation of the proposed mo-del. After analyzing the fit of the model to the empirical data, the next section addresses testing the hypotheses developed in the theoretical context. The plausibility of alternative relationship models was tested; however, the results show that the fit indices are poor when compa-red to the optimal model.
5.2 Analysis of the proposed hypotheses.
The results obtained in the statistical tests with the
expected relationships were analyzed based on the pro-posed model. Table 5 summarizes the expected and ob-served signs with their respective p-values. The results of the tests of hypotheses of the path diagram show that the indicators of internally generated capital, frequency of use of external financing sources (Exfin), level of late payments and the proportion of credit sales relative to total sales (%csales) are determinant factors in the de-mand for trade credit by the MSMEs in the sample. The supply is conditioned by cash generation and by the fre-quency of the use of loans.
Table 3 Correlation between variables
%cpurchases DSO %csales Exin Growth Late Ontime ROA
%cpurchases 1
DSO .18*** 1
%csales .29*** .23*** 1
EXFIN .21*** .10** .21** 1
Growth .05 .03 -.01 .10** 1
Late -.03 -.07 -.03 -.17*** .05 1
Ontime -.17*** .09 -.36*** -.02 .12** -.06 1
ROA -.41*** .13** .37*** -.12** .28*** -.26** -.32*** 1
Note: *** 0.01 significance, ** 0.05 significance, and * 0.1 significance.
Indices Value
Chi-square 37
Degrees of freedom 21
Level of probability 0.10
Chi-square / Degrees of freedom 0.81
Normalized it index (NFI) 0.93
Comparative it index (CFI) 0.97
RMSEA 0.03
RMSEA (lower limit- 90%) 0.00
RMSEA (upper limit - 90%) 0.06
The results of the direct and significant relationship (p-value < 1%) between Exfin, ROA and %cpurchases provides evidence that supports the hypothesis of the theory of the use of TC as a complement (not a substitu-te) of bank loans and the accumulated operating profits of the firm.
The hypothesis of the strategic use of TC as an incentive to credit sales might not be rejected either (p-value < 1%). The higher the volume of credit sales in the MSMEs of this sample, the higher the credit purchases and the days sales outstanding by customers. This result is explained by the theory of redistribution of both the received trade capital and bank loans as well as the average payment terms provided by suppliers to fund customers’ credit sales. These results corroborate the findings of Pike and Cheng (2001) and Shi et al. (2011). Thus, the TC obtained from suppliers and the loans from credit institutions are transferred to customers of the firms.
The frequency of use of bank loans and the cumula-tive level of own funds are inversely related to the fre-quency of late payments. In other words, firms that rou-tinely pay their suppliers late are considered high risk by credit institutions, so it is possible that they have less access to traditional short-term bank loans. This result is consistent with the theoretical fundamentals of agency theory (Jensen & Meckling, 1976) and with the assump-tions of liquidity theory (Bastos & Pindado, 2007) that indicate that the firm will have more access to comple-mentary bank financing sources because of its good per-formance regarding timely payment to suppliers.
The timeliness of the portfolio of accounts receiva-ble has significant effects on TC and on the business’ internal capital. The results show an inverse relationship between customers’ default and demand for TC. By con-trast, late payment of accounts payable brings monetary benefits to the generation of the company’s own capital.
This evidence can be explained by the theory of the tran-saction costs of the agent-principal of trade contracts.
Finally, to assess the robustness of the proposed mo-del, the model was tested exclusively in the purely re-tail firms in the sample (108 companies), considering that these firms sell much less to corporate customers than manufacturing and service firms and, therefore, credit sales do not typically represent actual TC. The evidence (results unreported) shows that the direct and indirect effects previously observed for the hypotheses that include the variables “credit sales” (%csales) and days sales outstanding ( dso)- (hypotheses H4C, H6A and H6C) disappear, while the other results are maintained, although with less statistical significance.
5.3 Managerial implications.
The empirical evidence revealed in this study may be useful for managers, financial institutions, suppliers, funding agencies and agencies that develop public po-licies to strengthen MSMEs. The results enable these companies’ managers to better understand the effects of external shocks, such as increased demand, on the need for additional financing to support the expansion of operations to earn financial capacity and change size. For institutions that operate in less developed financial markets, the model corroborates the hypothesis that TC from suppliers is an important source of loans to firms that have little access to credit institutions, and that le-vels of late payment to suppliers are a relevant indicator to be discussed in the credit concession process.
In addition, the proposal of a policy of institutional credit to MSMEs (for example, exemption of payment of the Tax on Financial Operations (Imposto sobre Operações Financeiras - IOF) for working capital lo-ans to small companies) can be an important strategy of incentivizing growth through credit sales. However, suppliers also compete with credit institutions that lend Hypotheses Analyzed relationship Expected sign Estimate of the coeficients p-value Results
H1A Growth→ROA + + 0.29 0.001 Supported
H1B Growth→Exin + + 0.10 0.05 Supported
H2 ROA→Exin - - 0.14 0.05 Supported
H3A ROA→LATE - - 0.32 0.05 Supported
H3B ROA→%cpurchases - - 0.45 0.001 Supported
H3C ROA→%csales + + 0.41 0.001 Supported
H4A Exin→ Late - - 0.19 0.001 Supported
H4B Exin→ %cpurchases +/- + 0.22 0.000 Supported
H4C Exin→ %csales + + 0.22 0.05 Supported
H5 Late→%cpurchases + + 0.14 0.025 Supported
H6A %csales→DSO + + 0.25 0.001 Supported
H6B %vsales→Ontime - - 0.39 0.001 Supported
H6C %csales→%cpurchases + + 0.22 0.001 Supported
H7A Ontime→%cpurchases - - 0.21 0.001 Supported
H7B Ontime→ROA + - 0.35 0.001 Supported
H8 DSO → %cpurchases + + 0.04 0.899 Not Supported
capital in the form of goods and services, to obtain re-venue. In this scenario, MSMEs managers that seek to ensure business continuity and expansion need more
capital to finance the incremental investment in recei-vables, both in terms of volume and payment terms, thus generating demand for TC.
6 FINAL CONSIDERATIONS
The goal of this article was to identify the determi-nant factors of the supply and demand for trade credit
by MSMEs, using a sample of 481 companies based in 32 cities in the states of Minas Gerais and São Paulo (Bra-zil). A survey covering the operational and financial va-riables inherent in the use and supply of TC with mana-ging owners of these companies was performed, which resulted in the consolidation of a unique and exclusive database on working capital management practices, and included companies of different sizes and industries.
The data were treated through multivariate techni-ques of simultaneous simple regressions to estimate the signs of the correlation coefficients of the path model and the direct and indirect effects on the demand for TC. This demand model is solidly supported by the fun-damentals of the agency, and transaction costs and tra-de credit theories.
he results demonstrate that the frequency of use of external inancing, the proportion of credit sales and days sales outstanding are conditioning factors of the volume of credit purchases (for TC demand). Suppliers face as-pects of adverse selection and moral risk regarding their customers because MSMEs sufer credit restriction due to their little access to bank loans. In this study, the eviden-ce seems to support the hypothesis of the theory of trade credit complementarity in MSMEs. his result corrobora-tes the indings of Deloof and Jegers (1999) and García--Teruel and Martínez-Solano (2010).
Our evidence also validates the results of Carvalho and Schiozer (2012) who showed that Brazilian MSMEs supply less TC than UK ones, a result that may be ex-plained by the lesser access to bank and trade credit for small companies in Brazil compared with the UK. The joint analysis of our results indicates that trade credit has a positive impact on bank credit and vice-versa. In addition, the hypothesis of the theory of strategic use of trade credit was also supported in this sample be-cause the revenue growth of the firms puts pressure on
the amount of working capital required to support the operations growth. In this case, the firms may demand more trade and bank financing, in addition to longer payment terms to suppliers. These funds can be redis-tributed, direct or indirectly, to their customers aiming to increase credit sales.
The supply of trade credit, measured by the volu-me of credit sales, has a direct, positive and significant effect on the demand for financing from suppliers and an indirect effect through the days sales outstanding of customers. The theory indicates that it is likely that ma-rket power has a direct influence on the supply of trade credit. Although it was not possible to test this hypothe-sis due to lack of data on market power of the firms, it is expected that a possible bias caused by the omission of this variable is small, particularly from the supply side, considering that small and medium-sized companies presumably face intense competition.
Finally, it must be noted that the nature of the data (purely cross-sectional) does not always allow us to unequivocally identify causality relationships, consi-dering that some variables are endogenously related to one another (for example, decisions on payment terms given to customers and the proportion of credit purcha-ses may be taken simultaneously by the manager, and it is virtually impossible to determine which decision influences the other). Nevertheless, most of the associa-tions found in this study have a logical and likely causa-lity direction that is supported by theory.
One limitation of this study is the use of perceptions of the managing owners of the MSMEs instead of finan-cial data, which are difficult to access in firms of that size. As a suggestion for future research, other studies in other regions and with other variables can be perfor-med, thus generating new knowledge in the Brazilian context. An additional study may analyze whether the emergent phase of the Brazilian economy had impact on the demand and supply of trade credit by MSMEs.
Alphonse, P., Ducret, J., & Séverin, E. (2004). When trade credit facilitates access to bank inance: evidence from US small business data. Social Science Research Network. Recuperado em 20 janeiro, 2011, de http:// papers.ssrn.com/sol3/papers.cfm?abstract_id=260064.
Ang, J. S., Cole, R. A., & Lin, J. W. (2000). Agency costs and ownership structure. Journal of Finance, 55 (1), 81-106.
Atanasova, C. (2012Spring). How do irms choose between intermediary and supplier inance? Financial Management, 41 (1), 207-228. Baker, H. K., Singleton, J. C., & Veit, E. T. (2011). Survey research in
corporate inance: bridging the gap between theory and practice. Financial Management Association Survey and Synthesis Series. New
York: Oxford University Press.
Balbinotti, M. A. A., Benetti, C., & Terra, P. R. S. (2006). Translation and validation of the Graham-Harvey survey for the Brazilian context.
International Journal of Managerial Finance,3 (1), 26-48.
Bastos, R., & Pindado, J. (2007). Trade credit policy: theory and empirical evidence. Applied Economics, 39 (20), 2631-2642.
Bates, T. W., Kahle, K. M., & Stulz, R. M. (2009). Why do U.S. irms hold so much more cash than they used to? he Journal of Finance, LXIV
(5), 1985-2021.
Boissay, F., & Gropp, R. (2007). Trade credit defaults and liquidity provision by irms. European Central Bank, Working Papers Series n. 753.
Recuperado em 14 outubro, 2010, de https://www.ecb.europa.eu/pub/ pdf/scpwps/ecbwp753.pdf.
Brennan, M. J., Maksimovic, V., & Zechner, J. (1988).Vendor inancing. he Journal of Finance, XLIII (5), 1127–1141.
Brigham, E. F., & Ehrhardt, M. C. (2007). Administração inanceira (teoria e prática). (10a ed.). São Paulo: homson Learning.
Byrne, B. M. (2001). Structural equation modeling with AMOS: basic concepts, applications, and programming. Mahwah, New Jersey: Lawrence Erlbaum Associates.
Carvalho, C. J., & Schiozer, R. F. (2011). A inluência da gestão de crédito nos estoques em micro e pequenas empresas: o efeito mediador da gestão de caixa. Anais do Encontro Anual da ANPAD, Rio de Janeiro, RJ, Brasil, 35. Carvalho, C. J., & Schiozer, R. F. (2012). Gestão de capital de giro: um
estudo comparativo entre práticas de empresas brasileiras e britânicas.
Revista de Administração Contemporânea, 16 (4), 518-543. Chang, C., Lee, A. C., & Lee, C. F. (2009). Determinants of capital
structure choice: structural equation modeling approach. Finance, 49
(2), 197-213.
Churchill, N. C., & Lewis, V. L. (1983 May-June).he ive stages of business growth. Harvard Business Review, 61 (3), 30-50.
Cole, R. A. (2013Winter). What do we know about the capital structure of privately held US irms? Evidence from the surveys of small business inance. Financial Management, 42 (4), 777-813.
Cole, R. A., Wolken, J. D., & Woodburn, R. L. (1996). Bank and nonbank competition for small business credit: evidence from the 1987 and 1993 national surveys of small business inances. Federal Reserve Bulletin, 82 (11), 983-995.
Custódio, C., Ferreira, M. A., & Laureano, L. (2013). Why are US irms using more short-term debt? Journal of Financial Economics, 108 (1), 182-212.
Danielson, M. G., & Scott, J. A. (2000). Additional evidence on the use of trade credit by small irms: the role of trade credit discounts. Recuperado em 12 março, 2012, de http://papers.ssrn.com/sol3/ papers.cfm?abstract_id=236260.
Deloof, M. (2003 April). Does working capital management afect proitability of belgian irms? Journal of Business Finance & Accounting,
30 (3-4), 573-588.
Deloof, M., & Jegers, M. (1999 September-October).Trade credit, corporate groups, and the inancing of Belgian irms. Journal of Business Finance and Accounting, 26 (7/8), 945-966.
Dodge, H. R., & Robbins, J. E. (1992). An empirical investigation of the organizational life cycle model for small business development and survival. Journal of Small Business Management,30 (1), 27-37. Ebben, J. J., & Johnson, A. C. (2010). Cash conversion cycle management
in small irms: relantionships with liquidity, invested capital, and irm performance. Journal of Small Business and Entrepreneurship, 24 (3), 381-396.
Etiennot, H., Preve, L. A., & Sarria-Allende, V. (2012).Working capital management: an exploratory study. Journal of Applied Finance, 22 (1), 162-175.
Ferris, J. S. A. (1981). Transaction theory of trade credit use. Quarterly Journal of Economics, 96 (2), 243-270.
García-Teruel, P. J., & Martínez-Solano, P. M. (2007). Efects of working capital management on SME proitability. International Journal of Managerial Finance, 3 (2), 164-177.
García-Teruel, P. J., & Martínez-Solano, P. M. (2010). Determinants of trade credit: a comparative study of European SMEs. International Small Business Journal, 28 (3), 215-233.
Hair, J. F., Jr., Anderson, R. E., Tatham, R. L., & Black, W. C. (2005).
Análise multivariada de dados. (5. ed.). Porto Alegre: Bookman. Hill, M. D., Kelly, G. W., & Highield, M. J. (2010Summer). Net operating
working capital behavior: a irst look. Financial Management, 39 (2), 783-805.
Hill, M. D., Kelly, G. W., & Lockhard, G. B. (2012 Spring). Shareholder returns from supplying trade credit. Financial Management, 41 (1), 255-280.
Howorth, C., & Reber, B. (2003). Habitual late payment of trade credit: an empirical examination of UK small companies. Managerial and Decision Economics, 24 (6/7),471-482.
Howorth, C., & Westhead, P. (2003).he focus of working capital management in UK small irms. Management Accounting Research, 14
(2), 94-111.
Howorth, C., & Wilson, N. (1999). Late payment and the small irm.
Journal of Small Business and Enterprise Development, 5 (4), 307-315. Instituto Brasileiro de Geograia e Estatística. IBGE. Produto Interno Bruto
dos Municípios 2011, disponível em http://www.ibge.gov.br/home/
estatistica/economia/pibmunicipios/2011/default.shtm.
Islam, S. S., & Mozundar, A. (2007). Financial market development and the importance of internal cash: evidence from international data.
Journal of Banking & Finance, 31 (3), 641-658.
Jensen, M. C., & Meckling, W. C. (1976).heory of the irm: managerial behaviour, agency costs and ownership structure. Journal of Financial Economics, 3 (4), 305-360.
Kline, R. B. (2011). Principles and practice of structural equation modeling. (3. ed.) London: Guilford Press.
Long, M. S., Malitz, I. B., & Ravid, A. (1993).Trade credit, quality guarantees, and product marketability. Financial Management, 22 (4), 117-127.
Maddala, G. S., & Nimalendran, M. (1995). An unobservable component panel data model to study the efects of earnings surprises on stock prices, trading and bid-ask spreads. Journal of Econometrics, 68 (1), 229-242.
Marconi, M. A., & Lakatos, E. M. (2003). Fundamentos da metodologia cientíica. São Paulo: Atlas.
Matias, A. P. (2006). Does trade credit facilitate access to bank inance? An empirical evidence from Portuguese and Spanish small medium size enterprises. Recuperado em 10 março, 2012, de http://www.fep.up.pt/ investigacao/cempre/actividades/sem_in/sem_in_01_05/PAPERS_ PDF/paper_sem_in_12jun08.pdf.
Meltzer, A. H. (1960). Mercantile credit, monetary policy, and size of irms. Review of Economics and Statistics, 42 (4), 429-437. Mian, S., & Smith, C. (1992). Accounts receivables management policy:
theory and evidence. Journal of Finance, 47 (1), 169-200. Molina, C. A., & Preve, L. (2009Autumn). Trade receivables policy
of distressed irms and its efect on the costs of inancial distress.
Financial Management, 38 (3), 663-686.
Myers, S. C., & Majluf, N. (1984). Corporate inancing and investment decisions when irms have information that investors do not have.
Journal of Financial Economics,13 (2), 187-221.
Ogawa, K., Sterken, E., & Tokutsu, I. (2011). Redistributional view of trade credit: evidence from micro data of japanese small irms. Recuperado em 2 de março, 2012, de http://www.rieti.go.jp/jp/publications/ dp/09e029.pdf.
Örtqvist, D., Masli, E. K., Rahman, S. F., & Selvarajah, C. (2006). Determinants of capital structure in new venture: evidence from Swedish longitudinal data. Journal of Development and Entrepreneurship, 11 (4), 277-296.
Paul, S. Y., & Boden, R. (2011). Size matters: the late payment problem.
Journal Small Business and Enterprise Development, 18 (4), 732-747. Peel, M. J., Wilson, N., & Howorth, C. (2000). Late payment and credit
management in the small irms sector: some empirical evidence.
International Small Business Journal, 18 (2), 17-37. Petersen, M. A., & Rajan, R. G. (1994). he beneits of lending
relationships: evidence from small business data. he Journal of Finance, 49 (1), 3-37.
Petersen, M. A., & Rajan, R. G. (1997). Trade credit: theories and evidence.
he Review of Financial Studies, 10 (3), 661-691.
Pike, R. H., & Cheng, N. S. (2001). Credit management: an examination of policy choices, practices and late payment in UK companies. Journal of Business Finance and Accounting, 28 (7/8), 1013-1042.
Rodríguez-Rodríguez, O. M. (2006). Trade credit in small and medium size irms: an application of the system estimator with panel data.
Small Business Economics, 27 (2/3), 103-126.
Saito, R., & Bandeira, M. L. (2010). Empirical evidence of trade credit uses of Brazilian publicly listed companies. Brazilian Administration Review,7 (3), 242-259.
Schiozer, R. F., & Brando, J. A. P. (2011). A oferta de créditos comerciais pelas empresas brasileiras de capital aberto. Revista Brasileira de Finanças, 9 (4), 585-612.
Sheng, H. H., Bortoluzzo, A. B., & Santos, G. A. P. (2013). Impact of trade credit on irm inventory investment during inancial crises: evidence from Latin America. Emerging Markets Finance & Trade, 49 (4), 32-52.
Shi, J., Yang, R., & Zhou, X. (2011). he trade credit transfer activity of small and medium-sized enterprises - empirical study based on the sampling survey of the SMEs in China. International Conference on Economics and Finance Research IPEDR.
Soufani, K., & Poutziouris, P. (2004). he supply of trade credit: evidence from the UK. Recuperado em 12 março, 2012, de http://papers.ssrn. com/sol3/papers.cfm?abstract_id=314874.