biosurfactant-producing bacteria
Krepsky, N.
a,b, Da Silva, FS.
a,b, Fontana, LF.
a,band Crapez, MAC.
a*
aPrograma de Pós-Graduação em Biologia Marinha, Universidade Federal Fluminense, Instituto de Biologia, Outeiro de São João Batista, s/n, CEP 24020-140, Campus do Valonguinho, Niterói, Brazil
b Departamento de Geologia, Universidade Federal Fluminense, Av. Litorânea s/n, 4° andar, CEP 24210-340, Gragoatá, Niterói, RJ, Brazil
*e-mail: [email protected]
Received November 19, 2004 – Accepted November 16, 2005 – Distributed February 28, 2007 (With 4 figures)
Abstract
Wide biosurfactant application on biorremediation is limited by its high production cost. The search for cheaper bios-surfactant production alternatives has guided our study. The use of selective media containing sucrose (10 g.L-1) and
Arabian Light oil (2 g.L-1) as carbon sources showed to be effective to screen and maintain biosurfactant-producing
consortia isolated from mangrove hydrocarbon-contaminated sediment. The biosurfactant production was assayed by kerosene, gasoline and Arabian Light Emulsification activity and the bacterial growth curve was determined by bacte-rial quantification. The parameters analyzed for biosurfactant production were the growth curve, salinity concentration, flask shape and oxygenation. All bacteria consortia screened were able to emulsify the petroleum derivatives tested. Biosurfactant production increased according to the incubation time; however the type of emulsification (non-aqueous phase or aqueous phase) did not change with time but with the compound tested. The methodology was able to isolate biosurfactant-producing consortia from superficial mangrove sediment contaminated by petroleum hydrocarbons and was recommended for selection of biosurfactant producing bacteria in tropical countries with low financial resources.
Keywords: bacteria consortia, bioremediation, petroleum, sediment.
Metodologia alternativa para isolamento de bactérias produtoras de biossurfactante
Resumo
A ampla aplicação de biossurfactantes em biorremediação é limitada pelo seu alto custo de produção. A procura de al-ternativas de produção mais baratas motivou nosso estudo. O uso de meio seletivo, contendo sacarose (10 g.L-1) e óleo
Árabe Leve (2 g.L-1), mostrou-se eficiente na triagem e manutenção de consórcios bacterianos isolados de sedimento
de mangue contaminado com hidrocarboneto. A produção de biossurfactante foi avaliada pela Atividade Emulsificante do querosene, gasolina e Árabe Leve e a curva de crescimento foi determinada pela quantificação bacteriana. Os parâ-metros analisados para a produção de biossurfactante foram: curva de crescimento, concentração da salinidade, forma do frasco e oxigenação. Todos os consórcios bacterianos pesquisados foram capazes de emulsificar os derivados de petróleo testados. A produção de biossurfactante aumentou de acordo com o tempo de incubação, entretanto, o tipo de emulsificação aquosa e não-aquosa não mudou com o tempo, mas com o composto testado. A metodologia permitiu o isolamento de consórcios bacterianos produtores de biossurfactante de sedimento superficial de mangue contaminado com hidrocarbonetos do petróleo, sendo indicada para seleção de bactéria produtora de biossurfactante em países tropicais com baixos recursos financeiros.
Palavras-chave: consórcio bacteriano, biorremediação, petróleo, sedimento.
1. Introduction
Marine contamination with petroleum hydrocar-bons has caused critical environmental and health problems (Rahman et al., 2002). A spill of over 300,000 gal of marine fuel oil occurred on 18 of January 2000 at Guanabara Bay, Rio de Janeiro, Brazil reaching Guapimirim Environmental Protection Area man-groves. Mangrove sediments are rich in organic matter
Only dissolved molecules can be metabolized by microorganisms. Its adsorption to mangrove sediments limits bioavailability of hydrophobic compounds to indigenous microorganisms and reduces the effective-ness of the bioremediation process (Francy et al., 1991, Southam et al., 2001; Paraszkiewicz et al., 2002). The persistence of oil on muddy sediments such as mangrove can cause long term impacts to their highly oil sensitive biota, mainly at intertidal habitats and their associated communities (Michel, 2000).
Fortunately, some indigenous bacteria from chroni-cally contaminated sediment may produce biosurfactant. Biosurfactants produced by hydrocarbon-degrading bac-teria can emulsify hydrocarbon-water mixtures, which enables them to grow on the oil droplets. These emul-sification properties have also been demonstrated to enhance hydrocarbon degradation in the environment, making them potential tools for oil spill pollution-con-trol (Banat, 1995).
Since the last decade, increasing attention has been paid to the development and implementation of bio-technology for cleaning up this sort of contamination. However, the high production costs associated caused by low strain productivities and high recovery expenses, limit its wide application (Davis et al., 1999). With this scope, the present study proposes an effective method-ology to search for biosurfactant-producing bacteria at chronically hydrocarbon-contaminated sediments with low cost.
2. Material and Methods
2.1. Site characterization and sampling
Mangrove sediment samples (5 cm of depth) were collected at Guapimirim Environmental Protection Area (from -22° 40’ to -22° 46’ S and from -42° 57’ to -43° 07’ W), Rio de Janeiro, Brazil two years after the January, 2000 oil spill at Guanabara Bay. The samples were trans-ported to a laboratory in a temperature isolated box.
2.2. Chemicals
Kerosene, Gasoline type C and Arabian Light oil used in emulsification activity assays were supplied by the PETROBRAS Oil Company. The hydrocarbon speci-fications are listed in Table 1 according to Jokuty et al. (2000). Mineral oil applied to create an oxygen-limited environment for the bacteria growth was purchased by Johnson & Johnson (São Paulo, BR).
2.3. Microbial cultures
Media were prepared with sea water collected from the Itacoatiara beach (-2° 54’ S and -43° 12’ W), Niterói, Brazil filtered through a 0.45 µm pore membrane and di-luted with de-ionized water to the desired salt concentra-tion. The growth media prepared for this work are listed in Table 2.
Arabian Light-degrading bacteria were selected from the sediment samples as follows. The collected sediment (1 g) were inoculated into 50 mL of medium 1 (Table 2) and the flasks were incubated for 30 days at room tem-perature.
After 30 days of growth, the bacteria were plated for 21 days in medium 2 (Table 2) for mucous bacte-ria screening. Reddish-pink colonies were selected and then inoculated into 10 mL of medium 3 (Table 2). After 15 days of incubation, 5 mL were transferred to 50 mL of medium 3 for biomass increase and bacteria mainte-nance. This growth provided the bacteria for the assays.
2.4. Parameters for biosurfactant production
2.4.1. Salinity concentration
Bacteria (1 mL) were inoculated in triplicate into 9 mL of media 4 (Table 2) with salt water concentration of 8 g.L-1, 16 g.L-1 or 24 g.L-1 (Table 2). After 30 days of
incubation in tubes, the salt water concentration with the best bacterial growth and mucous formation were trans-ferred into 50 mL of media 4 and incubated for more than 30 days to confirm this observation. This salt-wa-ter concentration was then used to prepare the media for emulsification activity and bacterial quantification as-says.
2.4.2. Bacterial growth curve
The bacteria cultures were incubated on 100 mL of media 5 (Table 2) for 70 days on Wheaton flask. Emulsification activity and bacteria quantification (BQ) were performed every 72 hours over 30 days of incu-bation. Another reading was repeated at day 70. Due to bacterial adherence at the bottom of the Wheaton flask (as will be discussed later), the flask shape and oxygena-tion on Emulsificaoxygena-tion activity and bacterial quantifica-tion were tested.
2.4.3. Flask shape
Erlenmeyer and Wheaton flasks with equal volumes (250 mL) but with different shapes were compared for Emulsification activity and BQ. Readings were per-formed at days 0, 6, 15, 18 and 30. Assays were done in triplicate.
2.4.4. Oxygenation
A layer of mineral oil was added to both flasks after bacteria inoculation creating an oxygen-limited environ-ment. Emulsification activity and bacterial quantification (BQ) were assayed on days 0, 6, 15, 18 and 30. Results were compared to flasks with no mineral oil addition. Assays were done in triplicate.
Table 1. Chemical properties of hydrocarbons used in Emul-sification activity assaysa.
Compound API Flash point Density
Arabian light 31.8 -20/89 0.8581/0.9225
Kerosene - 38 0.7895/0.8038
Gasoline 62.4 - 0.7290/0.7501
2.5. Bacterial Quantification (BQ)
Quantification was performed following Carlucci et al. (1986) and Kepner and Pratt (1994). Each bac-terial sample was filtered through a 0.22 µm Black Polycarbonate membrane (Isopore Membrane Filters, Millipore). The stained bacteria were counted at 1000x magnification using epifluorescence microscopy, ten fold in triplicate (Axioskop 50, Zeiss).
2.6. Emulsification activity
Emulsification activity was performed according to Paraszkiewicz et al. (2002). Kerosene, gasoline or Arabian Light was added to bacterial broth in a ratio of 3:2 and then vortexed for 1 minute. After 24 hours rest the height of the emulsified compound was measured and compared with the total height of the hydrocarbon added multiplied by 100 (non-aqueous phase emulsifica-tion A). Emulsificaemulsifica-tion of aqueous phase (B) was calcu-lated by dividing the total height of hydrocarbon in the emulsion phase by the total height of the culture media multiplied by 100. The emulsification index (E24) was es-timated by the height of the emulsification layer, divided by the total height of the system multiplied by 100. All assays were performed in triplicate for each compound. A control with no bacteria growth was performed for each compound.
2.7. Statistical analysis
The growth curve was compared by the t-Student test with Emulsification activity, the prevalent phase (A or B) for each compound at both flasks and with mineral oil addition. Bacteria quantification (BQ) and E24 of each compound were correlated by Statistics for Windows (StatSoft, Inc., 2000). Only significant values were con-sidered for discussion (p <0.05).
3. Results
The bacteria were isolated from the mangrove sedi-ment contaminated with petroleum hydrocarbons. Red Congo Agar distinguished reddish-pink colonies from
white ones. Only 3 large reddish-pink mucous colonies with well-defined boundaries were selected for assays, characteristics that may be associated with biossurfactant production. Though plating in Petri dishes are useful to isolate pure colonies, the bacteria remained as consortia which was noticed by epifluorescence microscopy obser-vation (data not shown). These bacteria were unable to grow as pure culture under the growth condition created, as will be discussed later. Consequently, the consortia were labeled as M1, M2 and M3. They grew at 8, 16 and 24 g.L-1 salt-water concentration, however
consor-tia growths at 16 g.L-1 were more intense and viscous
(unpublished data). As a result, this concentration was selected to prepare media for emulsification and bacte-rial quantification assays.
The growth curve of bacteria consortia M1, M2 e M3 are shown in Figure 1. Growth decreased over 70 days of incubation. BQ reduced from 0.60 to 0.15 µgC.cm-3 for
M1 (Figure 1a), 0.26 to 0.05 µgC.cm-3 for M2 (Figure 1b)
and from 0.55 to 0.10 µgC.cm-3 for M3 (Figure 1c).
However, a growth peak was detected on day 6 for M2 (0.16 µgC.cm-3) and on day 21 for M1 (0.47 µgC.cm-3)
and M3 (0.23 µgC.cm-3).
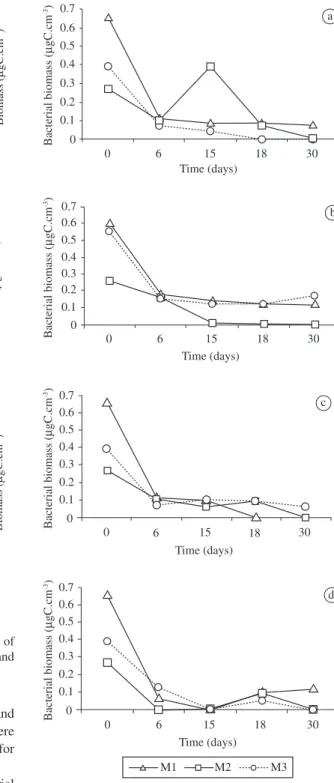
Both Erlenmeyer and Wheaton flasks showed a reduction in bacterial growth in incubation time (Figure 2). Erlenmeyer biomass reduced from 0.66 (M1)/ 0.27 (M2)/ 0.39 (M3) to 0.08 µgC.cm-3 (M1)
and 0.0 µgC.cm-3 (M2 and M3) as shown in Figure 2a.
This profile was also observed in the Wheaton flasks (Figure 2b). Biomass decreased from 0.60 µgC.cm-3 to
0.12 µgC.cm-3 (M1), 0.26 to 0 µgC.cm-3 (M2) and from
0.55 to 0.17 (M3). However, M2 (at Erlenmeyer) presented a growth peak on day 15 with a biomass of 0.39 µgC.cm-3
(Figure 2a). Therefore, according to the t-student test, Elenmeyer flasks presented a higher biomass than Wheaton flasks (p <0.05).
Mineral oil addition influenced bacterial growth nega-tively in both flasks. Biomass reduced from 0.66/0.27 and 0.39 µgC.cm-3 for M1, M2 and M3, respectively, to 0 for
M1 and M2, and 0.06 µgC.cm-3 for M3 in Erlenmeyer Table 2. Description of the growth media designed for experiments.
Growth media Composition (g.L-1)
Agar-agar Arabian Light oil
Bactopeptone Congo-red Salt water
Sucrose Urea
(1) Selection of Arabian Light-degrading bacteria
- 2.00 - - 24.00 10.00 0.10
(2) Screening of mucous bacteria
20.00 2.00 - 0.08 24.00 10.00 0.10
(3) Bacterial biomass increase and maintenance
- 2.00 2.00 - 24.00 -
-(4) Salinity concentration parameter
- - 2.00 - variable* 10.00
-(5) Bacterial growth curve - - - - 16.00 1.00 0.50
(Figure 2c) and in Wheaton to 0.12 µgC.cm-3 for M1 and
0 µgC.cm-3 for M2 and M3 (Figure 2d). However, there
was a growth peak at day 30 (BQ of 0.12 µgC.cm-3) for
M1 grown in the Wheaton flask with mineral oil. Emulsification index (E24) varied with the bacterial growth phase, the bacteria consortia, the type of flask used for bacterial incubation, the addition of mineral oil and the compound tested. There was no emulsifica-tion when biosurfactant-free medium was mixed with hydrocarbons. Kerosene, gasoline and Arabian Light emulsification were detected from the first day of incu-bation for all bacterial consortia (Figure 1). E24 ranged from 46.51 to 99.56% for kerosene, 23.19% to 100.00% for gasoline and from 40.00 to 95.33% for Arabian Light. The highest emulsification values of kerosene
100 80 60 40 20 0 0 3 Days
6 9 12 15 18 21 24 27 30 70
0,8 0,6 0,4 0,2 0 Biomass ( M gC.cm -3) Emulsif ication inde x (%) a 100 80 60 40 20 0 0 3 Days
6 9 12 15 18 21 24 27 30 70 0,8
0,6
0,4
0,2
0 Biomass (
M gC.cm -3) Emulsif ication inde x (%) b 100 80 60 40 20 0 0 3 Days
6 9 12 15 18 21 24 27 30 70 0,8
0,6
0,4
0,2
0 Biomass (
M gC.cm -3) Emulsif ication inde x (%)
Arabian Light Kerosene
Gasoline Biomass
c
Figure 1. Growth curve and Emulsification index (E24) of each bacteria incubated for 70 days: a) M1; b) M2; and c) M3. 0.7 0.6 0.5 0.4 0.3 0.2 0.1 0 0 6 Time (days)
15 18 30
Bacterial biomass (
M
gC.cm
-3) a
0.7 0.6 0.5 0.4 0.3 0.2 0.1 0 0 6 Time (days)
15 18 30
Bacterial biomass (
M gC.cm -3) b 0.7 0.6 0.5 0.4 0.3 0.2 0.1 0 0 6 Time (days)
15 18 30
Bacterial biomass (
M gC.cm -3) c 0.7 0.6 0.5 0.4 0.3 0.2 0.1 0 0 6 Time (days)
15 18 30
Bacterial biomass (
M
gC.cm
-3)
d
M1 M2 M3
Figure 2. Growth curve comparision of bacteria incubated for 30 days in a) Erlenmeyer and b) Wheaton without mineral oil and in c) Erlenmeyer and d) Wheaton with mineral oil.
(p <0.05) were detected on day 70 for M1 when BQ was 0.15 µgC.cm-3 (Figure 1a) and on day 15 for M2 (Figure 1b)
and M3 (Figure 1c) with E24 of 94.20 and 90.68% and
a biomass of 0.01 and 0.12 µgC.cm-3, respectively. The
for this compound (p >0.05). Arabian Light emulsifica-tion was higher on days 24 for M2 and M3 and 27 for M1. On day 24, bacterial biomasses were, respectively, 0 and 0.12 µgC.cm-3 and on day 27 it was 0.18 µgC.cm-3.
When compared with the t-student test, higher kerosene and Arabian Light E24 for M3 was followed, respectively, by lower BQ on days 15 and 18 (p <0.05).
The range of Emulsification (E24) values for Erlenmeyer and Wheaton flasks are shown in Table 2. Concerning Erlenmeyer, the highest kero-sene E24 values (100%) were detected when BQ was
0.09 µgC.cm-3 and in Wheaton (94.20%) when BQ was
0.01 µgC.cm-3. For gasoline, the highest E
24 (100%)
were found on days 6, 15 and 18 in Erlenmeyer. On these days, biomasses were 0.07, 0.09 and 0 µgC.cm-3,
respectively. In the Wheaton flask, the highest gasoline E24 (98.08%) was found on day 18 for M2 with BQ of 0.01 µgC.cm-3. For Arabian Light E
24, day 18 presented the
highest rates. In Erlenmeyer, E24 was 86.12% when BQ was 0.07 µgC.cm-3 and in Wheaton, 95.33% on day 15 when
BQ was 0.12 µgC.cm-3. However, according to the
t-Student test, for Erlenmeyer flasks there was no correla-tion between E24 and BQ values for any of the compounds tested. For Wheaton flasks, E24 of M3 were negatively cor-related with BQ on day 15 for kerosene (E24 of 90.68%; BQ 0.12 µgC.cm-3) and on day 18 (E
24 66.09% and BQ
0.12 µgC.cm-3) for Arabian Light oil (r = -1.0, p <0.05).
There was no correlation of gasoline E24 with BQ. When mineral oil was added, the highest kerosene E24 (100%) was on day 6 for M3 (BQ of 0.07 µgC.cm-3)
in Erlenmeyer and on day 15 for M2 in Wheaton (93.33% and 0 µgC.cm-3). For gasoline, the highest E
24
(100%) was on day 18 for M2 and M3, with BQ of 0.09 µgC.cm-3 in Erlenmeyer and Wheaton. However,
BQ of M3 in Wheaton was 0.04 µgC.cm-3. The highest
(80.32%) Arabian Light E24 was for M3 on day 18 with
BQ of 0.09 µgC.cm-3 in Erlenmeyer and 84.37% for M2
in Wheaton with BQ of 0.09 µgC.cm-3 (p <0.05).
The type of emulsification also varied with the com-pound tested (Figure 3). Non-aqueous (A) emulsification of kerosene ranged from 62.70 to 100% and aqueous emulsification (B) ranged from 21.44 to 100%. For
gaso-line, the A index ranged from 3.16 to 100% and B index from 15.38 to 100%. Arabian light showed values rang-ing from 20 to 100% (A) and from 55 to 100% (B). As represented in Figure 3, 58% of the Arabian Light high-est emulsification values were in the B phase compared to only 2.8% of emulsification in phase A (p <0.05). However, 11% of kerosene and 5% of gasoline highest emulsification was in phase A (p <0.05).
The emulsification type ranges for Erlenmeyer and Wheaton flasks are shown in Table 3. Fifty-three percent (53%) of Arabian Light emulsification was in phase B, whilst 33 and 6% of the Erlenmeyer cultured consortia emulsified respectively, kerosene and gasoline in phase A (Figure 4a). Concerning Wheaton (Figure 4b), 67% of Arabian Light emulsification and 6% of gasoline emul-sification was in phase B, though 6% of kerosene was in phase A (p <0.05).
When bacterial consortia were cultured in Erlenmeyer in the presence of mineral oil (Figure 4c), 67% of Arabian Light emulsification was also in phase B (p <0.05). Kerosene presented 20% of emulsification in phase A, but only 6% of phase B emulsification (p <0.05). The bacterial consortia cultured in the Wheaton flasks with mineral oil (Figure 4d) presented the following emulsi-fication profile: 73% of Arabian Light emulsiemulsi-fication in phase B compared to 20% of kerosene emulsification and 13% of gasoline emulsification in phase A (p <0.05).
Table 3. Hydrocarbon Emulsification index range of bacteria incubated in Erlenmeyer and Wheaton.
Flask Emulsification index (%)a
Kerosene Gasoline Arabian light
Erlenmeyer Lowest
Highest
52.18 100.00
62.43 100.00
38.91 86.12
Wheaton Lowest
Highest
55.04 94.20
41.45 98.08
33.78 95.33 Erlenmeyer +mineral
oilb
Lowest Highest
64.68 100.00
57.46 100.00
18.76 80.32 Wheaton
+mineral oilb
Lowest Highest
57.16 93.33
67.82 100.00
48.86 84.37
aLowest and highest values presented by biosurfactant-producing consortia after 30 day growth (p <0.05). bEmulsification presented by consortia cultures with mineral oil.
100
75
50
25
0
Consortia (%)
Arabian Light Kerosene Gasoline
Non aqueous emusification (A) Aqueous emulsification (B)
of selective media loaded with carbon sources (sucrose – 10 g.L-1 and Arabian Light – 2 g.L-1) showed it was
useful in terms of screening and maintenance of biosur-factant-producing bacteria from a highly eutrophic en-vironment. Guanabara Bay and its mangrove protection areas are constantly subject to a multiple source of petro-leum arrival (Michel, 2000). This chronicle contamina-tion allows for the natural seleccontamina-tion of hydrocarbon-de-grading bacteria communities at the sediment.
As others have observed, high biosurfactant produc-tion is found to be characteristic under certain qualitative and quantitative environmental conditions depending on nutritional and environmental factors. Many studies have shown that hydrocarbon substrates are preferable for bio-surfactant production. There is a growth in biobio-surfactant
production whenever microorganisms such as Candida
tropicalis, Candida lipolytica, Corynebacterium le-pus and other species grow at the expense of water
immiscible substrates. Other bacteria (e.g. Bacillus subtilis, Pseudomonas aeruginosa and Pseudomonas fluorescens) can produce biosurfactants when grown on
carbohydrates such as solely carbon sources. However,
Arthrobacter paraffeinus, Torulopsis petrophilum and Torulopsis bombicola produce higher amounts of
biosur-factants when grown on carbohydrate and hydrocarbon supplemented mediums (Shafi and Khanna, 1995).
The bacteria were able to grow at a wide salinity range - 8, 16 and 24 g.L-1. However the best results of
growth and media viscosity were noticed at 16 g.L-1
of salt water. This salinity is 1.5 times lower than the minimal salinity range of mangroves, which range from 25 to 45 g.L-1 according to precipitation and river
dy-namics of the area. As these bacteria were isolated from mangrove sediment, the growth at wide range salinity was expected. The high mangrove salinity fluctuation linked to the sediment contamination with hydrocarbons selects bacteria able to cope with harsh conditions.
Even after Congo Agar plating and single colony pick, epifluorescence microscopy showed coccus and bacillus coexisting in the same colony (unpublished data). Later the predominant cell of each consortia was identified as Micrococcus spp., Alcanivorax spp. and Hydrococcus spp. by RNAr 16S (data not shown). This
indicates the presence of heterogeneous bacteria act-ing on degradation of hydrocarbons and biosurfactant production. Heterogeneous bacteria communities have broad enzymatic capacities making degradation of hy-drocarbon substrates more efficient than single bacteria degradation. According to Knackmuss (1996), biodeg-radation of compounds such as hydrocarbons, can only be done when the catabolic activities present in the mi-crobial communities complement each other. In short, the metabolic by-products of one microorganism might serve as a nutrient support for the others (Crapez et al. 2000 and Dunne 2002).
Agar Congo is useful to investigate capsules and mi-crocapsules in microorganisms such as a Staphylococcus
biofilm producer and invasive Shiguella. Bacterial cells
100
75
50
Consortia (%)
0 25
Arabian Light Kerosene Gasoline
a
100
75
50
Consortia (%) 25
0
Arabian Light Kerosene Gasoline
b
100
75
50
25
0
Consortia (%)
Arabian Light Kerosene Gasoline
c
100
75
50
Consortia (%) 25
0
Arabian Light Kerosene Gasoline
d
Non aqueous emulsification (A) Aqueous emulsification (B)
Figure 4. Type of emulsification presented when bacteria consortia were cultured without mineral oil in a) Erlenmey-er and b) Wheaton and with minErlenmey-eral oil in c) ErlenmeyErlenmey-er and d) Wheaton. Values represent the percentage of bacteria consortia with significant differences analyzed by T-student (p <0.05).
4. Discussion
precipitate on their surface staining the colonies from pink to darkish red (Wenneras et al. 2000 and Arciola et al., 2001). We believe that biosurfactant may be pro-duced under the same circumstances of capsule/micro-capsule production.
In our experiments, we noticed a reduction in the bacterial growth curve (Figure 2) as bacteria adhered to the bottom of the incubation flasks, producing a biofilm layer. Mineral oil added to the flasks also functioned as a surface for bacterial adherence. Adherence reduced the numbers of free bacteria on the solution, consequently, interfering with bacterial cell quantification. Because our bacteria consortia were isolated from the man-grove sediments, they tended to search for immobilized growth. According to Bonin et al. (2001), the majority of benthic bacteria are not suspended in interstitial wa-ter but attached to sediment particles. The hydrophobic-ity/ hydrophilicity properties of the compounds used as a carbon source can have a marked impact onbacterial immobilization. They also defend that benthic bacterial immobilization changes its physiology in the presence of a solid support, when compared with its planktonic counterparts.
The stable emulsion produced when hydrophobic compounds (kerosene, gasoline or Arabian Light) were mixed with bacteria growth indicates the presence of surfactants in our system. According to Adamson (1990) the presence of a surfactant is necessary to obtain a sta-ble emulsion between two immiscista-ble pure liquids. Once vigorous mixing stops, both phases will separate if there is no surfactant present in the system.
The E24 peaks (>90%) of our bacteria consortia were found from days 15 to 70. These index values are com-patible with those found by Paraszkiewicz et al. (2002) for the biosurfactant producer fungus Curvularia lunata.
However, they found the maximum E24 peaks (93.0 ±
5.94% and 81.0 ± 9.42%) at 24 and 56 hours. Gram-posi-tive bacteria biosurfactant producer grown on oil diesel as a carbon source showed only 12% of emulsification (Cassidy and Hudack 2001).
The flask shape and the presence of mineral oil in-fluenced E24. For gasoline, there was no difference of E24 between the control and mineral oil for both Erlenmeyer and Wheaton flasks (p <0.05). However, for kerosene and Arabian Light, E24 was higher in the Erlenmeyer flask without mineral oil. We noticed that mineral oil reduces microbial growth and surfactant production in vitro, possibly by oxygen limitation (p <0.05). In ac-cordance, Sikkema et al. (1995) affirm that mineral oil reduces microbial environmental activity.
Although the bacterial growth curve reduced with time due to bacterial adhesion, biosurfactant production increased as noticed by E24 assays. For this reason, this adhesion seemed to be essential in terms of enhancing biosurfactant production. In accordance, Morton and Surman (1994) believe that biosurfactant-producing mi-croorganisms will be often found forming a dense film on the oil-water interface and consume the emulsified
hydrocarbon. However, this film developed on the inter-face should be regarded as a true biofilm. Furthermore, Shafi and Khanna (1995) believe that there is a surge in production of surfactant after the culture has reached an exponential growth and Nadarajah et al. (2002) showed that de-emulsification depends on bacterial density rath-er than inoculum age, once the lattrath-er intrath-erfrath-eres with cell surface hydrophobicity.
The emulsification type depends on the hydrocarbon composition rather than on the growth phase, flask shape or mineral oil addition. Contrary to this, Paraszkiewicz et al. (2002) related the variation of type of emulsion depending on the growth phase. In our experiments, the growth phase did not influence the type of emulsifica-tion, which varied according to the chemical character of each compound. Gasoline and kerosene have a similar density. However, Arabian light has a higher density than the previous one. This may explain the non-aqueous (A) emulsification preference of gasoline and kerosene and the aqueous phase (B) preference of Arabian Light.
This methodology proved to be cheap and effec-tive for the screening, maintenance and quantification of biosurfactant-producing bacteria consortia and was recommended for tropical countries with low found-ing resources. Although microscopy presented biomass quantification problems, due to bacterial bottom adher-ence, this observation allowed for the characterization of our samples such as bacteria consortia and cell viability determination at the same time. Marine bacteria tended to form biofilm on surfaces after reaching a population density. This biofilm formation may be fundamental for biosurfactant production and was unlike the shape of the flask used. Biossurfactant production may be governed by harsh conditions assembling capsule and micro-cap-sule production and depends on heterogeneous bacte-rial population for effective site decontamination. The aqueous and non-aqueous emulsification property of our biosurfactant allows for its use in hydrocarbon contami-nated water and sediment. Isolation and chemical char-acterization of the biossurfactant produced is the next step of the research.
Acknowledgments — The authors are grateful to PhD Ana Carla Mesquita, PhD Maria das Graças Bispo and M.Sc. Rosana Barreto Ferreira and an anonymous reviewer for suggestions. We would also like to thank Professor Luiz Sérgio Randino Lamego (Universidade Federal Fluminense, Departamento de Físico-Química) and Lucy Seldin (Universidade Federal do Rio de Janeiro, Instituto de Microbiologia Professor Paulo de Goés) for help and advice on data presentation. This work was supported by the Agência Nacional de Petróleo (ANP) under PRH 11 and Capacitação de Auxílio a Pesquisa (CAPES).
References
ADAMSON AW., 1990. Physical Chemistry of surfaces, 2nd ed. Wiley-Interscience, USA.
a Collection of Staphylococcal Strains from Catheter-Associated Infections. J. Clin. Microbiol., vol. 39, no. 6, p. 2151-2156. BANAT IM., 1995. Biosurfactants production and possible uses in microbial enhanced oil recovery and oil pollution remediation: a review. Biores Technol., vol. 51, no. 1, p. 1-12.
BONIN P., RONTANI J-F. and BORDENAVE L., 2001. Metabolic differences between attached and free-living marine bacteria: inadequacy of liquid cultures for describing in situ bacterial activity. FEMS Microbiol Lett., vol. 194, no. 1, p. 111-119.
CASSIDY DP. and HUDAK AJ., 2001. Microorganism selection and biosurfactant production in a continuously and periodically operated bioslurry reactor. J. of Haz. Mat., vol. 84, no. 2-3, p. 253-264.
CARLUCCI AF., CRAVEN DB., ROBERTSON DJ. and WILLIAMS PM., 1986. Surface-film microbial populations diel amino acid metabolism, carbon utilization and growth rates. Mar Biol., vol. 92, no. 2, p. 289-297.
CRAPEZ MAC., TOSTA ZT., BISPO MGS. and PEREIRA DC., 2000. Acute and chronic impacts caused by aromatic hydrocarbons on bacterial communities at Boa Viagem and Forte do Rio Branco Beaches, Guanabara Bay, Brazil. Environ Poll., vol. 108, p. 291-295.
DAVIS DA., LYNCH HC. and VARLEY J., 1999. The production of surfactin in batch culture by Bacillus subtilis ATCC 21332 is strongly influenced by the conditions of nitrogen metabolism. Enz Micro Technol., vol. 25, no. 3-5, p. 322-329.
DUNNE WM., 2002. Bacterial adhesion: Seen any good biofilms lately? Clin Microbiol Rev., vol. 15, no. 2, p. 155-166. FRANCY DS., THOMAS JM., RAYMOND RL. and WARD CH., 1991. Emulsification of hydrocarbons by subsurface bacteria. J. Ind Microbiol., vol. 8, no. 4, p. 237-246.
JOKUTY P., WHITICAR S., WANG Z., FINGAS M., FIELDHOUSE B., LAMBERT P. and MULLIN J., 2000. Properties of Crude Oils and Oil Products, accessed via http:// www.etcentre.org/spills.
KEPNER JR. and PRATT JR., 1994. Use of fluorochromes for direct enumeration of total bacteria in environmental samples: past and present. Microbiol Rev., vol. 58, no. 4, p. 603-615. KNACKMUSS HJ., 1996. Basic knowledge and perspectives of bioelimination of xenobiotic compounds. J. of Biotechnol., vol. 51, no. 3, p. 287-295.
MICHEL J., 2000. Assessment and recommendations for the oil spill cleanup of Guanabara Bay, Brazil. Spill Sci Technol Bull., vol. 6, no. 1, p. 89-96.
MORTON LHG. and SURMAN SB., 1994. Biofilms in biodeterioration – a Review. Internat Biodeter Biodeg., vol. 32, no. 1-3, p. 203-221.
NADARAJAH N., SINGH A. and WARD OW., 2002. De-emulsification of petroleum oil emulsion by a mixed bacterial culture. Process Biochem., vol. 37, no. 10, p. 1135-1141. PARASZKIEWICZ K., KANWAL A. and DLUGONSKI J., 2002. Emulsifier production by steroid transforming filamentous fungus Curvularia lunata. Growth and product characterization. J. Biotechnol., vol. 92, no. 3, p. 287-294.
RAHMAN KSM., BANAT IM., THAHIRA J., THAYUMANAVAN T. and LAKSHMANAPERUMALSAMY P., 2002. Biorremediation of gasoline contaminated soil by a bacterial consortium amended with poultry litter, coir pith and rhaminolipid biosurfactant. Biores Technol., vol. 81, no. 1, p. 25-32.
SHAFI R. and KHANNA S., 1995. Biosurfactants. Indian J. Microbiol., vol. 35, no. 3, p. 165-184.
SIKKEMA J., BONT JAM. and POOLMAN B., 1995. Mechanisms of membrane toxicity of hydrocarbons. Microbiol Rev., vol. 59, no. 2, p. 201-222.
SOUTHAM G., WHITNEY M. and KNICKERBOCKER C., 2001. Structural characterization of the hydrocarbon degrading bacteria-oil interface: implications for bioremediation. Intern Biodeter Biodeg., vol. 47, no. 4, p. 197-201.
WENNERÅS C., AVE P., HUERRE P., ARONDEL J., ULEVITCH RJ., MATHISON JC. and SANSONETTI P., 2000. Blockade of CD14 Increases Shigella-Mediated Invasion and Tissue Destruction. J. Immunol., vol.164, no. 6, p. 3214-3221.