Dissemination
in Partial Fulfilment of the Requirements for the Degree of Master of Informatics Engineering
Presented to the Department of Mathematics and Engineering of the University of Madeira, Portugal by
Tiago Alexandre D. Camacho
in September 2009
Hereby I declare that I wrote this thesis myself with the help of no more than the mentioned literature and auxiliary means.
Up to now, this thesis was not published or presented to another examinations office in the same or similar shape.
Abstract
Acknowledgments
I would like to start by thanking my supervisor, Professor Vassilis Kostakos, for his support and inspiration throughout this thesis. He always provided me with good advises, and was always available when needed. I learned a great deal from him, and for that I will always be thankful.
I would also like to thank Claudio Mantero for his helpful comments and advices, and for making infrastructures available for testing.
Table of contents
Abstract...iii
Acknowledgments...iv
Table of contents...v
1 Introduction...1
2 Motivation...3
2.1 Proximity Sensing...3
2.2 Content Dissemination...4
2.3 System Overview...5
2.4 Potential System Benefits...6
3 Public Transit Passengers' Opinions...8
3.1 Data Summary ...8
3.2 Discussion...13
3.3 Implications...17
4 State of The Art & Related Work...19
4.1 Broad View...19
4.2 In-Depth View...30
5 System Description...46
5.1 Example Scenarios...46
5.2 Overall System Requirements...47
5.3 Overal System Architecture...49
5.4 Component Description...51
5.5 System Particularities...74
6 Pilots & Test Results...93
6.1 Results...94
6.2 Discussion...115
6.3 Users Opinions...118
6.4 Implications...121
7 Conclusion & Future Work...124
7.1 Conclusive Comments...124
7.2 Future Work...125
Bibliography...127
Appendix A...1
A.1 General Considerations...1
A.2 Statistical Formulas...2
A.3 Variable Associations...5
A.4 Result Tables and Images...6
1 Introduction
With the advance of wireless technologies and the maturation of ubiquitous and context-aware computing, researchers are becoming more interested on the way these fields influence our daily lives. Although we are witnessing the widespread deployment of wireless technologies, still the full exploitation of this reality requires for the design and development of new infrastructures that exploit these technologies in favour of users.
One of the potential areas on which wireless technologies are useful is in the process of presence determination. Some of these technologies, such as Bluetooth, are termed ideal for this purpose, as they require no permission by users to establish low-level connections between equipment, therefore making the determination of people presence a non-intrusive process.
Effectively, with the addition of wireless components into mobile equipment, people carry with them components which can be sensed. As we lengthen the areas on which we deploy sensor nodes, we create the notion of a omnipresent sensing infrastructure capable of determining people's presence, using this information for, among many other possibilities, providing users with a set of innovative context-aware services.
2 Motivation
In this section we present the main factors of motivation that led to the development of our work. We start by discussing the importance of proximity sensing, before moving to content dissemination. We thereafter present an overview of our system, and finalize the section with the demonstration of potential system benefits.
2.1 Proximity Sensing
Depending on the nature of the information, some types of data are inherently difficult to be automatically determined. An example is seen in public transit companies, that to this day still rely on manual observation and incomplete data derivation for the determination of passengers' entry and exit points. These methods, used to determine important transportation analysis structures, lead to poor results, as both freshness and quality of data are undermined [Kostakos 08].
With the advent of technologies such as the Global Positioning System (GPS), the determination of positioning information has been facilitated. Nowadays, many vehicles, and even mobile equipment, have an incorporated GPS module that provides reliable localization determination. Still, long range satellite and terrestrial positioning systems are not suitable for all environments. Technologies such as GPS, Loran, and Omega are inadequate for both indoor and pin-point positioning, and therefore the diversity of fields on which they may be used is limited [TC 03].
Furthermore, there are times that the localization information that we wish to capture is in relation to another object. In this type of situation, we are not interested in the global position, but only in the relative one. This type of sensing that determines if two objects are close to each other is referred to as
proximity sensing, and technologies such as infra reds or radio-frequency may be used to accomplish it.
arise. Bluetooth, for example, is seen as a good low-cost and reliable choice to determine if two objects are in the vicinity of each other. The widespread adoption of the technology has potentiate the sensing of Bluetooth discoverable equipment. If we deploy scanners throughout a target area, the inquiry mechanism of the technology allows us to determine the existence of nearby Bluetooth enabled devices. Furthermore, additional positioning determination is possible, as the technology allows for approximation of relative distance by means of signal strength measurement. All of this is done non-intrusively, as these operations dispense human intervention.
The array of opportunities that advent from the determination of relative localization of mobile equipment using such a low-cost technology are manifold, as it can be used for simulation purposes, environment affluence classification, passenger counting, and context-aware content dissemination.
2.2 Content Dissemination
Usually, content dissemination happens in a non-personalized manner. For example, the information that is passed to people by means of an electronic board is not personalized. These dissemination components, present in many types of settings, broadcast information in a very restricted manner. Not only the content that is disseminated is limited, but also the way content is presented is restricted by the hardware limitations. This fact is not related solely to electronic boards, as many other dissemination systems lack flexibility. The PORTAL system [BCG 05], a city-wide network which provides public transit bus information access, is another example of a content dissemination system which uses specialized components. The system works by installing several dedicated machines throughout the city, so users may query for public transit related information. The need to have a high-cost, static components installed at a city-wide levels, solely for presentation purposes, challenges the real advantage of such system.
necessity of specialized dissemination components. We exploit the capabilities of users' devices, and establish the infrastructure on which a set of innovative and personalized services may be created and offered to users.
Given the ideas of proximity sensing and content dissemination, and how they can be used to better serve users, we proceed with an overview of our system, and how it relates to these two subjects.
2.3 System Overview
In this work we describe a system that performs proximity sensing for enabling context-aware content dissemination. The system, composed by a set of elements, works by installing several stations in areas of interest. These stations are usually small computers (but not restricted to) and are equipped with two Bluetooth dongles. One dongle, the scanner, is responsible for the capture of surrounding Bluetooth enabled devices, as the other has the responsibility to deliver content to end-users. A configuration with multiple delivery dongles is also supported by the system, as it is a configuration with solely one dongle.
The scanner feeds the information to the service scheduler, the component which has the responsibility to determine if a service is to be executed. The scheduler holds a queue of service objects and, by using contextual data received from the scanner, analyses services to determine if the constrains on which they were built upon are met. When such happens the scheduler will order for service execution, and consequent dissemination of content to the destination.
Service objects are composed by a set of flags, which determine the restrains and content associated with the object. Flags include date and time of execution, location, content location, class of device, time in range, and destination. All the indicated flags upon creation must be in conformity so that the scheduler triggers a service for execution.
addressing. This is also done because the broker is present as an intermediary element on all connections to and from stations.
Also, a central infrastructure exists. Composed by several components, it holds a database containing information which is partially replicated locally at the stations. The central infrastructure also provides for station synchronization and overall remote management.
Given the overall description of our system, it is now pertinent to discuss the potential gained benefits of deploying it.
2.4 Potential System Benefits
Basically, our system has two objectives: 1) sense nearby Bluetooth enabled devices, and 2) disseminate content according to contextual data. The process of automatically sensing devices has uses in many situations. Depending on the installation environment, stations may use the proximity sensing information to achieve objectives other than feeding the dissemination infrastructure.
For example, Bluetooth technology is useful for counting public transit passengers. With the installation of our system on public transit buses, we may exploit passengers' Bluetooth enabled devices to determine entry and exit points, as defined in [Kostakos 08]. Furthermore, the collected data would be useful for other related purposes, such as bus travel time estimation [SF 03].
Another possibility is to implement stations at environments such as commercial areas or public transit bus stops. The collected information could then be used to perform estimations on the number of people in the area. This information would also be useful for area assignment according to its affluence, or for determining how much time people spend in the area.
As data is fed by the scanner, the system has the ability to determine if action is to be taken. For example, if one device is seen continuously for a long time in a commercial area, maybe that person is doubtful on what to buy. The system would “sense” this indecision and send a recommendation to the user. Another possible application would be to offer a service that disseminates news headlines to users while they wait for a bus to arrive, or are sitting in a café.
In sum, the advantages of our system are considerable, as we enable for a low-cost and reliable method of proximity sensing and context-aware service offering. The settings on which the system may be installed are unlimited, as its flexibility frees the system from environmental restrains.
3 Public Transit Passengers' Opinions
As people daily commute from work and school to their homes, many use public transportation. Accounting for the time people both wait for and use this kind of transport, passengers can actually spend hours each day at public transit infrastructures. It is this premise that makes the deployment of a heterogeneous information dissemination system at these infrastructures interesting.
From the beginning of our work we recognized public transit as an area of great interest and potential, on which our system could be helpful. As such, and before we delved into the design and development of our system, we devised a questionnaire and distributed along public transit users. The objective was to understand their habits, the kind of equipment they use, and their personal preferences.
In this section we present the questionnaire, its results, and the inferred conclusions obtained through our analysis. Several interesting facts were brought to our attention, some of them already corroborated by previous research. More importantly, the questionnaire helped us validate important aspects of our system.
3.1 Data Summary
We begin this section by presenting the collected data. Starting 15/10/2008, data was collected until 21/10/2008. Questionnaires were distributed at several locations and times, as it is seen in Table 1. Our sample size is 105 respondets, 51 are female (48.5%), and 54 are male (51.5%). The age distribution of the individuals is depicted in Figure 2, where the 20-30 age group is the most common.
The majority of the respondents were regular users of public transportation (59%), as is seen in Figure 1. Most respondents (73%) reported they wait between 5 and 15 minutes for the bus arrive (Figure 3). Therefore, we can state, with 95% of certainty, that between 64.5% and 81.5% of public transportation passengers must wait 5 to 15 minutes for the bus to arrive.
More than 80% of respondents reported that they use their portable communication equipment while waiting for the bus. Thus, we can state that between 73.5% and 88.5% of public transportation users occupy some of their waiting time by operating their devices. Also, it seems that often respondents use their devices for messaging purposes (60%). On the other hand, accessing on-line content doesn't seem popular among the respondents (4.8%).
About 73% of respondents reported that they have a mobile device which supports Bluetooth (Figure 4). Based on this data, we can state (with 95% of certainty) that 64.8% to 81.8% of public transportation users have a Bluetooth capable mobile device.
Nevertheless, only about 11.5% of users stated that they have their Bluetooth mode enabled (Figure 5). This suggests that 5.3% to 17.5% of public transportation users have their devices' Bluetooth enabled. This data is coherent with previously obtained percentages [OKKSPFJ 06]. Security (35%) and power consumption (27%) are the main reasons for disabling Bluetooth discoverable mode, as is seen in Table 3.
Data about the preferred way of accessing Bluetooth service was inconclusive, as depicted in Figure 6. Respondents made clear that they don't want to be pushed uninteresting information unconditionally (3.8%), but are receptive to receive pushed content if it is or their interest (33.6%). They were also split between being pushed content with previous registration (31.7%), and retrieving the content for themselves (i.e. pulling content) (30.7%).
Day (October 2008)
15 16 17 18 19 20 21 Totals
T i m e of D a y
10:00 0 4 0 0 0 5 0 9
11:00 3 0 0 0 5 0 0 8
12:00 0 0 0 0 0 1 0 1
13:00 8 0 5 0 0 0 0 13
14:00 0 0 0 6 0 0 0 6
15:00 10 0 4 0 0 0 0 14
16:00 14 7 5 0 0 0 0 26
17:00 1 0 3 4 0 0 6 14
19:00 0 3 6 0 0 0 2 11
20:00 0 0 0 0 0 0 3 3
Totals 36 14 23 10 5 6 11 105
Table 1: Answered questionnaires distribution
Phone Calls Messages Entertainment Internet Other
Replied 43 (41%) 63 (60%) 37 (35%) 5 (4,8%) 0 (0%)
Table 2: Respondents' device usage at bus stops
Security Power Consumption No reason Other
Replied 37 (35%) 28 (27%) 10 (9,5%) 0 (0%)
Table 3: Reasons for disabling Bluetooth
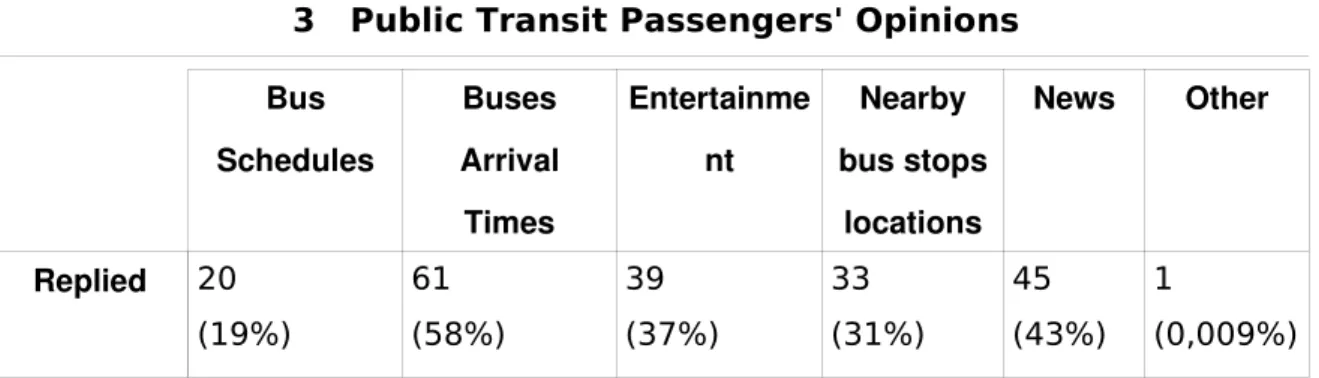
Bus Schedules Buses Arrival Times Entertainm ent Nearby bus stops locations News Other Replied 68 (64,7%) 75 (71,4%) 37 (35,2%) 35 (33,3%) 32 (30,4%) 2 (0,02%)
Bus Schedules Buses Arrival Times Entertainme nt Nearby bus stops locations News Other Replied 20 (19%) 61 (58%) 39 (37%) 33 (31%) 45 (43%) 1 (0,009%)
Table 5: Respondents services preferences while traveling
Figure 1: Respondents bus usage frequency
Figure 2: Respondents age distribution
2+ times p/day
1 time p/day
1-5 times p/week
1-5 times p/month
very rarely 0 20 40 60 80 62 8 17 9 9
Respondents Travelling Habits
Bus usage frequency
Frequency N u m b e r o f re s p o n d e n ts
10-20 20-30 30-40 40-50 50+
0 10 20 30 40 50 60 40 53 8 2 2
Respondents Age Information
Figure 4: Devices' Bluetooth support
Figure 6: Respondents preferred way of service
access 30.77% 31.73% 3.85% 33.65% Service Access Preferred ways Pull Method Push with registration Push without consent Irrelevant if information is of interest 73.33% 24.76% 1.90% Users' Devices Bluetooth support Yes No Don't know
Figure 3: Respondents waiting time at bus stops
1-5 5-10 10-15 15-30 30
0 10 20 30 40 50
Respondents Waitting Habits
Bus waitting time
Time (minutes) N u m b e r o f re s p o n d e n ts
Figure 5: Enabled Bluetooh devices
15.58%
84.42%
Bluetooth capable devices
Bluetooth state
3.2 Discussion
In this section we present the discussion of the previous results. We use as basis for this discussion the variables associations presented at Appendix A2. By describing associations and stating their major influence factors, we dervied useful information that aided us in the design and development processes of our system. Images and tables reffered along this sections are located at Appendix A3.
3.2.1 Location
• A relationship between the location where the questionnaire was delivered and the choice of a service that indicates nearby bus stops exists. Our analysis shows people that answered the questionnaire at UMa location are more inclined to want a service that indicates nearby bus stops localizations. By looking at Figure 71, we see a standardized value of 2.23 and a percentage of nearly 48%, clearly indicating that such an association exists. This could be due the fact that more that 50% of the respondents at UMa said that they wait between 10 to 30 minutes for the bus the arrive, possibly leaving them more interested in catching an alternative bus at a nearby bus stop.
3.2.2 Demographics
• Sex and device usage for messaging purposes are related. Figure 72 indicates that women seem more inclined to send/receive messages. Almost 73% of the female respondents claimed that they use their device for this specific purpose. An hypothesis that explains this is that women are more prone to use this kind of service than men.
• Age and device usage at bus stops are related. Table 8 shows us that respondents of 10-20 and 20-30 age groups make constant use of their mobile equipment while they wait for the bus. More than 50% of respondents of the 10-20 age group wait between 10 and more than 30 minutes. Also, around 39% of respondents of 20-30 age group wait between 10 and 30 minutes. An hypothesis that time is an influencing factor on device usage can be raised to explain this.
• Additionally, age and the use of mobile equipment to send messages are related. By observing Table 9, we verify that standardized residuals of -2.88 and 2.35 indicate that respondents that belong to the 10-20 age group are more inclined to use their equipment for messaging purposes. We could state that younger people tend to have less disposable income, therefore using messaging as a more economic way of communication.
• Our analysis showed us that age and wanting to access a news service while at the bus stop are related. By looking at Table 10 we observe that younger respondents are disinterested in a service as this. On the contrary, older respondents saw this as of interest to them. We could argue that, in general, younger users are less interested in certain kind of services, such as news.
3.2.3 Bus Usage and Waiting Time
• An association exists between usage frequency of public transportation and to disable Bluetooth for no concrete reason. Looking at Table 13 we observe a standardized residual of 3.05, which indicates that respondents that use the bus 1 to 5 times a week, are more prone to disable their equipment' Bluetooth for no specific reason. Maybe these respondents simply disable Bluetooth as they see no purpose in it.
• Waiting time is also related to device usage for messaging purposes. Our data indicates that people who wait between 5 to 10 minutes are less prone to use their device to send/receive messages (Table 11). This could be age related, since only 25% of the respondents of the 10-20 age group wait 5 to 10 minutes for the bus.
3.2.4 Mobile Devices Practices
• Device usage and wanting to access a news service at bus stops are related. Concretely, people who use their equipment to make/receive phone calls are more prone to want a news service (Figure 74). This could be related to age, because about 70% of respondents who use their equipment to phone have ages raging between 20 and 50+ years.
• Also, device usage is related to wanting a news service while travelling. Again, we see that users who use the device for phoning purposes are more prone to select the news service (Figure 75), which indicates a age related factor.
• People who use their device for messaging are also interested in using it for entertainment purposes. Figure 76 show us that indeed there is a tendency for those who don't use the device for messaging purposes to not use it for entertainment purposes. As seen previously, younger respondents tend to send more messages (Table 9), therefore we can assume that these same respondents are more prone to use their device for entertainment purposes.
• Device usage and disabling Bluetooth for security are related. This is seen in Figure 77, where people who send more messages are more prone to disable their devices' Bluetooth discoverable mode for security reasons. Again recalling Table 9, we can assume that this could be related to age, as younger people are more security-aware in regard to Bluetooth.
that this is related to age, where younger users are less interested in this kind of service.
• Disabling Bluetooth for power consumption reasons is related to device usage. More concretely, those respondents who used their device for entertainment purposes are more inclined to disable Bluetooth for power consumption reasons (Figure 79). We can assume that entertainment software tends to make devices' battery consume faster, therefore alerting users of the implications of Bluetooth on power consumption.
3.2.5 Types of Services
• Wanting to access detailed bus schedules while at bus stops is related to wanting to know the arrival time at the destination stop. By looking at Figure 80, we observe that people who don't chose to know detailed bus schedules also seem less interested in knowing the arrival time at the destination stop. Furthermore Figure 81 shows that people who don't want to access detailed bus schedules at bus stops, also don't want to access while travelling. We can only assume that these people aren't interested at all with time issues.
• Wanting to know nearby bus stop locations is related to wanting the same service while travelling (Figure 82). We could argue that these people are cautious and would like to know where they could alternatively take a bus in case they need it.
• Wanting to know bus stops localizations while at bus stops is related to wanting a news service while travelling. Figure 83 show us that an association between these two variables exists, as people tend to choose both of these services. An hypothesis is that these are people who like to be informed.
• Those who want to know detailed bus schedules while travelling also seem interested in knowing their destination arrival time (Figure 85). We could argue that these people are interested in time and schedule issues (contrary to what we saw in Figure 80 and Figure 81).
3.3 Implications
Having presented the data and its analysis, we now present the design implications that were inferred from the questionnaire.
As verified in Section 3.1, respondents demonstrated their interest in knowing buses time related information. Specifically, 71.4% of the respondents viewed this as an important factor. Also, 64.7% stated that having access to detailed bus schedules is a useful feature. Therefore, it seems that such services would be of interest to users.
Additionally, respondents also seemed interested in specific services as they travel. The data demonstrates that there is a preference for accessing services that help time pass as passengers travel. Such tendency is justified by the percentage of respondents who stated their interest in having access to news (43%) and entertainment (37%) services. There was also a preference by the majority of the respondents (58%) for knowing the time remaining until they reached their destination. It seems clear that the system should be flexible enough to support various kinds of services.
Interesting, and with direct relation to the previous inference, is the fact that in Section 3.2.5 we demonstrated that there is an association between wanting the same types of services both while waiting for the vehicle as while inside it. Such particularity leads us to take special attention in the flexibility of our system, as we believe that the implementation and specification of services should be sheltered from contextual factors.
interest).This indicates that various methods of content dissemination should be supported.
4 State of The Art & Related Work
Throughout this section we present and review a number of fields that relate with our work. The purpose is to review concrete subjects, identify their foundations, and specify why they are important to us.
We begin with a horizontal review directed at more encompassing areas. Information Capture & Dissemination, Intelligent Transportation Systems, and Distributed Systems are example themes we present. The purpose is to first contextualize our work at a higher abstraction level, before drilling into more specific subjects.
Thereafter, our discussion will be directed at the areas of Bluetooth and Context-Aware Computing. Aspects will be reviewed more thoroughly, as our work is more closely related to these areas.
4.1 Broad View
By first providing a broad view we hope to better contextualize our work. As several fields contribute to our system specification, we fell that multiple aspects of dissimilar nature need to be discussed.
4.1.1 Information Capture & Dissemination
The capture or collection of information has always been viewed as of extreme importance. Possessing data about a subject is what enables us to study and better understand it. Without it, our view of specific subjects would be limited and incomplete, as the ability to perceive possible implications, and determine the influence of external factors would be diminished. The field of statistics is the most well know example of this. Information collection is the pillar that supports statistical analysis and inferences. For obtaining conclusions about a survey, for example, data must be collected and analysed.
the own individual on which information needs to collected that reports back to specialized personnel, as is common in several types of studies. Or, taking another example, there may be a manual observation of some phenomenon, as there is when manual methods are used for counting passengers that alight a bus.
Problems associated with manual methods of information capture and collection are mainly associated to their cost, and to some point to their limited nature. Hiring individuals to collect information of thousands of persons is an expensive process. First, it is expensive at an operational level, as individuals are usually hired externally to the company. Secondly, information is easily outdated, as manual collection is done sporadically and with pre-determined goals in mind, and therefore fails to provide both an up-to-date view on the subject on which information was collected, as well as using it on other subjects. Thirdly, it lacks accuracy, as the sample size obtained with manual data collection tends to be significantly smaller than with automatic methods. Finally, manual information capture is limited in its scope, as it unsuitable for several types of activities, such as localization.
The term automatic information capture is defined as the action of identifying objects and collecting data about them in an automated way [VK 07]. Naturally, and contrary to manual methods, automatic techniques utilize computers to accomplish this task. The information is collected and posteriorly manipulated using electronic means, therefore dismissing human intervention altogether. The objective is to improve the efficiency of data collection as a process, which translates to reduced costs, more accurate results and overall is seen as beneficial to organizations. Automation of data capture is already seen as paramount in civilized countries, as several fields such as health informatics depend heavily on it [Norris 02].
these methods have their peculiarities, as each one of them is more suitable for delivering content under different contexts.
Reportedly, the push model is more efficient when a large number of clients is present, and the pull model is more indicated for a small number of clients [TO 00, AFZ 97]. The justification is that the pull model depends heavily on the client-server model, and therefore is, at an architectural level, more prone to efficiency problems due to the fact that it must potentially handle a large number of requests simultaneously. The push model is sheltered from this limitation, as it is independent of the number of clients listening for content. The content is disseminated using broadcasting protocols and algorithms, and therefore the efficiency of the process is shielded from eventual misses that may occur. Of course this last assumption is made by with the presupposition that we are using technologies that support broadcasting, which is not always the case. Also, it is not always suitable to use unreliable methods for content delivery, as important information such as delivery success rates are very difficult to collect.
It is currently known that it is beneficial to conjugate the two described models of information dissemination. This is easily understandable, as each one works better when certain conditions are met. Therefore, it seems only logical to assume that merging the two of them would be advantageous. A generic architecture of this kind is present by Tan & Ooi [TO 00], as they define it as an integrated dissemination model. Acharya et al. also proposes an integrated model based on the Broad-Cast Disk approach [AFZ 95]. It uses both push channels and a point-to-point pull channel that they define as a pull-based backchannel [AFZ 97]. This pull channel would then be used to send requests to the content distribution source.
Our work relates to the notions here presented. The system functions by installing stations at target areas, automatically capturing Bluetooth enabled devices. Furthermore, the system uses this information to feed the content dissemination infrastructure that uses a push-only method to deliver content to users.
and may be seen as being part of the broader field of Intelligent Transportation Systems (ITS). For this reason, we discuss ITS in the ensuing section.
4.1.2 Intelligent Transportation Systems
ITS is a set of interrelated fields whose purposes are, among others, to achieve better transportation efficiency and diminish the environmental impact that self-propelling vehicles have [FJMFC 01]. ITS is of particular sensitivity to scientific and technological innovations, which can be exploited advantageously in transportation related areas. It is usually said that the global purpose of ITS is to use appropriate technology to add “intelligence” to infrastructures, vehicles and their users [FJMFC 01]. ITS does gather enormous worldwide interest both from transportation professionals, the automotive industry and from governmental entities alike.
implemented. Another option is to enforce passengers to present their travelling titles at exit points. These solutions are far from optimal, as forcing title presentation is considered to be non-practical, and use of sensors and cameras is bound to have a large operational cost. A valid low-cost and reliable solution is that presented by Kostakos [Kostakos 08]. A Bluetooth scanner is implemented aboard a bus, as it perpetually scans for nearby devices. Posteriorly, the gathered data is interpolated with the public transit AVL data, and both passengers' entry and exit points are successfully inferred. Results are representative, and intrusiveness is non-existent.
Our system is somewhat related to the concepts previously described. We could possibly install the system both inside public transports, as in public transit infrastructure, such as bus stops. The installation in public bus stops would be interesting, as it would give us the ability of studying passengers' waiting habits, as well enable for the dissemination of a rich set of context-aware services, such as estimated transport arrival time, real-time vehicle position determination, among many others. Additionally, installing the system inside public transportations, such as buses would provide for the derivation of O/D matrices, as described in [Kostakos 08].
With this in mind, it becomes interesting to present and describe O/D matrices and their importance.
4.1.3 Origin-Destination Matrices
Origin-Destination (O/D) Matrices are an essential tool in transportation analysis. This structure has strategical importance in transit agencies due its relevance in both analysis and planning activities. O/D Matrices used in public transportations are simply structures that contain information about the passengers' flow along the various nodes that constitute the network.
What is usually observed in such type of public transit vehicles is the use of manual methodologies to perform O/D Matrix estimation. Data is collected through the execution of a survey, and by applying one of several possible statistical techniques the O/D Matrix is inferred. An overview on the kind of statistic methods normally used is seen in [Ben-Akiva 87]. The main issues with this kind of estimation are related to the high operational costs of executing the surveys. For this reason, and for the fact that surveys are not actually executed with O/D Matrix derivation in mind, these tend to happen very sporadically, and fail to reflect fluctuations that possibly happen in a timely manner [Cui 06].
Additionally, and when entry points are automatically collected, there is the possibility of O/D Matrix estimation using only passengers' entry points information. This kind of situation (e.g. exclusive automatic entry point collection) is widely seen both in trains and buses, as usually these transportations enforce title presentation at or before vehicle boarding. Systems that perform O/D Matrix estimation using solely origin-only data have already been proposed for both rail systems [ZRW 07] as well as public transit buses [Cui 06]. Independently on the the quality of the obtained results with these mechanisms, it is well known that the determination of both entry and exit points leads to more accurate and representative O/D Matrices [Gordillo 06]. This affirmation is understandable because if we automate passengers' entry and exit points capture, we remove the need for human interference, and turn the derivation process solely a matter of electronic manipulation. Costs are reduced, results more accurate, and the frequency on which derivation is obtained attenuated [Cui 06].
4.1.4 Sensor Networks
As ubiquitous computing [Weiser 93] sees widespread use, everyday objects gain the potential in becoming artefacts with computational and sensing capabilities. Hence, the notion of a set of interconnected sensors gains wider acceptance. A sensor network may be seen as a set of small nodes which have limited computational power and memory, and a sensing module. Several particularities must be met in order for a set of sensors to be classified as a network. One of the most important is the small computations that each sensor usually performs, so that centralized computation efforts may be relieved [ASSC 02]. Also, it is very common for these nodes to perform cooperative work, therefore augmenting the accuracy and overall sensing capacity achievable by means of individual sensors [HKB 99].
In order for the individual sensors to form a network they must be interconnected. Wireless technologies are seen as ideal for this purpose as they require no direct physical connection, therefore retaining the unobtrusive nature of ubiquitous computing [HKB 99]. Naturally, several technologies can be used to achieve this, as some of them are inappropriate due to their inherent complex stack protocol [LDB 03]. Each node in a sensor network maintains its functionality as if they were independent of all other nodes. This allows, among other things to increase resistance to failure, as the network functionality is unbounded to any specific component. Each node has a respective mission and collects its own contextual data. Naturally many types of data may be gathered by sensors, being one of them individuals/equipment sensing.
deployed are restricted to non-extreme settings, as they don't hold the capability of enduring such hazardous environments.
With the previous assertions in mind, there are some characteristics of our system common to sensor networks:
• The system performs sensing through the use of Bluetooth. All stations have this capability, as the information is posteriorly stored centrally.
• The system is fault tolerant. It has the capacity of enduring individual node failure, ensuring overall functionality even when individual nodes fail [SSJ 01, HSA 00].
• The nodes exchange information with each other and execute cooperative labour, although indirectly. This is done using the central infrastructure, which queries individual nodes, and posteriorly delivers relevant information to the remaining nodes, ensuring synchronization and that no redundant information dissemination is done. Curiously, we use this synchronization approach to resolve a common problem of sensor networks – sensor overlap [HKB 99], in which is very common that two nodes overlap their sensing activities, therefore sending replicated data to another node.
As we presented the similarities that bound sensor networks with our work, it is now opportune to refer to another relevant field on our work – Distributed Systems (DS).
4.1.5 Distributed Systems
A DS can be thought of as a logical grouping of a set of functionalities when the components that constitute the system are physically separated. In other words, a DS is a set of inter-connected components – by means of a network – that work together in order to achieve specific common goals [CDK 05]. Various subjects such as CORBA [Bolton 01] may be discussed within the field of DS, but to our work we are mainly interested in three specific topics:
(a) The characteristics that define a DS
(b) The notion of a distributed database
For a system to be though of as a DS it must conform to a set of characteristics like autonomous component functionality. The components that constitute the system have only a limited and restricted view of the system as a whole, as they have no specific domain knowledge of other components, and therefore perceive the system in a very restricted way [CDK 05]. Also, the ability to endure component failure is a common particularity of DS. Recalling the definition of sensor networks (which is a particular kind of DS), it was seen that functionality should be unarmed even when individual components, for some reason, cease to function to their full potential.
Also, and relation to point (b), the notion of DS is also extended to data repositories. As the volume of information exponentially grows, it is very common to see repositories that spawn over several physical locations. The simplest architecture used in distributed databases is that of multiple-client/single-server [OV 99]. The server holds the actual Database Management System (DBMS) which maintains system wide information. When needed, the clients proceed to remote repository access (which can be direct or indirect) storing and/or retrieving information accordingly. Naturally, this way of data distribution has associated particularities. Namely, replication is achieved [OV 99, CDK 05]. We have the system wide data in the server, but a percentage of that data is replicated locally at the clients. This allows, among other things, to gain additional access speed, since the need to constantly contact the server for database related actions is removed. Further, using distributed databases schemes such as this allows for easy information recovery. In case of local data corruption we may proceed to recovery by querying the database. Finally, concurrent access to the database is fairly straightforward, since only the server entity is preoccupied with such issues.
access is known as location-aware computing and it plays a major role in the specification of our system. We discuss this subject latter in our work.
Our system is perceived as a distributed system. It is composed of several physically dispersed components that work with each other to achieve global goals. Also, the system is not strictly dependent on any of these individual components to maintain functionality, as it can handle failure. In the individual nodes we make use of a DBM [BN 92] engine in order to achieve local replication and persistence. A central component with a RDBMS exists, as it holds information related to all individual components. Finally, and as we disseminate information to mobile equipment, these may be seen as nodes that are part of a more complex and distributed system.
After this overview of distributed systems we proceed to the description of the mechanism that actually makes distributed systems a reality. For this reason we present a discussion about Inter Process Communication (IPC) methods in the following section.
4.1.6 Inter Process Communication
A process is the execution of a program and consists of a set of bytes which a CPU interprets [Bach 86]. In typical UNIX and UNIX-like systems, processes are loaded in memory and have several types of information related to them, including the text segment (e.g. machine instructions), initialized data, uninitialized data, the stack and the heap [Bach 86, SR 05]. A process is then an instance of a program which has associated to it a set of resources. As processes are forbidden of accessing each own resources directly, a mechanism for allowing inter-communication is required.
asynchronous events (signals), as others are designed to handle synchronous events (named pipes). Still, others have the ability to handle both types of events. The most known example is that of sockets, where modern operating systems and programming languages define an Application Programming Interface (API) that supports both blocking (synchronous) and non-blocking (asynchronous) versions of these.
Sockets – more concretely Internet sockets – are one of the building foundations of inter-network communications. An Internet socket is in fact a pair formed by two entities: the IP address of the target host and the port on which a process is listening to. Virtually all modern operating system provide a TCP/IP implementation in their kernel which is composed by three distinct layers [WS 95]: the socket layer, the protocol layer and the interface layer. As the socket layer – and consequently sockets – is situated the nearest of the application layer, it provides for an abstraction between applications and underlying transportation layers such as TCP and UDP. Processes therefore use specific function low-level invocations (e.g. system calls) so that IPC using sockets can happen in a transparent and compatible way between processes, that can be separated by different networks, different underlying protocols, different operating systems and even different applications.
In sum, IPC mechanisms are essential to our system because of the following reasons:
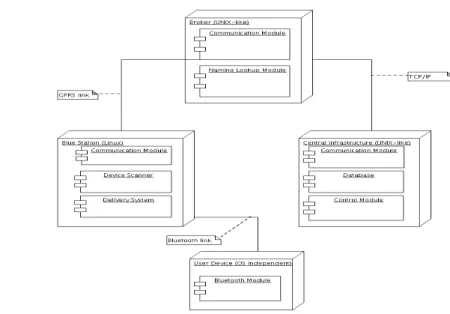
(a) Our system is a distributed system composed by three separate entities: nodes situated at public transit infrastructures; a broker responsible for name lookup and connection establishment; a centralized infrastructure
(b) All entities described above need, at some point, to execute several operations simultaneous. By using a multi-process paradigm we can fulfil the system's needs.
The discussion of IPC mechanisms marks the end of our broad view of related work. Throughout this section several issues were discussed, as they where used to lay the foundations on which the ensuing chapter and included subjects are built upon.
4.2 In-Depth View
In this section a more meticulous review and discussion is performed. The subjects discussed within are less far-reaching than those seen in the previous section, but the contribution they have in defining and contextualizing our work is greater. For this reason, a more through scrutinization is made. In concrete two subjects are discussed: Bluetooth wireless technology and Context-Aware computing.
4.2.1 Bluetooth Wireless Technology
Bluetooth is a radio wireless technology whose development started in the mid 1990s. It has over the years gained increasing acceptance, as its presence is noticed in virtually all recent electronic equipment, such as PDAs, mobile phones and personal computers. The world-wide adhesiveness of Bluetooth technology is demonstrated by the estimated 520 million devices that supported it in 20061.
Several particular characteristics differentiate Bluetooth from other wireless technologies. Its low cost and low power consumption justify why there is such a widespread integration on electronic equipment. Furthermore, and comparing for example with Infra Reds (IR), which are also commonly present in mobile equipment, Bluetooth works by transmitting and receiving the radio signal in a omnidirectional manner, therefore dismissing the need for having line of sight or antenna directionality.
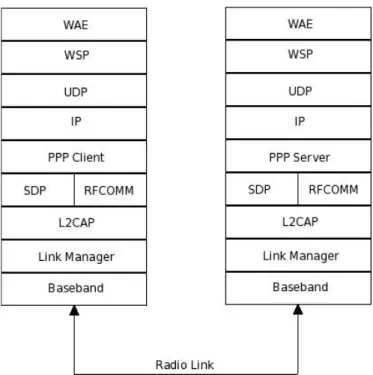
More technically, Bluetooth is composed by a set of interconnected layers. This layer oriented specification is much common in networking communication stacks, as the most known examples are the TCP/IP and OSI models [SFR 03]. The purpose for dividing communication stacks into several layers is to allow for heterogeneous host systems to communicate using solely
common logical agreements – the protocols [Stevens 94]. Figure 8 shows the disposition of the layers and the belonging protocols [Bisdikan 01].
4.2.1.1 Bluetooth Lower-Levels
The Bluetooth radio operates at the 2.4GHz unlicensed Industry Scientific and Medical (ISM) band. As this is a free band, many components potentially operate at the same frequencies. In fact, the IEEE 802.11x family of wireless technologies uses this specific band. This leads to situations of interference when both technologies are in the same operating range. Manufacturers are aware of this, as the devices which operate at this band must be able to share frequencies and tolerate interference. By using a Frequency Hopping Spread Spectrum (FHSS) technique, Bluetooth manages to reduce interference, as well improve security measures of the technology [Wang 01]. The radio therefore employs a pseudo-random algorithm, executing 1600 hops/sec over a bandwidth of 79 one-megahertz channels. The frequencies on which Bluetooth operates are therefore specified by the following expression:
f
=
2,402
k
MHz ,
0
≤
k
≤
78
Even though FHSS and error coding techniques are used for minimizing interference, Bluetooth inter-operability with WLAN (e.g. IEEE 802.11x) leads to higher packet lost probability, and consequently to undermined performance for both of these technologies [GCR 03].
Bluetooth has three distinct classes: class 1, 2, and 3. Class 1 devices are the most powerful, and consequently transceivers of this type can communicate within 100 meters of each other. Class 2 transceivers are the most commonly used, due to their balanced power consumption and range. These devices are present in virtually all commercial mobile equipment, and can establish connections up to 10 meters from each other. The less powerful devices are those which belong to class 3. Their power consumption is minimum, and for that reason wireless communication can only be established if devices are up to 1 meter from each other. Figure 7 demonstrates the differences that exist between range radius of Bluetooth classes.
range is limited by the class 2 transceiver lower power output. On the other hand, using such configuration allow us to extend the class 2 transceiver beyond the 10 meters limit, but nowhere near 100 meters. Nevertheless, it is possible to use specialized hardware such as high gain antennas, so that long range Bluetooth communication is possible.
Moving to the baseband protocol, it is situated just above the actual physical radio transmission medium. Baseband defines how Bluetooth links are established, how Bluetooth networks are created, how transmission medium is
Figure 8: Bluetooth Protocol Specification Figure 7: Bluetooth classes
shared, and also define the structure of the low-level packets [Bisdikan 01]. Each Bluetooth device has associated with it a unique 48-bit address (BD_ADDR), which can be though off as the equivalent of a Ethernet MAC address. Individual identification becomes possible due to this feature, as no two addresses are equal. Associated to each Bluetooth device is also a 28-bit clock value. For communication to be initiated between two Bluetooth devices, interventionists must exchange both the BD_ADDR and clock values. A network of Bluetooth devices is formally defined as a piconet, and in each piconet there must be only one master and up to 7 slaves. Optionally, there is the ability to inter-connect piconets, therefore forming a scatternet. No direct communication between slaves within a piconet can exist, as the master unit acts as a routing element. Also, for communication to be effective and full-duplex supported (e.g. transmission and receiving happening simultaneously), a Time-Division Duplex (TDD) technique is used for sharing the bandwidth available. In practice this means that each device is allowed only to transmit for 625 µs at a time, in each channel (or frequency), although a packet can be
separated along 1, 3 or 5 distinct channels [Wang 01]. It is the master's unit clock which identifies the frequency or channel on which transmission is going to happen. For this reason, a Bluetooth device can only be master on one piconet. Also, master units will transmit only on even-numbered slots (e.g. 625
µs time units), and slaves will transmit only on odd-numbered slots.
For a piconet to be created some steps must be performed. If the master already knows the address of the slave, then the inquiry phase may be skipped. This phase consists of locating devices and obtaining their address and clock values. It works only if the inquired device is in discoverable (or inquiry scan) mode, and the inquiring device transmits inquiry messages. The discoverable device will then respond by sending inquiry reply messages, which, among other things, contain the address and clock values. Naturally, the devices which are set to discoverable mode need to continuously check for inquiry requests, which leads to increased power consumption, even when Bluetooth isn't actually being used by the user.
vicinity. The Bluetooth specification states that in an error-free environment, an inquiring device must spend 10.24 seconds (i.e. 8 * 1.28 seconds) in order to discoverable all surrounding Bluetooth enabled devices.
After the details regarding specific devices have been determined, the master can then proceed to invite elements to join the piconet. This process is known as the paging phase, and works similarly to the inquiry phase. First, a device must be set to connectable (or page scan) mode. Then, the device that wants to initiate the communication – the paging device – will transmit a paging message to the connectable device. This later device will then reply with a page response message, sending its details over the communication channel. After this, the piconet can be created. A device that is set to connectable mode also needs to perform periodical scans, and therefore also contributes to increased power consumption, although less than those devices in discoverable mode.
Devices actually communicate through the exchange of baseband packets. Each packet has a 72-bit Access Code (AC) field, a 54-bits header and a 2746-bit payload. Although this is the base structure of baseband packets, several packet configurations can be made. The only field that is required to be present at all times is the AC, which is used exclusively when we have a baseband packet of type ID [Bisdikan 01]. In order for packets to be exchanged a link must be established. Two kinds of links can be established when using Bluetooth. Asynchronous Connectionless (ACL) links are the most used type, and provide no Quality of Service (QoS) mechanisms. On the other hand, this Best-Effort link does provide for integrity using retransmissions, and uses error correcting techniques. Also, there is the possibility of establishing Synchronous Connection-Oriented (SCO) links. Although SCO does not allow for retransmission, its link symmetry and constant rates, make it ideal for voice communication between Bluetooth devices.
simple challenge/response mechanisms is used for authentication [Bisdikan 01, GPS 04]. The first time two devices met, it is necessary to use a Personal Identification Number (PIN) for initializing the authentication process. After PIN data has been correctly inserted, the authentication process will from then forward dispense the use of a PIN, as it will utilize a 128-bit authentication key. The authentication process can in reality be dismissed all together, as some application profiles don't need to perform authentication for exchanging information. Furthermore, upon link establishment encryption can be set using the previously known link key used for authentication. The LMP also allows for usage of low power modes. These are used to reduce ower consumption, but also to allow for multiple operations to happen simultaneously. This is why although the limit for a piconet is of 7 slaves + 1 master, by using power modes we can get up to 256 slaves (in parked mode) in a piconet. Also, it is in this layer that friendly name requests are made, as each Bluetooth device may have a name associated with it. It is very common for mobile equipment to also discover friendly names upon inquiry requests, but this delays the procedure, as it is necessary to establish a connection between devices [AK 05].
The Logical Link Control and Adaptation Protocol (L2CAP) is the layer most closely situated to the host system (an can in fact be implemented at the host). L2CAP takes care of care of datagram segmentation and reassembly, multiplexing of service streams, and QoS issues [GPS 04]. The main purpose of the L2CAP is to work as a translating unit between the higher-level Bluetooth protocols that run in the host, and the lower-level protocols that run in the Bluetooth device.
4.2.1.2 Bluetooth Middle-Levels
HCI firmware implementation can be neglected [GPS 04]. A common example of this is a Bluetooth headset.
The protocols included in the middleware layer are usually implemented at the host level. They work to alleviate the higher level protocols from Bluetooth concrete specifications, abstracting the communication process. An important protocol that lies within this layer is the Service Discovery Protocol (SDP). Its function is to determine the hosts' available services, and to collect information on how to use them. A Bluetooth service is defined by Universally Unique Identifiers (UUIDs), which are used to describe services' names and attributes. The RFCOMM protocol is also widely used in Bluetooth communications. It is an emulation protocol that creates a virtual RS-232 (e.g. serial) link between devices. RFCOMM enables for several types of applications to work using Bluetooth. Examples include object exchange (OBEX) between devices, point-to-point connection establishment (PPP), and telephony control signalling (AT) commands.
4.2.1.3 Bluetooth Profiles
At the top of the Bluetooth stack reside the specifications that allow for construction of compatible applications. These specifications are called profiles, and they define the conditions which must be followed for inter-communication between devices to happen. All profiles are extensions of the Generic Access Profile (GAP), as new profiles can be devised upon existing ones. This allows for creation of profile hierarchies, as this the case of the Object Push Profile, which is based upon the Generic Object Exchange Profile, which in turn is based upon the Serial Port Profile [Bisdikan 01, GPS 04].
4.2.1.4 WAP over Bluetooth
component, users can make use of it to access a set of services by means of a Bluetooth link. Figure 9 [AL 00] demonstrates the involved layers in order for this to be accomplished. Additional information on WAP over Bluetooth can be seen in [AL 00].
With this section we gave a detailed overview of the Bluetooth Wireless Technology. We described the stack that enables for Bluetooth inter-communication, and verified that it is common that higher-level layers to be implemented outside the actual Bluetooth device. Bluetooth profiles were also discussed, and the versatility of the technology was mentioned, as we saw that is possible to combine external communication stacks with Bluetooth.
Bluetooth has great relevance on our work. First, our system uses the Bluetooth inquiry capabilities to continuously scan for nearby discoverable devices. Secondly, we utilize Bluetooth SDP and profiles to perform content delivery. As devices are discovered, the system determines if a pre-defined service exists which has that address as destination. If it does, the system tries and push – using OBEXPUSH – the content to the user. As usually we are interest in nearby devices, we limit our scanning capabilities with the use of a
Figure 9: Client/Server communication using
class 2 dongle. On the other hand, as we are interested in maximizing delivery capability, we use a class 1 dongle for content delivery.
This notion of using a wireless technology (Bluetooth) to delivery content at specific locations and under specific conditions, leads us to another crucial notion in our work – Context-Aware Computing. What Context-Aware Computing is and how does it influence our work is what we describe in the ensuing section.
4.2.2 Context-Aware Computing
Multiple aspects must be taken into consideration when defining an element's context. Information like location, time, and weather are all valid factors that contribute to the delineation of the context on which an element is inserted into. Context-Aware computing is a field on which contextual information is the central element on defining the behaviour of hardware and software systems.
4.2.2.1 Location-Aware Computing
Historically, Context-Aware computing is an extension of the notion of Location-Aware computing. Aalto et al. [AGKO 04] define a Location-Aware service, as a service whose behaviour is mostly determined by location information. In their work, they developed a push-only dissemination system, entitled B-MAD, which uses Bluetooth and WAP to perform content delivery. Users must pre-register their Bluetooth address and phone number for receiving content. Thereafter when a user is in the vicinity of a Bluetooth station, this element will flag a centralized ad server using a WAP connection. Consequently, the ad server will send the Bluetooth station information so that content is delivered to the end user using a Short Message Service (SMS) message. The main problems with this approach are the need for disclosing phone numbers, and the constant communication with the centralized server leading to additional latency.
analogous to GPS. To achieve this, the unique Basic Service Set Identifier (BSSID) – which corresponds to an Ethernet MAC address – is used to create a database that associates Wi-Fi access points to a certain location. The Place Bar would then query the database for determining the current location, and thereafter direct the user accordingly. Although this is an interesting concept, the current proliferation of Wi-Fi spots makes the maintenance of this database a very difficult job. Also, users would need to download specific software for this functionality to be enabled in their devices. Other interesting developments in Location-Aware computing include the creation of the Vehicular Information Transfer Protocol (VITP), which is used for creating services over Vehicular Ad-hoc Networks (VANETs) [DFNI 07]. The purpose would be to facilitate decision, by providing traffic related information such as traffic congestion points, therefore working as an enhancer of already common employed technologies such as on-board GPS. Harter et al. [HHSWW 99] developed a system which provided 3-D modelling and localization of users inside a building. The usage of ultrasonic transceivers, referred to as Bats, provided the information necessary to successfully locate users inside a closed space, a task usually made difficult due high interference levels which make radio-based and electromagnetic techniques non-optimal. The interesting point here is to note that these previously described applications are mostly driven solely by one contextual aspect – location.
4.2.2.2 Context-Aware Multidimensionality
Context-Aware computing introduced new dimensions on which applications behaviour could be specified. Although location still plays an important role in defining context, other important factors such as temporal and physical aspects play an active role in specifying context. The own notion of context in computing is far from being commonly agreed upon. In our opinion, the best notions which define Context-Aware are those mentioned by Schilit et al. [SAW 94] and Chen & Kotz [CK 00], where the authors define context in four distinct categories:
• Computing context – such as networking and connectivity
• User context – such as location and profile specification
• Time context – such as time, day of week and day of year
This multidimensional aspect of context is again mentioned by Schmidt et al. [SBG 99], where additional dimensions are considered to influence contextual specification. Further, Dey & Abowd [DA 99] categorize contextual factors as being primary and secondary. They argue that factors as location, time, activity, and identity are to be considered primary aspects, as they convey the power for inferring additional types of information. The authors also provide a taxonomy of Context-Aware features, in which they define as being part of one of three categories:
• Presentation of information and services to a user
• Automatic execution of a service
• Tagging of context to information for later retrieval
In sum, it seems clear that defining context is not straightforward, as many aspects come into play due the dynamic nature of the environment.
4.2.2.3 Context-Aware Applications
be to route a message to a visitor which had an Active Badge, even if the user didn't posses a pager. In that case, the message would be routed to the closest person of the required destination.
The Cricket system is defined as location-support infrastructure [PCB 00]. It works in a decentralized manner, using beacons to transmit signals to listeners, that the latter can use to determine position within a building. It works by using a technological combination of Radio-Frequency (RF) and ultrasonic signals. The beacons disseminate these signals periodically, and the listeners use this information along with an inference engine to determine current position. Contextual location related information (e.g. position and distance) are used to determine the possible position of users.
Rukzio et al. [RSH 04] devised a system that uses physical posters for content dissemination purposes. Encoded images are embedded into the posters, as users utilize their mobile devices cameras to capture images, and consequently send them to a server located in the vicinity of the posters. This is accomplished through a Bluetooth link. The server will, upon image reception, use image recognition software to determine the correct content to send to the user. For the system to work, the user most download a Java based application, termed as a Simplicity Personal Assistant (SPA).