ABSTRACT:Introduction: Urban transit accident are a global public health problem. The objective of this study was to describe the proile of the victims and the occurrences of urban transit accidents attended to by emergency mobile care services (Serviço de Atendimento Móvel de Urgência- SAMU) in Recife, and their distribution based on spatial analysis. Methodology: An ecological study, developed through secondary data from emergency mobile care services in Recife, referring to the total number of occurrences of urban transit accidents attended to from January 1 to June 30, 2015. The spatial analysis was performed using the Moran index. Results: Basic support units performed most of the emergency services (89.2%). Among the victims, there was a predominance of males (76.8%) and an age group of 20 – 29 years old (31.5%). Collisions were responsible for 59.9% of the transit accidents, and motorcycles for 61.6% of the accidents among all means of transportation. Friday was the day that showed the highest risk for treatment, and there was a concentration of events between 6:00 am – 8:59am and 6:00pm – 8:59pm. The MoranMap identiied critical areas where calls came from traic accidents during the period analyzed. Discussion: The records of the mobile service from the spatial analysis are an important source of information for health surveillance. Conclusion: The spatial analysis of urban transit accidents identiied regions with a positive spatial correlation, providing subsidies to the logistical planning of emergency mobile care services. This study is groundbreaking in that it ofers such information about the region.
Keywords:Traic accidents. Emergency medical services. Spatial analysis. Health services research. Uses of epidemiology. Descriptive epidemiology.
A spatial analysis of urban transit accidents
assisted by Emergency Mobile Care Services:
an analysis of space and time
Análise espacial dos acidentes de trânsito urbano atendidos pelo Serviço de
Atendimento Móvel de Urgência: um recorte no espaço e no tempo
Marcela Franklin Salvador de MendonçaI,II, Amanda Priscila de Santana Cabral SilvaI ,
Claudia Cristina Lima de CastroI
ORIGINAL ARTICLE / ARTIGO ORIGINAL
IHealth Secretary of Recife – Recife (PE), Brazil.
IIProfessor Fernando Figueira Institute of Integral Medicine– Recife (PE), Brazil.
Corresponding author: Marcela Franklin Salvador de Mendonça. Rua da Macaiba, 46, III Etapa, Rio Doce, Olinda, PE, Brasil. E-mail: [email protected]
INTRODUCTION
For several years, the United Nations (UN) has recognized urban traic accidents as a serious public health problem worldwide, because they are accompanied by high morbidity and mortality rates1,2. Approximately 1.2 million deaths a year result from traic accidents. Of those deaths, 90% occur in low- and middle-income countries3.
Brazil is one of the leading countries in mortality rates from urban traic accidents. The majority of deaths and hospitalizations caused by these accidents are observed among males, black people, young adults, individuals with low education and motorcyclists4-8.
The high rate of urban traic accidents in the country may be associated with the Brazilian culture of people using public spaces as if they were their own, so that motor vehicles are seen and used as an instrument of power, lead to civil disobedience with regard to traic laws and are connected to alcohol consumption9,10.
States in the Northeast of the country had increased mortality rates from urban traic accidents11. There were also reports of less frequent seat belt use in both the front and rear seats, greater proportions of accidents involving bicycles and motorcycles, in addition to victims who claimed to have stopped performing usual daily activities due to injuries result-ing from traic accidents12.
In Pernambuco, there was a growth of 875% in the mortality coeicient of motor-cyclists per 100,000 inhabitants between 1996 and 2006. The observed increase in the
RESUMO:Introdução: Os acidentes de trânsito urbano são um problema de saúde pública mundial. Objetivou-se descrever o peril das vítimas atendidas pelo Serviço de Atendimento Móvel de Urgência (SAMU) no Recife e das ocorrências por acidentes de trânsito urbano, bem como sua distribuição a partir de análise espacial.
Metodologia: Estudo ecológico, desenvolvido a partir de dados secundários do SAMU no Recife, referentes às ocorrências dos acidentes de trânsito urbano de 01 de janeiro a 30 de junho de 2015. A análise espacial se deu por meio do índice de Moran. Resultados:As unidades de suporte básico realizaram a maioria dos atendimentos (89,2%). Entre as vítimas, houve predomínio do sexo masculino (76,8%) e da faixa etária de 20 – 29 anos (31,5%). A colisão foi responsável por 59,9% dos acidentes de trânsito, e as motos representaram 61,6% das ocorrências entre os meios de locomoção. A sexta-feira apresentou maior risco e houve concentração de acidentes das 06h00min. às 08h59min. e das 18h00min. às 20h59min. O MoranMap identiicou áreas críticas para a ocorrência de atendimentos durante o período analisado. Discussão:As ichas de atendimento do SAMU, a partir da análise espacial, coniguraram-se como importante fonte de informação para a vigilância em saúde. Conclusão: A análise espacial dos acidentes de trânsito urbano identiicou regiões com correlação espacial positiva, proporcionando subsídios ao planejamento logístico do serviço de atendimento móvel de urgência. Este estudo é pioneiro ao contribuir com tais informações na região.
production of motorcycles is a possible explanation for the increased accidents involving this type of vehicle13.
Pedestrians, cyclists and motorcyclists are groups of victims who, in addition to rep-resenting half of all deaths by traic accidents worldwide3, greatly impact the frequency of occurrences (about 89%) in emergency hospital units and the Emergency Mobile Care Services (Serviço de Atendimento Móvel de Urgência-SAMU) 14,15.
SAMU, an important mobile pre-hospital component of the National Emergency Care Policy, launched in 200316, is a 24-hour free service that provides guidance and sends manned vehicles containing trained staf. It is accessed through a telephone number and activated by an Emergency Regulation Center17.
Currently, SAMU serves 75% of the Brazilian population17. In Recife, SAMU was inaugu-rated on December 21, 2001. As the capital of Pernambuco, Recife hosts the headquarters of the Metropolitan SAMU Medical Regulation Center of Recife. The headquarters regu-lates 17 municipalities in the Metropolitan Region18.
In Brazil, the Ministry of Health (MoH) has supported states and municipalities to increase their ability to implement surveillance interventions and prevent deaths and injuries caused by traic accidents19. An example of this support is the Life in Transit Project, (Projeto Vida no Trânsito), which is part of a bigger project called Traic Safety in Ten Countries (Segurança no Trânsito em Dez Países)20, which has the objective to aid managers through training, plan-ning, monitoring, follow-up and intervention evaluation11.
In order to subside possible policies for the prevention of urban traic accidents, spatial analysis is considered a powerful public health tool. It makes spatial patterns of a phenomenon visible, even with sparse data, 21 through the construction of maps, and through the mapping of risk factors in the population 22,23. The spatialization of traic accidents is important in order to provide subsidies for the planning and execution of public policies, which increase the efectiveness and eiciency in reducing and prevent-ing these injuries24.
The present study had the objective of describing the proile of victims served by SAMU in Recife and the occurrence of urban traic accidents, as well as their distribution based on a spatial analysis.
METHODS
The present study was of ecological design and was developed through the collection of secondary data from Recife’s SAMU database. It looked at the total number of urban traic accidents from January 1st to June 30th of 2015.
was estimated by the Health Department of Recife for 2015, and had 1,598,096 inhabitants. The study included 1,225 victims of urban traic accidents that were attended to by the SAMU of Recife.
The following were described: the type of ambulance, the destination facilities, the vic-tim’s condition (gender, age range, means of transportation) and the nature of the accident (collision, vehicle tipping or rolling over, crashing into ixed objects, being run over and fall-ing in/from the vehicle). Relative frequencies and relative rates were calculated considerfall-ing the resident population (incidence rate: IR; number of occurrences/population exposed for every 10,000 inhabitants).
The statistical analysis was performed using the BioEstat 5.3 program. Poisson’s regres-sion was used in order to estimate the relative risk (RR) and the conidence interval values of 95% (95%CI) of the association between days of the week, time and neighborhood of the accidents. Tuesdays were considered the reference day (for week days) and the period from 12:00am to 2:59am (for operating hours), due to the low low of people who could inluence the occurrence of the accidents.
The neighborhood was the spacial unit adopted. Maps were constructed with the absolute distribution of the total numbers of visits (equal intervals) and of RR (quar-tile). Subsequently, a spatial analysis was performed, with the objective of identifying clusters with statistical signiicance, which allow for the prioritizing of injury control actions. The Moran index was adopted, with a variation from -1 to 1. The values close to zero indicate the absence of spatial correlation – diference among neighborhoods close to each other. The positive values indicate positive spatial autocorrelation, mean-ing that there are similarities between neighborhoods close to each other, and negative values have negative spatial autocorrelation13,27. In general, the Moran index is a test whose null hypothesis is of spatial independence. In this case, its value is zero. Positive values (between 0 and +1) indicate direct correlation, and negative ones (between 0 and -1) indicate inverse correlation28. The analysis of spatial distribution of the services had three stages. The irst stage identiied critical transition areas and used Moran’s spread-ing diagram to compare the spatial dependency of each neighborhood. In this stage, the quadrants are interpreted as: Q1 (positive values, positive means); Q2 (negative val-ues, negative means), which indicates the points of positive spatial association or points that are similar to their neighbors; Q3 (positive values, negative means); and Q4 (nega-tive values, posi(nega-tive means), which indicates points of nega(nega-tive spatial association, and neighborhoods with values diferent from other neighborhoods close by. This stage is visually represented with a BoxMap13,27,28.
The third stage merges zones with positive spatial relation identified by the BoxMap (with spatial significance above 95%) and those with positive spatial rela-tion identified by the LisaMap. The combinarela-tion of these two groups generated the MoranMap. Critical areas were those that consisted of neighborhoods classified as Q1 in the MoranMap13,27.
The spatial exploratory analysis for the identiication of transition areas and critical areas of the events studied were performed with the help of electronic Excel©
spreadsheets and TerraView software, version 4.2.2. The results were represented in the digital cartographic base of Recife.
This Project was approved by the Research Ethics Committee in agreement with Resolution No. 466/2012, which regulates research with human beings, and which is from the Instituto de Medicina Integral Professor Fernando Figueira (IMIP), CAEE: 53175716.2.0000.5201.
RESULTS
In the period studied, 1,225 victims of urban traic accidents were attended to by SAMU in the city of Recife, Pernambuco. This value corresponds to 45.4% of the total number of services performed by SAMU (n = 2,698), considering all causes.
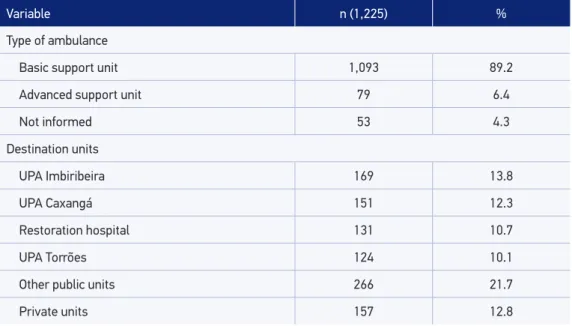
The Basic Support Units (unidades de suporte básico – USBs) performed most of the ser-vices. Most of the victims were taken to public health network units, mainly the Municipal Emergency Care Units (Unidades de Pronto Atendimento – UPAs) (Table 1).
Table 1. The characterization of victims of urban traic accidents assisted by the Emergency Mobile Care Services of the city of Recife, Pernambuco, Brazil (January to June, 2015).
Variable n (1,225) %
Type of ambulance
Basic support unit 1,093 89.2
Advanced support unit 79 6.4
Not informed 53 4.3
Destination units
UPA Imbiribeira 169 13.8
UPA Caxangá 151 12.3
Restoration hospital 131 10.7
UPA Torrões 124 10.1
Other public units 266 21.7
Private units 157 12.8
Table 1. Continuation.
Variable n (1,225) %
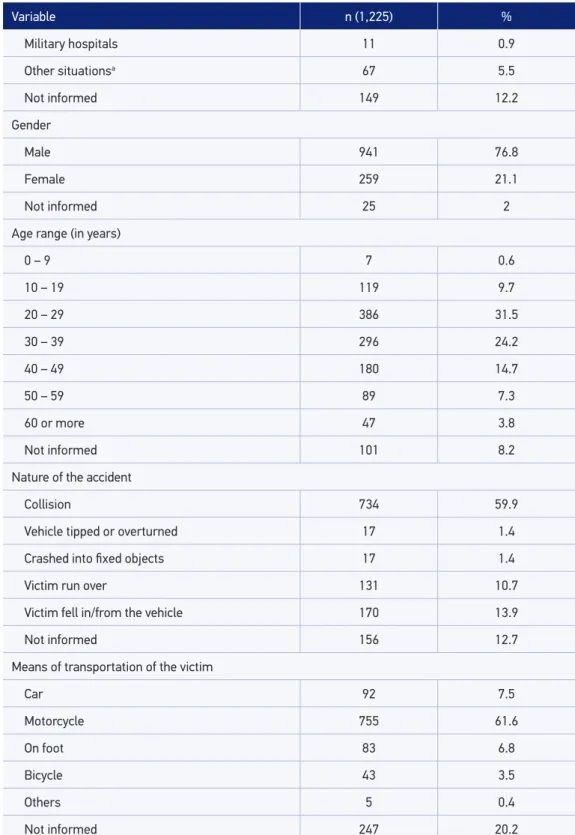
Military hospitals 11 0.9
Other situationsa 67 5.5
Not informed 149 12.2
Gender
Male 941 76.8
Female 259 21.1
Not informed 25 2
Age range (in years)
0 – 9 7 0.6
10 – 19 119 9.7
20 – 29 386 31.5
30 – 39 296 24.2
40 – 49 180 14.7
50 – 59 89 7.3
60 or more 47 3.8
Not informed 101 8.2
Nature of the accident
Collision 734 59.9
Vehicle tipped or overturned 17 1.4
Crashed into fixed objects 17 1.4
Victim run over 131 10.7
Victim fell in/from the vehicle 170 13.9
Not informed 156 12.7
Means of transportation of the victim
Car 92 7.5
Motorcycle 755 61.6
On foot 83 6.8
Bicycle 43 3.5
Others 5 0.4
Not informed 247 20.2
Victims were mostly males (a ratio of 3.6 men for each woman). The most common age range was from 20 to 29 years old, and the least frequent age range was from 0 to 9 years old. Approximately 60% of the cases were caused by a collision. As for the vic-tim’s means of transportation, motorcycles were most frequently involved in urban traf-ic accidents (Table 1).
When observing the distribution of care per day of the week, with Tuesday as the ref-erence, it was found that Friday had a 29% higher risk of urban traic accidents. Assistance occurred about 5 times more often from 6:00am to 8:59am and from 6:00pm to 8:59pm, in relation to the reference time period of 12:00am to 2:59am (Table 2).
Table 2. Absolute and relative distribution, incidence rate, relative risk, confidence interval and p-value of urban traic accidents assisted by the Emergency Mobile Care Services, according to day of the week and time of the occurrence in the city of Recife, Pernambuco, Brazil (January to June, 2015).
Variable n (1.225) % IRa RRb 95%CIc p-value
Day of the week*
Sunday 175 14.3 1.10 1.14 0.92 – 1.41 0.24
Monday 183 14.9 1.15 1.19 0.96 – 1.47 0.11
Tuesday 154 12.6 0.96 1.00
Wednesday 159 13.0 0.99 1.03 0.83 – 1.29 0.77
Thursday 183 14.9 1.15 1.19 0.96 – 1.47 0.11
Friday 198 16.2 1.24 1.29 1.04 – 1.59 0.01
Saturday 173 14.1 1.08 1.12 0.90 – 1.40 0.29
Time**
12:00am- 2:59am 40 3.3 0.25 1.00
3:00am- 5:59am 41 3.3 0.26 1.02 0.66 – 1.58 1.00
6:00am- 8:59am 207 16.9 1.30 5.17 3.69 – 7.26 < 0.00
9:00am- 11:59am 160 13.1 1.00 4.00 2.83 – 5.66 < 0.00
12:00pm-2:59pm 179 14.6 1.12 4.47 3.18 – 6.30 < 0.00
3:00pm-5:59pm 186 15.2 1.16 4.65 3.30 – 6.54 < 0.00
6:00pm-8:59pm 224 18.3 1.40 5.60 4.00 – 7.84 < 0.00
9:00pm-11:59pm 142 11.6 0.89 3.55 2.50 – 5.04 < 0.00
Not informed 46 3.8
aIR: incidence rate (number of occurrences/population exposed per 10,000 inhabitants); bRR: observed incidence/
expected incidence IC: incidence coeicient (cases/10,000 inhabitants); c95%CI: confidence interval of 95%; *Tuesday
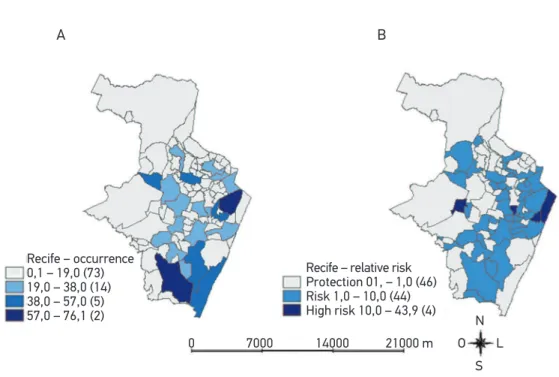
The neighborhoods with the highest frequency of traffic accidents were: Ibura (n = 76; 6.2%), located in the southern zone of the municipality; followed by Santo Amaro (n = 62; 5.1%), in the central zone; and Boa Viagem (n = 54; 4.4%), in the south zone (Figure 1A). The incidence of traffic accident assistance in the municipality was 7.67 times per 10,000 inhabitants. The neighborhoods with the highest RRs for the occur-rence of traffic accidents were: Santo Antônio (RR = 43.76; 95%CI [23, 74; 80, 72]), followed by the neighborhood in Recife (RR = 23.17; 95%CI [12, 87; 41, 75]), which are both from the central zone of the municipality, and the University Campus (RR = 19.82; 95%CI [11, 52; 34, 08]), in the northwestern region of the municipality (Table 3 and Figure 1B).
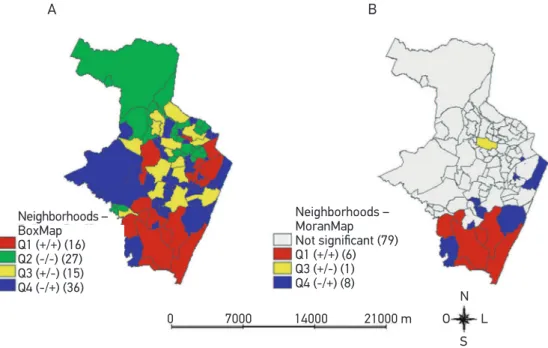
When exploring the spatial dependency of this kind of occurrence using the BoxMap, positive correlation areas were identiied in the south and northeast zones of the munic-ipality (Table 3 and Figure 2A). The BoxMap also shows areas with negative spatial auto-correlation, represented by regions Q3 and Q4, which may indicate potential critical nodes (Figure 2A).
Finally, the MoranMap statistically conirms that the south regions of the municipality have the highest relevance for the occurrence of services provided after urban traic acci-dents during the period analyzed. Transition regions in the vicinity of critical areas are also kept in the inal model (Table 3 and Figure 2B).
0 7000 14000 21000 m
N
S
O L
A B
Recife – occurrence 0,1 – 19,0 (73) 19,0 – 38,0 (14) 38,0 – 57,0 (5) 57,0 – 76,1 (2)
Recife – relative risk Protection 01, – 1,0 (46) Risk 1,0 – 10,0 (44) High risk 10,0 – 43,9 (4)
DISCUSSION
This study observed that most of the assistance provided to victims of urban traic accidents was performed by the USBs. This corroborates studies carried out in the state of Paraíba, whose indings reveal that more than 90% of services were performed by basic ambu-lances29,30. These are similar results to those found in other studies31-33. One of the possible
Table 3. Incidence rate, relative risk and confidence interval of urban traic accidents assisted by the Emergency Mobile Care Services of the main neighborhoods. Recife, Pernambuco, Brazil (January to June, 2015).
Neighborhoods IR(i) RR(ii) 95%CI(iii)
Areiasb 7.99 1.04 0.69 – 1.57
Barroa,b,c 4.20 0.55 0.32 – 0.93
Boa Viagema,b,c 4.20 0.55 0.42 – 0.72
Boa Vistaa,b 30.66 4.00 2.99 – 5.35
Bomba do Hemeterioa,b 16.93 2.21 1.33 – 3.67
Campo Grandea,b 23.18 3.02 2.00 – 4.57
Cidade Universitariaa 151.93 19.82 11.52 – 34.08
Derbya,b 124.63 16.26 11.13 – 23.76
Engenho do Meioa,b 14.98 1.95 1.19 – 3.20
Espinheiroa,b 12.82 1.67 0.99 – 2.83
Estanciaa 13.45 1.75 1.02 – 3.03
Iburaa,b,c 14.35 1.87 1.49 – 2.36
Imbiribeirab,c 8.47 1.11 0.81 – 1.51
Ipsepb,c 8.40 1.10 0.70 – 1.70
Iputingaa,b 4.21 0.55 0.36 – 0.83
Jardim Sao Pauloa,b 8.16 1.06 0.71 – 1.58
Jordaob,c 8.28 1.08 0.68 – 1.72
Recifea 177.63 23.17 12.87 – 41.75
Santo Amarob 21.21 2.77 2.14 – 3.57
Santo Antonioa 335.44 43.76 23.74 – 80.72
Município 7.67 1.00 –
astatistically significant neighborhoods to increased relative risk (p < 0.05); bneighborhoods with positive values and
means by BoxMap; cneighborhoods with spatial significance ≥ 95% by MoranMap; (i)IR: incidence rate (number of
occurrences/population exposed* 10,000 inhabitants); (ii)RR: observed incidence/expected incidence; IC: incidence
explanations is the fact that the municipality has the mostly this kind of ambulance. There are ive times more USBs than advanced support units (unidades de suporte avançado – USAs).
As for destination units, the results observed were consistent with other studies29-31, in which most victims were taken to a trauma hospital in the city. Especially in Recife, the high number of referrals to UPAs is due to their connection with one other, ever since January 2010, when they were integrated into the state emergency network.
Males and young adults deserve special attention in regard to the promotion of actions that prevent urban traic accidents, since these groups are the most afected. Similar results were found in other studies4-7,14,31,33,34. According to the World Health Organization (WHO), these groups are about three times more likely to die in a transportation accident than young women3.
This data may be a consequence of the young male population’s exposure to traic. Based on social and cultural behaviors, this group takes more risks when driving vehicles. These risks include driving at high speeds, using inappropriate maneuvers and drinking alcohol14. Those and other foolish behaviors are determinant characteristics for the alarm-ing transportation accident rates in this population35. Potential social security expenses may be generated, raising costs to public cofers, due to the victims’ impossibility to work and complete rehabilitation at the same time36.
Collision is one of the most common types of accidents, especially when they include motorcycles29,30,37,38. Other studies displayed similar results, with motorcycles in irst place in the involvement in traic accidents14,29,30,33,39.
Figure 2. BoxMap (A) and MoranMap (B) of urban traic accidents, according to neighborhood. Recife, Pernambuco, Brazil (January to June 2015).
0 7000 14000 21000 m
N
S
O L
A B
Neighborhoods – BoxMap Q1 (+/+) (16) Q2 (-/-) (27) Q3 (+/-) (15) Q4 (-/+) (36)
Neighborhoods – MoranMap
Not significant (79)
Motorcycles became a very popular automotive vehicle for many reasons, including the ease with which they can be acquired and paid for, their agility in slow traic in large metropolises and the money they saves on fuel and maintenance. All of these factors may directly inluence the populations’ choice, resulting, thus, in an increased number of motor-cycles and, consequently, an increased frequency of motorcycle accidents. It should be con-sidered that this increase in the purchase of motorcycles is not accompanied by appropriate investment for drivers’ safety 40-42.
When observing services according to day of the week and time of the accident, Friday had the most occurrences. However, other studies33,34,42,43 reported that the highest fre-quency of transportation accidents occurred on Sundays, probably due to a greater num-ber of commemorative events, among other factors, such as alcohol consumption, passing at high speeds, and risky maneuvers.
The times with the most occurrences are probably related to the rush hour times of the city, i.e., the time when the most vehicles are in movement, going back and forth from work, college and school. Similar studies carried out in the municipality of Olinda14, observed a predominance of occurrences between 6:00pm and 11:59pm, which could be explained by fatigue as well as physical and mental exhaustion, which make people more vulnerable to accidents.
When analyzing the frequency of accidents by neighborhood, it is possible to suggest some hypotheses regarding the neighborhoods with the highest numbers of urban traic accidents. For example, the neighborhoods are traversed by large traic vehicle high-ways, which access important parts of the city, such as universities and airports. Some neigh-borhoods also connect the central and northern zones of Recife, with access roads marked by retention points.
Another important neighborhood, in addition to being touristy and having the city’s main beach also has most of the hotel network and a signiicant amount of schools, restau-rants, doctors’ oices and a shopping mall. These factors contribute to increase the low of vehicles on main avenues.
Commercial neighborhoods that are known for their cultural and tourist programs, such as Carnival and Christmas festivities, are located in the central region of the city. They have a greater risk of transportation accidents, which is expected, considering the high vehicle low and low resident population. A similar result was found in another study29,in a com-mercial neighborhood in the municipality of João Pessoa, Paraíba, which had the highest risk for SAMU services.
The highest risk areas for urban traic accidents pointed out by the BoxMap and the MoranMap show that there is a pattern for the occurrence of such events. When observ-ing Q1 neighborhoods in both spatial analysis techniques, it was found that the high occur-rence of accidents in both (statistically signiicant) situations takes place in the southern region of the municipality.
of the largest industrial and port hubs in northeastern Brazil. The complex began to attract large public and private investments, and became, along with its surroundings, a massive “construction site”44, resulting in a greater low of vehicles circulating the southern region of the capital city.
Spatial analysis studies on urban traic accidents have proven useful in order to iden-tify risk areas of occurrences, that is, places where surveillance actions should be revisited. They should encourage the implementation of a preventive approach in addition to provide a support tool for traic safety actions36,45. Another study14 performed using spatial analysis ratiied the importance of integrating the Municipal Health Department and related organs for the implementation of preventive and corrective measures.
Research carried out in Teresina, Piauí, emphasized the importance of spatial analysis in order to determine priority areas and encourage actions from public management and professionals inserted in diferent health programs of diferent groups of users, particularly those who are most vulnerable46.
In the present study, spatial analysis was proven feasible to identify risk areas for the occurrence of transportation accidents, by using secondary SAMU data, similarly to what was found in other studies 29,30. One of the limitations of this research project regards the incomplete recording of data, especially concerning greater details on the location of the occurrences, making it impossible to carry out pertinent analyses. Incidence esti-mates of RR, calculated based on the population living in the neighborhoods may have been afected by victims living in other municipalities, leading to an overestimation of cases in some neighborhoods. Although this is expected when it comes to metropolitan regions and when the estimated population around the municipality is not taken into account. In addition, despite the fact that SAMU covers 100% of the municipality, there are victims attended by the Fire Department or even by third parties, and these data were not considered in this study.
It is important to organize health assistance appropriately in relation to the surveil-lance of occurrences attended by SAMU. Furthermore, there must be a basurveil-lanced approach regarding the problems identiied, in agreement with the principles of the Uniied Health System (Sistema Único de Saúde – SUS)34. SAMU’s data sheets, based on spatial analysis, were an important source of information for health surveillance.
CONCLUSION
SAMU’s services were predominantly carried out by basic support units. Most vic-tims consisted of young, male adults, especially motorcyclists. The spatial analysis of urban traic accidents identiied critical areas for the occurrence of assistance during the period analyzed.
Identifying critical time periods, which coincide with traic rush hours in the city, as well as the areas forming signiicant spatial regions, may be the basis for the implementation of educational actions in places that are most afect. The actions would be geared toward the most vulnerable population, thus increasing their efectiveness.
The spatial analysis of urban traic accidents, which is unprecedented in the city of Recife, gives SAMU the possibility of using the results found in this study to plan and redistribute their decentralized units, with the objective of streamlining and improving their services.
ACKNOWLEDGEMENTS
The authors would like to thank the Epidemiological Surveillance of the Health Department of Recife and SAMU, which made this study possible.
1. World Health Organization (WHO). Promovendo a defesa da segurança viária e das vítimas de lesões causadas pelo trânsito: um guia para organizações não gover namentais. Geneva: WHO;2013. [Internet]. Disponível em: http://apps.who.int/ iris/bitstream/10665/44854/8/9789248503320_por. pdf (Acessado em 24 de novembro de 2015).
2. Maciel WV, Maciel SS, Farias AH, Silva ET, Gondim LA, Oliveira TF. Internações hospitalares por fraturas do crânio e dos ossos da face no nordeste brasileiro. Revista da Amrigs 2009; 53(1): 28-33.
3. World Health Organization (WHO). Road traic injuries. Fact sheet. Geneva: WHO; 2016. [Internet]. Disponível em: http://www.who.int/mediacentre/factsheets/ fs358/en/ (Acessado em 12 de novembro de 2015).
4. Andrade SS, Jorge MH. Estimate of physical sequelae in victims of road traic accidents hospitalized in the Public Health System. Rev bras Epidemiol 2016; 19(1): 100-11. DOI: 10.1590/1980-5497201600010009
5. Ascari RA, Chapiesk i CM, Silva OM, Frigo J. Perfil epidemiológico de vítimas de acidente de trânsito. Rev Enferm UFSM 2013; 3(1): 112-21. DOI: 10.5902/217976927711
6. Bacchieri G, Barros AJ. Traffic accidents in Brazil from 1998 to 2010: many changes and few efects. Rev Saúde Pública [online] 2011; 45(5): 949-63. DOI: 10.1590/S0034-89102011005000069
7. Franco MS, Lins AC, Lima AK, Araújo TL, Amaral RC. Caracterização de pacientes vítimas de acidentes de transito admitidos em hospital regional da Paraíba. R Interd 2015; 8(2): 123-29.
8. Malta DC, Andrade SS, Gomes N, Silva MM, Morais OL, Reis AA, et al. Injuries from traffic accidents and use of protection equipment in the Brazilian population, according to a population-based study. Ciênc saúde coletiva 2016; 21(2): 399-410. DOI: 10.1590/1413-81232015212.23742015
9. Moyses SJ. Deter minação sociocultural dos acidentes de transporte terrestre (ATT). Ciênc saúde coletiva 2012; 17(9): 2241-3. DOI: 10.1590/ S1413-81232012000900005
10. Cerqueira GL. Consumo de álcool e outras drogas por jovens condutores. [Internet]. Disponível em: www. psicologia.pt. (Acessado em 11 de outubro de 2015).
11. Morais OL, Montenegro MM, Monteiro RA, Siqueira JB, Silva MM, Lima CM, et al. Mortalidade por acidentes de transporte terrestre no Brasil na última década: tendência e aglomerados de risco. Ciênc saúde coletiva 2012; 17(9): 2223-36. DOI: 10.1590/ S1413-81232012000900002
12. Malta DC, Mascarenhas MD, Bernal RT, Silva MM, Pereira CA, Minayo MC, et al. Análise das ocorrências das lesões no trânsito e fatores relacionados segundo resultados da pesquisa nacional por amostra de domicílios (PNAD) Brasil, 2008. Ciênc saúde coletiva 2011; 16(9): 3679-87. DOI: 10.1590/ S1413-81232011001000005
13. Silva PH, Lima ML, Moreira RS, Souza WV, Cabral AP. Spatial study of mortality in motorcycle accidents in the State of Pernambuco, Northeastern Brazil. Rev Saúde Pública 2011; 45(2): 409-15. DOI: 10.1590/ S0034-89102011005000010
14. Cabral AP, Souza WV, Lima ML. Serviço de atendimento móvel de urgência: um observatório dos acidentes de transportes terrestre em nível local. Rev Bras Epidemiol 2011; 14(1): 03-14. DOI: 10.1590/ S1415-790X2011000100001
15. Gawryszewski VP, Coelho HM, Sarpelini S, Zan R, Jorge MH, Rodrigues EM. Land transport injuries among emergency department visits in the state of São Paulo, in 2005. Rev Saúde Pública 2009; 43(2): 275-82. DOI: 10.1590/S0034-89102009000200008
16. Brasil. Ministério da Saúde. Política nacional de atenção às urgências. Série E. Legislação de Saúde. Brasília: Editora do Ministério da Saúde 2006; 256. [Internet]. Disponível em: http://bvsms.saude.gov.br/bvs/ publicacoes/politica_nacional_atencao_urgencias_3ed. pdf (Acessado em 16 de novembro de 2015).
17. Brasil. Ministério da Saúde. Portal da Saúde. O que é o SAMU 192? Criado em 13 de Junho de 2014. [Internet]. Disponível em: http://portalsaude.saude.gov.br/index. php/o-ministerio/principal/secretarias/951-sas-raiz/ dahu-raiz/forca-nacional-do-sus/l2-forca-nacional-do- sus/13407-servico-de-atendimento-movel-de-urgencia-samu-192 (Acessado em 16 de novembro de 2015).
18. Prefeitura do Recife. SAMU. [Internet]. Disponível em: http://www2.recife.pe.gov.br/servico/samu-0 (Acessado em 02 de abril de 2015).
19. Novoa AM, Perez K, Borrell C. Efectividad de las intervenciones de seguridad vial basadas en la evidencia: una revision de la literatura. Gac Sanit 2009; 23(6): 553.e1-553.e14.
20. Hyder AA, Allen KA, Di Pietro G, Adriazola CA, Sobel R, Larson K, et al. Addressing the implementation gap in global road safety: exploring features of an efective response and introducing a 10-country program. Am J Public Health 2012; 102(6): 1061-7. DOI: 10.2105/ AJPH.2011.300563
21. Best N, Richardson S, Thomson U. A comparison of bayesian spatial models for disease mapping. Stat Methods Med Res 2005; 14(1): 35-59. DOI: 10.1191/0962280205sm388oa
22. Bailey TC. Métodos estatísticos espaciais em saúde. Cad Saúde Pública 2001; 17(5): 1083-98. DOI: 10.1590/ S0102-311X2001000500011
23. Bailey TC, Carvalho MS, Lapa TM, Souza WV, Brewer MJ. Modeling of under-detection of cases in disease surveillance. Annals of Epidemiology 2005; 15(5): 335-43. DOI: 10.1016/j.annepidem.2004.09.013
24. Souza VR, Cavenaghi S, Alves JE, Magalhães MA. Análise espacial dos acidentes de trânsito com vítimas fatais: comparação entre o local de residência e de ocorrência do acidente no Rio de Janeiro. Rev Bras Estud Popul 2008; 25(2): 353-64. DOI: 10.1590/ S0102-30982008000200010
25. Brasil. Secretaria de Saúde do Recife. Plano Municipal de Saúde 2014 - 2017. Governo Municipal. Secretaria Executiva de Coordenação Geral, Gerência Geral de Planejamento. Recife: Secretaria de Saúde do Recife: 2014. 84 p.
26. Brasil. Instituto Brasileiro de Geografia e Estatística (IBGE). Diretoria de Pesquisas (DPE). Coordenação de População e Indicadores Socias - COPIS. [Internet]. Disponível em: http://cidades.ibge. gov.br/xtras/perfil.php?lang=&codmun=261160&-search=pernambuco|recife (Acessado em 11 de novembro de 2015).
27. Krempi AP. Explorando recursos de estatística espacial para análise de acessibilidade na cidade de Bauru. Escola de Engenharia de São Carlos: Universidade de São Paulo 2004. [Dissertação de Mestrado]. Disponível em: http://www.teses.usp.br/teses/disponiveis/18/18137/ tde-10032005-064613/pt-br.php (Acessado em 17 de outubro de 2015).
28. Câmara G, Carvalho MS, Cruz OG, Correa V. Análise espacial de dados geográicos: Cap. 5, análise espacial de áreas. Brasília, EMBRAPA, 2004 [Internet]. Disponível em: http://www.dpi.inpe.br/gilberto/livro/analise/ cap5-areas.pdf (Acessado em 17 de abril de 2017).
29. Pereira AP, Moraes RM, Vianna RP. Aplicação do método scan para a detecção de conglomerados espaciais dos acidentes de trânsito ocorridos em João Pessoa-PB. Hygeia 2014; 10(18): 82-97.
30. Soares RA, Pereira AP, Moraes RM, Vianna RP. Caracterização das vítimas de acidentes de trânsito atendidas pelo Serviço de Atendimento Móvel de Urgência (SAMU) no Município de João Pessoa, Estado da Paraíba, Brasil, em 2010. Epidemiol Serv Saúde 2012; 21(4): 589-600. DOI: 10.5123/ S1679-49742012000400008
31. Dias LK. Avaliação do serviço de atendimento móvel de urgência na atenção aos acidentes de trânsito na zona urbana de sobral – CE. Universidade Federal do Ceará 2016. [Dissertação de Mestrado]. Disponível em: http:// repositorio.ufc.br/bitstream/riufc/19191/1/2016_ dis_lksdias.pdf (Acessado em 04 de outubro de 2016).
32. Soares RA, Pereira AP, Moraes RM, Vianna RP. Modelo de suporte à decisão para a gravidade de ferimentos das vítimas de acidentes de trânsito atendidas pelo samu 192. Rev Saúde.Com 2013; 9(2): 2-16.
33. Silva JK, Rios MA, Amaral TF, Silva PL. Proile of road transport accidents met by the mobile urgency attendance service. J Nurs UFPE on line 2016; 10(1): 9-17. DOI: 10.5205/reuol.8423-73529-1-RV1001201602
35. Miranda AL, Sarti EC. Consumo de bebidas alcoólicas e os acidentes de trânsito: o impacto da homologação da lei seca em Campo Grande-MS. Ensaios Cienc, Cienc Biol Agrar Saúde 2011; 15(6): 155-71.
36. Nunes MN, Nascimento LF. Análise espacial de óbitos por acidentes de trânsito, antes e após a Lei Seca, nas microrregiões do Estado de São Paulo. Rev Assoc Med Bras 2012; 58(6): 685-90. DOI: 10.1016/S2255-4823(12)70272-2
37. Rodrigues AS, Fer nandes PG. Avaliação das características dos acidentes de trânsito do município de Botucatu e suas associações com as condições climáticas. Tekhne e Logos, Botucatu 2015; 6(2): 70-84.
38. Almeida RL, Filho JG, Braga JU, Magalhães FB, Macedo MC, Silva KA. Man, road and vehicle: risk factors associated with the severity of traic accidents. Rev Saúde Pública 2013; 47(4): 718-31. DOI: 10.1590/ S0034-8910.2013047003657
39. Marín-León L, Belon AP, Barros MB, Almeida SD, Restitutti MC. Tendência dos acidentes de trânsito em Campinas, São Paulo, Brasil: importância crescente dos motociclistas. Cad Saúde Pública 2012; 28(1): 39-51. DOI: 10.1590/S0102-311X2012000100005
40. Anjos KC, Evangelista MR, Silva JS, Zumiotti AV. Paciente vítima de violência no trânsito: análise do peril socioeconômico, características do acidente e intervenção do serviço social na emergência. Acta Ortop Bras 2007; 15(5):262-6. DOI: 10.1590/ S1413-78522007000500006
41. Felix NR, Oliveira SR, Cunha NA, Schirmer C. Caracterização das vítimas de acidente motociclistico atendidas pelo serviço de atendimento pré-hospitalar. Revista Eletrônica Gestão & Saúde 2013; 04(04): 1399-411.
42. Nolasco TR, Andrade SM, Silva BA. Capacidade funcional de vítimas de acidentes de trânsito em Campo Grande, Mato Grosso do Sul. Ensaios Cienc, Cienc Biol Agrar Saúde 2016; 20(2): 104-10.
43. Vieira RC, Hora EC, Oliveira DV, Vaez AC. Levantamento epidemiológ ico dos acidentes motociclísticos atendidos em um centro de referência ao trauma de Sergipe. Rev Esc Enferm USP 2011; 45(6): 1359-63. DOI: 10.1590/S0080-62342011000600012
44. Oliveira RV. Trabalho no Nordeste em perspectiva histórica. Estud Av 2016; 30(87): 49-73. DOI: 10.1590/ S0103-40142016.30870004
45. Hernández HV. Análisis exploratorio espacial de los accidentes de tránsito en Ciudad Juárez, México. Rev Panam Salud Publica 2012; 31(5): 396-402.
46. Santos AM, Rodrigues RA, Santos CB, Caminiti GB. Distribuição geográfica dos óbitos de idosos por acidente de trânsito. Esc Anna Nery 2016; 20(1): 130-7. DOI: 10.5935/1414-8145.20160018
Received on: 01/04/2017