AbstrAct:Objective: The aim of this study is to compare the socioeconomic proile of the population aged 60 or older living in Florianópolis in 2002 and 2009. Methods: Data were obtained through the studies Peril do Idoso 2002 and EpiFloripa Idoso 2009 based on household surveys. Results: There was a predominance of aged 60 to 69 years old, married and living with spouse and children. There was a signiicant improvement in the level of education and, on the economic aspects, retirement remains the main source of income, increasing the number of families receiving no more than three minimum wages and reducing those with monthly income above 10 minimum wages. The number of older adults who considers their current inancial situation better than age 50 increased as the proportion of subjects with fair/poor self-perception health. It was also highlighted greater purchasing private health insurance. Conclusion: Comparison of the two studies presented here can support the actions of managers in order to bring efective results to the population.
Keywords: Aged. Demographic aging. Health of the elderly. Socioeconomic factors. Health proile. Public health.
Socioeconomic proile of the elderly in
Florianópolis: Comparative analysis studies
Peril do Idoso 2002
and
EpiFloripa Idoso 2009
Peril socioeconômico dos idosos de Florianópolis: Análise comparativa dos
estudos Peril do Idoso 2002 e EpiFloripa Idoso 2009
Danielle Ledur AntesI, Daniela Furuzawa RibeiroII, Ione Jayce Ceola SchneiderI, Tânia Rosane Bertoldo BenedettiIII, Eleonora d’OrsiI
IPrograma de Pós-graduação em Saúde Coletiva da Universidade Federal de Santa Catarina – Florianópolis (SC), Brasil. IIGraduação em Medicina, Universidade Federal de Santa Catarina – Florianópolis (SC), Brasil.
IIIPrograma de Pós-graduação em Educação Física da Universidade Federal de Santa Catarina – Florianópolis (SC) Brasil. Corresponding author: Danielle Ledur Antes. Núcleo de Cineantropometria e Desempenho Humano da Universidade Federal de Santa Catarina. Centro de Desportos – Campus Universitário, sala 42, Trindade, CEP: 88040-900, Florianópolis, SC, Brazil. E-mail: [email protected]
INTRODUCTION
The increase in the elderly population is nowadays a worldwide phenomenon1.
In Brazil, population ageing is going to be significantly faster than that of developed countries in the past century. The elderly population will practically triplicate in the next four decades, from 20 million in 2010 to roughly 65 million in 2050. This change in the Brazilian’s age structure will add to the pressure on public pension and health care systems2 and pose changes in the epidemiological profile of the country3, which will
shift from a typical mortality profile of a young population to one featuring complex and more expensive diseases that are common among ageing people4,5.
The growing elderly population and its consequences is one of the main subjects in Public Health, especially because of social implications and the impact on health policies. Studies showing the changes in the demography of this population subsidize public organizations, allowing different sectors dealing with this age group to adapt their policies, programs, strateg ies and action with view to the current reality, laws and rules1,6.
resumO:Objetivo: Descrever o peril socioeconômico e autopercepção de saúde da população com 60 anos ou mais
residente em Florianópolis nos anos de 2002 e 2009. Métodos: Os dados foram extraídos com base nos inquéritos domiciliares Peril do Idoso 2002 e EpiFloripa Idoso 2009. Resultados:Veriicou-se o predomínio dos idosos de 60 a 69 anos, casados e que residem com o cônjuge e ilhos. Houve melhora signiicativa do padrão de escolaridade e, quanto à questão econômica, a aposentadoria continua a principal fonte de renda, com aumento do número de famílias recebendo, no máximo, três salários mínimos e redução das que tinham renda mensal acima de 10 salários mínimos. O número de idosos que consideram sua situação inanceira atual melhor do que aos 50 anos aumentou, assim como a proporção de sujeitos com percepção de saúde regular/ruim. Destacou-se, ainda, maior aquisição de planos de saúde particulares. Conclusão: A comparação dos dois estudos aqui apresentados pode subsidiar as ações dos gestores a im de trazer resultados efetivos para a população.
Under this scope, epidemiological population studies are useful, because they allow outlining the multidimensional profile of people and provide a detailed knowledge of the investigated regions’ inhabitants6.
In view of the above, our study aimed to draw the socioeconomic profile of the population aging 60 or more and living in Florianópolis (SC, Brazil) based on two epidemiological surveys: Perfil do Idoso (2002) and EpiFloripa Idoso (2009/2010).
METHODS
This paper brings a description of two observational cross-sectional studies based on residences and residents: Perfil do Idoso and EpiFloripa Idoso.
Perfil do Idoso* was carried out in Florianópolis city from August to December
2002, and the pur pose was to collect specif ic data on the elderly population of the city in order to characterize their life and health conditions. The study was descriptive, cross-sectional and of prevalence, with sampling by the 2000 IBGE census information and by gender, according to the elderly definition established by ONU in 1982 for developing countries. To define the sample, we adopted the sampling error p = 0.05, weighted by description, according to the technical guidance by IBGE/SC. The minimum number of interviewees was established in 797 — divided as 398 males and 399 females. When opting to study all census sectors, the sample size would be 875 aged people — divided as 437 males and 438 females.
Data collection was made by university graduates and senior researchers through random and systematic selection of interviewees, being interviewed an aged for each census sector and another after the half part of this sector. To assure data veracity, another team of researchers collected anthropometric data on the following week and verified the conduction of the interviews.
In all census strata, a male and a female elderly were interviewed. If the residence held more than one aged, one of them would be chosen randomly. In case they refused to participate in the study, a document would be signed.
Exclusion criteria were: long-stay hospitalization, being in geriatric institutions or hospitals and similar institutes.
Information was collected by the use of a multidimensional questionnaire named Brazil Old Age Schedule (BOAS), proposed by Veras7 and reviewed by the team of researches
of Universidade Aberta da Terceira Idade (UnATI) from Universidade do Estado do Rio de
* Tânia RBB et al. Peril do idoso do município de Florianópolis, SC: relatório inal da pesquisa. Florianópolis: UFSC;
Janeiro (UERJ)8. The questionnaire was composed of 9 sections, totalizing 133 questions
on the following aspects: general information, physical health, use of healthcare and dental services, daily activities, social and economic resources; mental health and needs or problems for the elderly.
The Project Perf il do Idoso was approved by the Ethics Committee of UFSC, protocol 051/2001.
In 2009, the population-based, cross-sectional and epidemiological study “Condições de Saúde da população idosa do município de Florianópolis, SC: estudo de base populacional”,
EpiFloripa Idoso**, was carried out aiming at investigating the aspects related to the elderly
health (60 years or more) living in the urban area of Florianópolis city. Calculation of sample size was made using a formula for incidence-prevalence studies multiplied by two (value relating to the design efect of two-phase conglomerate sample) added by 20% for predicted losses and 15% for confusion factors in association studies. The software Epi-Info 6.04 was used for the analysis in the following data: sample size = 44,460; unknown results prevalence (50%), 95% conidence interval (95%CI), sampling error = 4 percentage points; resulting in a sample with 1,599 individuals.
Sample selection was made by conglomerates in two phases. In the irst one, all 420 urban census sectors in the city were organized in ascending order of mean family income, being randomly chosen 80 of these sectors (8 sectors to each income decile).
The second phase units were the residences. A phase of updating in the number of residences of each sector (enrollment) was made necessary, for the most recent census data had been collected in 2000. In order to do so, the study supervisors had to visit all census sectors selected and count all residences with residents, in compliance with the rules established by IBGE.
According to IBGE9, the mean number of residents per residence is 3.1 people. As the
age group of interest for our research corresponded to roughly 11% of the general population, we had 102 people by census sector on average or 1 aged person for each 3 residences. Therefore, the establishment was that around 60 residences per census sector should be visited in order to find 20 aged people. These residences were randomly and systematically chosen, and all aged people in the selected houses were interviewed. The participants who were not found in their residences after four attempts of visit (at least one at night and one in the weekend), as well as those that could not answer the interview by reason of travel or hospitalization, were considered sample loss. “Refusals” were participants who refused to answer the questionnaire for personal reasons.
**D’Orsi E, coord. Condições de saúde da população idosa do município de Florianópolis-SC: estudo de base
Data collection was made using a standard questionnaire previously tested and applied as face-to-face interviews, aided by the Personal Digital Assistant (PDA).
Field study was performed from September 2009 to June 2010. The questionnaire was applied by female researchers with high-school level of study and previously trained about the research procedures. The pilot study included 99 aged people living in non-sampled regions. The ield study was supervised by post-graduation students.
Researchers performed a weekly verification of data consistency for quality control by the use of a summed up questionnaire, on the phone, in 10% of the interviews, with random selection.
The project EpiFloripa Idoso was approved by the Ethics Committee of UFSC (protocol 352/2008). In both investigations, Perfil Idoso and EpiFloripa Idoso, participants signed and informed consent form in order to be interviewed. The authors of this paper declare having no conflict of interest.
Only some of the variables assessed in Perfil Idoso and EpiFloripa Idoso were selected for our study. The pur pose was to draw the social and economic prof ile of the population aging 60 or more in Florianópolis, so the variables chosen were: age group (60 – 69 years, 70 – 79 years, 80 years or more), marital status (married/with a partner, single, divorced/separated, and widow/widower), school level (none, 1 – 4 years, 5 – 8 years, 9 – 11 years, 12 years or more), living alone (yes or no), number of residents in a house (1, 2, 3, 4, 5 or more).
Regarding income, the variables investigated were: paid work (yes or no), other sources of income (yes or no), current economic situation compared to when they were at the age of 50 (better, the same, worse) and monthly family income in minimum wage (MW) values, according to values charged in the year of the investigation (≤ 1 SM, > 1 – 3 SM, > 3 – 5 SM, > 5 – 10 SM, > 10 – 40 SM, and > 40 SM). In 2002, the minimum wage in the State of Santa Catarina was R$ 200.00, but in 2009 it was R$ 465.00. The choice of mean family income as indicator of social and economic condition is justified by the importance of income for social ascension in Brazil5.
In the absence or insufficiency of data regarding good quality education, adequate health assistance, residence and means of transportation, income would be assumed as primordial for the acquisition of goods and services and for the satisfaction of basic needs5.
Health variables used in this study were: self-perceived health (very good, good, regular, bad and very bad), current health status compared to other people in the same age (worse, equal and better), and use of private healthcare insurance (yes or no).
Data from the studies Perfil Idoso and EpiFloripa Idoso were described and compared using 95% confidence interval. Analysis was performed in the software StataSE 9.0, considering the design effect and sample weights using the command “svy”.
RESULTS
The study Perf il do Idoso was composed of interviews with 875 ageing people (437 males and 438 females) by previous sample def inition, as aforementioned. Response rate was 97.8%. The study EpiFloripa Idoso selected 1,911 ageing people from randomly chosen residences, so 1,705 ageing people were effectively interviewed, with answering rate of 89.2%. In 2009, a predominance of females (64%) to the detriment of males (36%) was observed in the survey. However, these data cannot be compared to those from Perfil do Idoso, because in the latter the sample was made proportional as to the number of males and females.
In both studies, most of the subjects aged 60-69 years. The elderly population of Florianópolis is therefore mainly composed by mature people from “younger” age groups (Table 1).
The most mentioned marital status in both samples was “married”, followed by “single” and “divorced/separated” (Table 1).
Interpreting the data from the surveys, there was a significant improvement in educational profile, with a drop in the number of individuals with no schooling and individuals who went to school for 1-4 years. In parallel, there was also an increase in the proportion of ageing people who had gone to school for 5-8 years and for 12 years (Table 1).
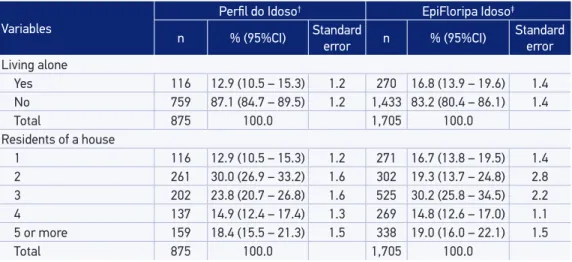
As to household patterns, less than 20% of the interviewees of both studies referred living alone, which means there was a decrease in the number of houses with two people (Table 2).
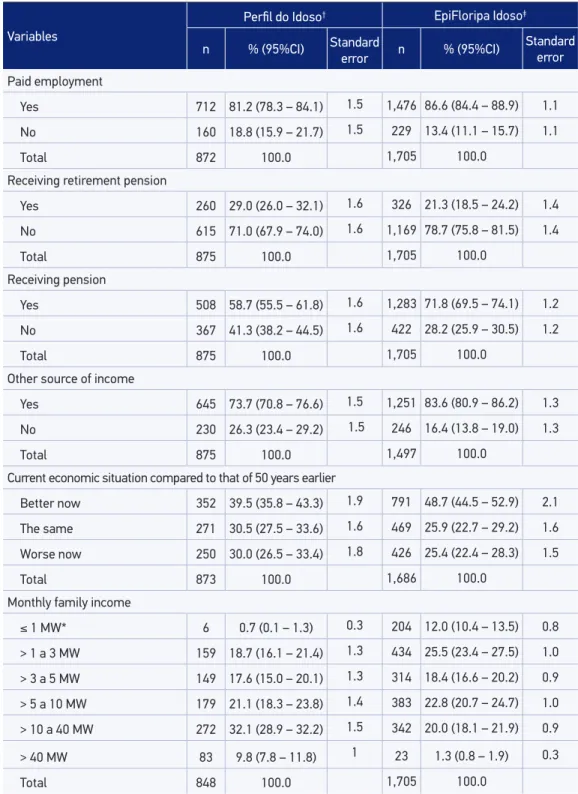
The mostly cited income sources were similar in both studies. The number of ageing people with paid employment dropped, and retirement remained as the main income in this population.
Although pension still contributes with the income of a considerable portion of the ageing population, the number of people receiving it decreased significantly. A small parcel of the sample declared, in both studies, having other types of income, so there was also a reduction in ageing people receiving incomes other than pensions or retirement. Retirement pension is, therefore, the main means of income for many ageing people (Table 3).
Table 1. Sociodemographic proile of the elderly (60 years or older) living in Florianópolis according to the studies Peril do Idoso and EpiFloripa Idosos. Florianópolis, 2002 and 2009.
Variables
Peril do Idoso† EpiFloripa Idoso‡
n % (95%CI) Standard error n % (95%CI) Standard error
Gender
Males 437 49.9 (46.8 – 52.9) 1.5 616 37.5 (34.7 – 40.4) 1.4
Females 438 50.1 (47.1 – 53.2) 1.5 1,089 62.5 (59.6 – 65.3) 1.4
Total 875 100.0 1,705 100.0
Age group
60 – 69 years 403 46.9 (42.9 – 50.9) 2.0 854 51.0 (48.2 – 53.9) 1.4
70 – 79 years 323 36.4 (32.7 – 40.2) 1.9 612 35.3 (32.4 – 38.1) 1.4
80 or older 149 16.7 (14.0 – 19.4) 1.4 239 13.7 (11.2 – 16.1) 1.2
Total 875 100.0 1,705 100.0
Marital status
Married/living with partner 536 61.9 (58.6 – 65.2) 1.7 993 58.4 (54.9 – 61.9) 1.8
Single 30 3.0 (1.9 – 4.2) 0.6 99 5.4 (3.9 – 7.0) 0.8
Divorced/ separated 58 6.5 (4.7 – 8.3) 0.9 132 8.3 (6.7 – 9.9) 0.8
Widow(er) 251 28.6 (25.4 – 31.7) 1.6 481 27.9 (24.9 – 30.8) 1.5
Total 875 100.0 1,705 100.0
School level
None 176 20.2 (17.2 – 23.2) 1.5 161 8.0 (5.8 – 10.2) 1.1
1 – 4 years 373 44.0 (40.2 – 47.9) 1.9 584 32.6 (27.9 – 37.3) 2.4
5 – 8 years 102 10.6 (8.4 – 12.8) 1.1 321 18.5 (15.9 – 21.1) 1.3
9 – 11 years 120 13.2 (10.7 – 15.7) 1.3 234 15.9 (12.4 – 19.5) 1.8
12 or more years 104 12.0 (9.4 – 14.5) 1.3 394 25.0 (20.5 – 30.0) 2.3
Total 875 100.0 1,694 100.0
†Source: Study Peril do Idoso, 2002. ‡Source: Study EpiFloripa Idoso, 2009.
Table 2. Composition of the homes of the elderly (60 years or older) regarding family structure and number of residents. Florianópolis, 2002 and 2009.
Variables
Peril do Idoso† EpiFloripa Idoso‡
n % (95%CI) Standard error n % (95%CI) Standard error
Living alone
Yes 116 12.9 (10.5 – 15.3) 1.2 270 16.8 (13.9 – 19.6) 1.4
No 759 87.1 (84.7 – 89.5) 1.2 1,433 83.2 (80.4 – 86.1) 1.4
Total 875 100.0 1,705 100.0
Residents of a house
1 116 12.9 (10.5 – 15.3) 1.2 271 16.7 (13.8 – 19.5) 1.4
2 261 30.0 (26.9 – 33.2) 1.6 302 19.3 (13.7 – 24.8) 2.8
3 202 23.8 (20.7 – 26.8) 1.6 525 30.2 (25.8 – 34.5) 2.2
4 137 14.9 (12.4 – 17.4) 1.3 269 14.8 (12.6 – 17.0) 1.1
5 or more 159 18.4 (15.5 – 21.3) 1.5 338 19.0 (16.0 – 22.1) 1.5
Total 875 100.0 1,705 100.0
Table 3. Composition of income of the older adults (60 years or older), the very opinion about the economic situation and family income. Florianópolis, 2002 and 2009.
Variables
Peril do Idoso† EpiFloripa Idoso‡
n % (95%CI) Standard
error n % (95%CI)
Standard error
Paid employment
Yes 712 81.2 (78.3 – 84.1) 1.5 1,476 86.6 (84.4 – 88.9) 1.1
No 160 18.8 (15.9 – 21.7) 1.5 229 13.4 (11.1 – 15.7) 1.1
Total 872 100.0 1,705 100.0
Receiving retirement pension
Yes 260 29.0 (26.0 – 32.1) 1.6 326 21.3 (18.5 – 24.2) 1.4
No 615 71.0 (67.9 – 74.0) 1.6 1,169 78.7 (75.8 – 81.5) 1.4
Total 875 100.0 1,705 100.0
Receiving pension
Yes 508 58.7 (55.5 – 61.8) 1.6 1,283 71.8 (69.5 – 74.1) 1.2
No 367 41.3 (38.2 – 44.5) 1.6 422 28.2 (25.9 – 30.5) 1.2
Total 875 100.0 1,705 100.0
Other source of income
Yes 645 73.7 (70.8 – 76.6) 1.5 1,251 83.6 (80.9 – 86.2) 1.3
No 230 26.3 (23.4 – 29.2) 1.5 246 16.4 (13.8 – 19.0) 1.3
Total 875 100.0 1,497 100.0
Current economic situation compared to that of 50 years earlier
Better now 352 39.5 (35.8 – 43.3) 1.9 791 48.7 (44.5 – 52.9) 2.1
The same 271 30.5 (27.5 – 33.6) 1.6 469 25.9 (22.7 – 29.2) 1.6
Worse now 250 30.0 (26.5 – 33.4) 1.8 426 25.4 (22.4 – 28.3) 1.5
Total 873 100.0 1,686 100.0
Monthly family income
≤ 1 MW* 6 0.7 (0.1 – 1.3) 0.3 204 12.0 (10.4 – 13.5) 0.8
> 1 a 3 MW 159 18.7 (16.1 – 21.4) 1.3 434 25.5 (23.4 – 27.5) 1.0
> 3 a 5 MW 149 17.6 (15.0 – 20.1) 1.3 314 18.4 (16.6 – 20.2) 0.9
> 5 a 10 MW 179 21.1 (18.3 – 23.8) 1.4 383 22.8 (20.7 – 24.7) 1.0
> 10 a 40 MW 272 32.1 (28.9 – 32.2) 1.5 342 20.0 (18.1 – 21.9) 0.9
> 40 MW 83 9.8 (7.8 – 11.8) 1 23 1.3 (0.8 – 1.9) 0.3
Total 848 100.0 1,705 100.0
#SM (Minimum wage) in 2002: R$ 200.00 and 2009: R$ 465.00. †Source: Study Peril do Idoso, 2002. ‡Source: Study
of 50. There was an increase in the number of families receiving up to one minimum wage and 1 – 3 minimum wages, as well as a decrease in those with income of more than 10 minimum wages (Table 3).
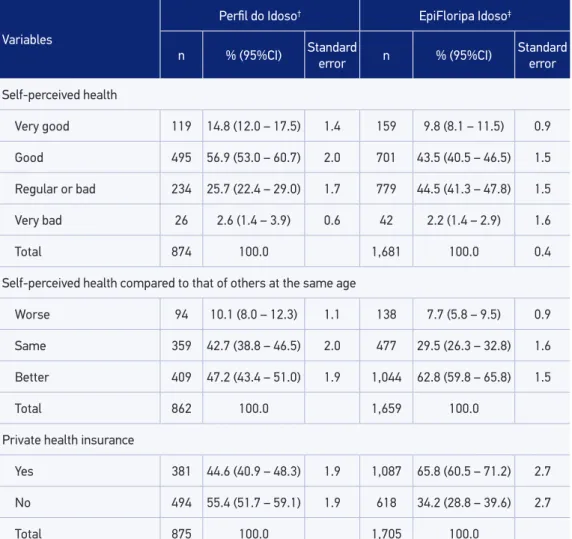
In the study carried out in 2002, most of the sample considered their health good, but there was a signiicant drop in the number of subjects with very good or good self-perceived health, and a rise in the proportion of those perceiving their own health as regular or bad. Nevertheless, the percentage of subjects considering their health better than that of other people at the same age increased signiicantly (Table 4).
Table 4. Self-perceived health and comparison to other older adults (60 years or older), presence of private health insurance. Florianópolis, 2002 and 2009.
Variables
Peril do Idoso† EpiFloripa Idoso‡
n % (95%CI) Standard error n % (95%CI) Standard error
Self-perceived health
Very good 119 14.8 (12.0 – 17.5) 1.4 159 9.8 (8.1 – 11.5) 0.9
Good 495 56.9 (53.0 – 60.7) 2.0 701 43.5 (40.5 – 46.5) 1.5
Regular or bad 234 25.7 (22.4 – 29.0) 1.7 779 44.5 (41.3 – 47.8) 1.5
Very bad 26 2.6 (1.4 – 3.9) 0.6 42 2.2 (1.4 – 2.9) 1.6
Total 874 100.0 1,681 100.0 0.4
Self-perceived health compared to that of others at the same age
Worse 94 10.1 (8.0 – 12.3) 1.1 138 7.7 (5.8 – 9.5) 0.9
Same 359 42.7 (38.8 – 46.5) 2.0 477 29.5 (26.3 – 32.8) 1.6
Better 409 47.2 (43.4 – 51.0) 1.9 1,044 62.8 (59.8 – 65.8) 1.5
Total 862 100.0 1,659 100.0
Private health insurance
Yes 381 44.6 (40.9 – 48.3) 1.9 1,087 65.8 (60.5 – 71.2) 2.7
No 494 55.4 (51.7 – 59.1) 1.9 618 34.2 (28.8 – 39.6) 2.7
Total 875 100.0 1,705 100.0
Finally, the study Perfil do Idoso showed that approximately 45% of the subjects had a private healthcare insurance. However, in 2009, the study EpiFloripa Idoso showed a considerable increase in this proportion, reaching 66%.
DISCUSSION
The comparison between the surveys Perfil do Idoso and EpiFloripa Idoso showed an increase in school levels and in the acquisition of private healthcare insurance in Florianópolis in the seven-year period between them.
The increased economic self-perception by subjects as better than when they were at the age of 50 may be related to these changes observed in the elderly profile. The health self-perception, on the other hand, shift from good to regular or bad, even though most subjects considered their health status better than that of other individuals at the same age.
EpiFloripa Idoso showed predominance of females among the elderly population in Florianópolis, so the comparison with the study of 2002 was not possible in view of the sampling method used in the studies. Analyzing other surveys, we note that this female predominance is a tendency1,5, and can be explained by the differences in life
expectancy between genders, a worldwide phenomenon that is evident in Brazil. From 1999 to 2003, life expectancy from 60 years old on became longer for all age groups and for both, men and women; however the life expectancy for females surpasses males’ in 8 years on average, which could explain the higher number of aged women to the detriment of aged men1,5.
Higher mortality rates among men in the first mature ages also explain the smaller number of men composing the elderly group. We must point out that women look for sexual/reproductive care more often, so they end up developing a more accurate health status compared to men10. It is important to note that, although women live
more than men, they also present higher morbidity rates. Thus, in the upcoming decades, women’s health needs tend to gain more attention in health services11.
As to other social and demographic features, we emphasize the improvement in school level among the elderly in the city, data shown to be better than those presented by the PNAD in 20091, when 50.2% of the elderly had less than 4 years of study and
In Brazil, the analysis of family arrangements showed that the elderly homes are composed by the model “couple and sons”2. According to studies, this is a remarkable
tendency when the responsible for the house is a male aged6. In homes where a female
aged is the family chief, the family model without a spouse is very common, because in such cases these are probably homes commanded by widows1,5.
The high proportion of people living alone is characteristic of the major urban centers due to factors such as the increase in life expectancy, the verticalization of cities, the downsizing of houses, and the rise in separations and divorces, which seem to contribute a lot with this numbers12. The studies Perfil do Idoso and EpiFloripa Idoso
pointed that Florianópolis has followed an opposite model, for there was a reduction in homes with two residents. In São Paulo, the study Epidoso13 showed that aged people
who lived with their spouses and/or sons were younger and had better economic conditions. On the other hand, the aged who lived alone were, in most cases, widows in low social and economic conditions.
The fact that Florianópolis rows against the current may be explained by the findings of the study Epidoso13, for the city holds an ageing population aging 60 – 69 years
(young elderly) and in better educational, social and economic situation compared to the country’s mean.
To the economic extent, the increase in the aged people with family income of 1 minimum wage and 1 – 3 minimum wages, as well as the drop in those presenting more than 10 minimum wages, may be explained by the fact that most of the elderly have retirement pension as their main income source, and the value of such pension did not accompany the minimum wage monetary readjustments in the period.
However, the elderly self-perception of their current economic situation as compared to when they were 50 years old has changed, as the number of subjects considering the actual situation better raised, which could be explained by their family arrangements with less people in the house, following their son’s emancipation and their parents ageing. In this manner, extra expenditure in the monthly budget drop, while the supply of consumer goods and the buying conditions improve.
The study Perfil do Idoso showed, when analyzing the health status as regarding private healthcare insurance, that in 2002 the proportion of aged people covered by these private plans was already superior to the mean national coverage, estimated in 36.7% for cities with 200,000 inhabitants or more14.
Previous studies15,16 showed that in small and medium cities (with less than 80,000
inhabitants), the participation of private healthcare plans is smaller than that of the public health system, while in cities with more than 80,000 inhabitants — Florianópolis included — , the offer of healthcare plans has been expanding since 1999. In the two last decades, a process of consolidation of urban metropolitan and non-metropolitan conglomerates was started after the economic restructuration of the country15.
This could explain why not only capitals, but also medium and big cities (with 50,001 to 200,000 inhabitants) have higher rates of healthcare plans in relation to other countryside cities with smaller populations14.
In 2002, the elderly population of Florianópolis reported being satisfied with their health status. However, in 2009, there was an increase in the rate of self-perceived health as regular or bad, which could be related to the easier access to services and increase in the level of exigency about their own health.
Data about the country from 2008 showed that most people aging 60 or more considered their health good or very good (45.5%), while a small portion (12.6%) considered their health bad or very bad1.
According to the Census 2010, Florianópolis stands out amongst other cities and capitals, keeping a historical tendency of one of the best levels of home income per capita12. The mean home income per capita in the cities of Macapá, Teresina, Manaus,
Rio Branco, São Luís, Maceió, Boa Vista and Belém represented only 40% of the total value in Florianópolis12. These data in a way reflect in the other variables assessed in
the surveys, for the purchasing power may lead to better life conditions.
Some limitations found in the comparison between Perfil do Idoso and EpiFloripa Idoso deserve attention, especially regarding differences in methodology such as sampling and way of posing some of the questions in the studies. However, bearing in mind that both studies were carried out with methodological rigor and collected data representing the elderly population of the city, the information brought about is very relevant for the drawing of changes in the elderly profile in Florianópolis in the period studied.
CONCLUSION
1. Instituto de Pesquisa Econômica Aplicada (IPEA). PNAD 2009 – Primeiras Análises: Tendências Demográicas. Governo Federal Secretaria de Assuntos Estratégicos da Presidência da República. Brasil; 2010.
2. Veras RP. Experiências e tendências internacionais de modelos de cuidado para com o idoso. Ciênc Saúde Coletiva 2012; 17(1): 231-8.
3. Martin GB, Cordoni Júnior L, Bastos YGL. Aspectos demográf icos do processo de envelhecimento populacional em cidade do sul do Brasil. Epidemiol Serv Saúde 2005; 14(3): 151-8.
4. World Health Organization (WHO). Men, Ageing And Health. Achieving health across the life span. Geneva; 1999. p. 1-63.
5. Instituto Brasileiro de Geograia e Estatística (IBGE). Indicadores Sociodemográicos e de saúde no Brasil. Estudos e Pesquisas informação demográfica e socioeconômica número 25. Rio de Janeiro; 2009. 6. Veras RP, Souza CAM, Cardoso RF, Milioli R, Dutra
S. Pesquisando populações idosas: a importância do instrumento e o treinamento de equipe: uma contribuição metodológica. Rev Saúde Pública 1988; 22(6): 513-8. 7. Veras RP. País jovem com cabelos brancos. Rio de
Janeiro: Relume Dumará/UERJ; 1994.
8. Veras RP, Dutra S. Questionários BOAS (Brazil Old Age Schedule) versão 2000 [Internet]. Disponível em: http://www.unati.uerj.br. (Acessado em: 15 de setembro de 2012).
9. Instituto Brasileiro de Geograia e Estatística (IBGE). Censo 2000 [Internet]. Disponível em http://www. ibge.gov.br/home/estatistica/populacao/default_ censo_2000.shtm. (Acessado em 2 de agosto de 2011). 10. Perls T, Kunkel LM, Puca AA. The genetics of
exceptional human longevity. J Mol Neurosci 2002; 19(1-2): 233-8.
11. Veras RP, Caldas CP, Araújo DV, Kuschnir R, Mendes W. Características demográicas dos idosos vinculados ao sistema suplementar de saúde no Brasil. Rev Saúde Pública 2008; 42(3): 497-502.
12. Instituto Brasileiro de Geograf ia e Estatística (IBGE). Indicadores sociais municipais: uma análise dos resultados do universo do censo demográico 2010. Estudos e pesquisas informação demográfica e socioeconômica número 28. Rio de Janeiro; 2011. 13. Ramos LR. Fatores determinantes do envelhecimento
saudável em idosos residentes em centro urbano: Projeto Epidoso, São Paulo. Cad Saúde Pública 2003; 19(3): 793-8.
REFERENCES
Although the data regarding monthly income did not present improvement in the period, there was an increase in the number of ageing people who consider their current economic situation better than when they were at the age of 50, as well as those who perceive their health as better than the health of other individuals at the same age. A significant rise in the number of people who contracted a private healthcare plans was also seen in the period; however, the proportion of subjects perceiving their health as regular/bad increased.
14. Pinto LF, Soranz DR. Planos privados de assistência à saúde: cobertura populacional no Brasil. Ciênc Saúde Coletiva 2004; 9(1): 85-98.
15. Costa NR, Pinto LF. Avaliação de programa de atenção à saúde: incentivo à oferta de atenção ambulatorial e a experiência da descentralização no Br asil. Ciênc Saúde Coletiva 2002; 7(4): 907-23.
16. Siqueira SAV, Senna MCM, Oliveira PTR, Pinto LF. Descentralização e assistência à saúde no Brasil: um balanço dos anos 90. Rev Saúde em Debate 2002; 26(60): 25-36.
Received on: 10/22/2012