Determination of serum levels of imatinib mesylate in patients with chronic myeloid leukemia:
validation and application of a new analytical method to monitor treatment compliance
Vinícius Marcondes Rezende Ariane Julio Rivellis
Melissa Medrano Gomes Felipe Augusto Dörr
Mafalda Megumi Yoshinaga Novaes Luciana Nardinelli
Ariel Lais de Lima Costa
Dalton de Alencar Fisher Chamone Israel Bendit
Faculdade de Medicina, Universidade de São Paulo - USP, São Paulo, SP, Brazil
Conlict-of-interest disclosure:
The authors declare no competing inancial interest
Submitted: 8/29/2012 Accepted: 11/30/2012
Corresponding author: Vinícius Marcondes Rezende
Faculdade de Medicina da Universidade de São Paulo - FMUSP
Av. Dr. Arnaldo, 455, Cerqueira César 01246-000 São Paulo, SP, Brazil [email protected]
www.rbhh.org or www.scielo.br/rbhh
DOI: 10.5581/1516-8484.20130030
Objective: The goal of this study was to monitor imatinib mesylate therapeutically in the Tumor Biology Laboratory, Department of Hematology and Hemotherapy, Hospital das Clínicas, Faculdade de Medicina, Universidade de São Paulo (USP). A simple and sensitive method to quantify imatinib and its metabolite (CGP74588) in human serum was developed and fully validated in order to monitor treatment compliance.
Methods: The method used to quantify these compounds in serum included protein precipitation extraction followed by instrumental analysis using high performance liquid chromatography coupled with mass spectrometry. The method was validated for several parameters, including selectivity, precision, accuracy, recovery and linearity.
Results: The parameters evaluated during the validation stage exhibited satisfactory results based on the Food and Drug Administration and the Brazilian Health Surveillance Agency (ANVISA) guidelines for validating bioanalytical methods. These parameters also showed a linear correlation greater than 0.99 for the concentration range between 0.500 μg/mL and 10.0 μg/mL and a total analysis time of 13 minutes per sample. This study includes results (imatinib serum concentrations) for 308 samples from patients being treated with imatinib mesylate. Conclusion: The method developed in this study was successfully validated and is being eficiently used to measure imatinib concentrations in samples from chronic myeloid leukemia patients to check treatment compliance. The imatinib serum levels of patients achieving a major molecular response were signiicantly higher than those of patients who did not achieve this result. These results are thus consistent with published reports concerning other populations.
Keywords: Leukemia, myelogenous, chronic, BCR-ABL positive; Mass spectrometry; Chromatography, high pressure liquid; Pyrimidines/administration & dosage; Antineoplastic agents/administration & dosage; Therapeutic drug monitoring
Introduction
Imatinib mesylate (IM), also known as Gleevec, Glivec or STI571, is a tyrosine kinase inhibitor that was approved by the Food and Drug Administration (FDA) in 1999. After only a few years, IM became a revolutionary molecule in the treatment of chronic myeloid leukemia (CML). Because it is a selective inhibitor of the break point cluster region-c-Abelson fusion gene (BCR-ABL), IM has become the most effective treatment for CML over the last decade. After
ive years of treatment of CML patients who had not previously reached accelerated (AP) or blast crisis phases (BC) and who were in the early chronic phase (CP) [i.e., they started IM treatment
within 12 months of diagnosis and had not received any other treatments, such as interferon-alpha
(IFN-α) or an allogeneic stem cell transplant], the rates of complete cytogenetic response (CCR) (that is 0% Philadelphia chromosome - Ph) and progression-free survival were 87% and 90%,
respectively(1). Although these results are encouraging, 10% to 15% of treated patients still show resistance to IM treatment(1,2). The known mechanisms of resistance are mutations in the kinase domain of the ABL gene. IM binds to this region of the ABL gene to prevent phosphorylation of BCR-ABL1, thereby inhibiting its action as an activator of proliferation regulatory, differentiation regulatory and apoptosis inhibitory genes(3). Other less common resistance mechanisms (described in patients who have failed treatment) include BCR-ABL1 gene ampliication, expression of the multidrug resistance (MDR1) gene and its encoded P-glycoprotein (that expel IM from the inside of the CML cells)(2) and the absence of hOCT1 expression(4) or OCT1 protein activity, the action of which favors the entry of IM into CML leukemic cells(5).
IM has a bioavailability of approximately 98% when ingested orally, and because its
half-life is 20 hours, it can be administered once daily(6). Although the pharmacokinetic properties of IM are favorable, several cases of suboptimal responses have been described according to the European Leukemia Net(7,8), and even treatment failure due to variations in the plasma threshold of IM has been reported(9,10). IM is metabolized via the cytochrome P450 system;
speciically, the isoenzyme CYP3A4 is responsible for almost all IM metabolism. CGP74588,
Evaluating IM in the serum of CML patients has become an important parameter for achieving therapeutic levels of IM in patients susceptible to interactions with other drugs or only to adjust drug dosage(11). Numerous published studies have validated the use of chromatographic techniques to quantify IM and its
metabolite (CGP74588) in human plasma(12-14). The most widely
used technique for detecting this drug and its metabolite in patient serum is liquid chromatography coupled with mass spectrometry or ultraviolet spectrophotometry detection(15).
The goal of the present study is to report a method that was developed and has been fully validated to quantify imatinib
and its metabolite (CGP74588) in human serum. This method
has several advantages over previously published methods, particularly the decreased time required for sample processing
and analysis, the increased simplicity of the extraction method
and the reduced use of biological material, solvents and other materials and equipment(11,12,16-19).
The validated method can be used as an auxiliary tool for
monitoring patient compliance to imatinib mesylate treatment because it is able to detect and quantify therapeutic levels of this drug.
Methods
The method proposed to quantify imatinib in human
serum is based on a protein precipitation extraction technique
associated with an instrumental analysis using ultrafast liquid chromatography coupled with mass spectrometry (UFLC-MS), which has been fully validated.
Method validation
The method validation employs carefully planned
experiments to verify that the method achieves the prerequisites
for the proposed application. The parameters evaluated included selectivity, precision, accuracy, recovery and linearity. The procedures and evaluation criteria adopted comply with Resolution
RE 899 of the 2003 “Guide for bioanalytical method validation”
of the Brazilian Health Surveillance Agency (Agência Nacional de
Vigilância Sanitária – ANVISA) and the “Guidance for Industry:
Bioanalytical Method Validation” of the FDA, USA(20,21).
Materials: The biological material selected to develop and validate this method was human serum. Common materials found in analytical laboratories were used, such as type-1 deionized water,
high performance liquid chromatography (HPLC) grade methanol,
formic acid and pharmaceutical-grade ammonium acetate, 2-mL polypropylene centrifuge tubes, automatic pipettes, disposable plastic pipette tips and borosilicate glass vials with plastic caps (for the automatic injector). The equipment used included the
following: an R5424 Eppendorf centrifuge, a Shimadzu UFLC-MS liquid chromatograph consisting of a Prominence binary pump
system, automatic injector and column oven, and a LCMS2020 spectrometer (Shimadzu, Japan). The analytical standards for IM,
its metabolite CGP74588 and internal standards for imatinib-D8
were provided by Novartis (Brazil SA). To validate and prepare the calibration curves and quality controls, human serum samples that were free of the drug were obtained from voluntary donations at the
São Paulo Blood Center, São Paulo, Brazil. A total of six matrices
from different individuals were used, including four normal, one hyperlipidemic and one hemolyzed sample.
Instrument conditions: Chromatographic separation was
performed on a Phenomenex Luna C18 column (50 x 2 mm; 3 μm) using a water and methanol gradient for the mobile phase; both the methanol and water were supplemented with the modiiers
ammonium acetate (10 mM) and formic acid (0.1%). The run started with 20% methanol for 2 minutes with a linear gradient from 20% to
100% being later applied over seven minutes; 100% was kept until
the tenth minute, returning to the initial condition (20% methanol) to re-equilibrate the column for 3 minutes. The mass spectrometer employed an atmospheric pressure ionization interface in positive ESI (electrospray) mode. The detection parameters comprised the
coincidence of retention times (5.8 min) with ions monitored in a single ion monitoring (SIM) mode with m/z ratios of 494, 480 and 502 for imatinib, the metabolite CGP74588 and the deuterated internal standard Imatinib-D8, respectively.
Procedures
Preparation of solutions: The primary solution, working solution, calibration curve and quality controls were prepared. All solutions
were properly identiied and stored at 8°C in polypropylene tubes.
The primary solutions of imatinib, its metabolites and the internal
standard were prepared in 1 mL of 100% methanol (HPLC grade) to
obtain concentrations of 0.50 mg/mL, 0.50 mg/mL and 0.25 mg/mL, respectively. From these primary solutions, working solutions were
prepared as mixtures of imatinib and its metabolite (CGP74588) at a inal concentration of 200 μg/mL; these mixtures were the precursor
solutions for preparing the calibration curves and the quality controls.
The calibration curve consisted of a blank (biological matrix not
containing the drug standard and internal standard), a zero sample
(biological matrix processed with the internal standard) and eight
samples containing the drug standard and internal standard. All
unknown samples were stored at -20°C prior to quantiication.
Preparation of samples: The established and validated
extraction procedure consisted of 100-mL aliquots of serum
samples [corresponding to the blank, zero, calibration controls, quality controls (QCA, QCB, QCC) and unknown samples] in
2.0-mL polypropylene tubes. Subsequently, 50 mL of the internal
standard solution (Imatinib-D8 solution, 5.0 mg/mL) and 400 mL
of chilled methanol were added to the respective samples and stirred
for 20 s. The tubes were centrifuged for 15 minutes at 16,000 x g,
and the supernatants were transferred to glass vials and stored in the automatic injector until analysis. In total 2 mL of each sample was injected into the chromatographic system.
Analysis of samples
The method was applied to different doses of imatinib in serum
samples from 308 patients whose BCR-ABL gene measurements had been quantiied (to monitor disease progression based on
deined conditions. To validate this method, intra-run and
inter-run precision tests (intermediate precision) were performed. The
precision was expressed as a relative standard deviation (RSD) or coeficient of variation (CV%), not including values greater than 15% (except for the LLOQ, for which values less than or equal to
20% were included)(20).The imatinib results obtained were as follows: 2.0% RSD for intra-assay tests and 5.5% RSD for inter-assay tests.
The results for the metabolite (CGP74588) were as follows: 1.6%
RSD for intra-assay tests and 6.2% for inter-assay tests.
Accuracy: The accuracy of a method provides a measure of the
proximity between the experimental results and the magnitude of
the nominal values being evaluated, which should be determined in the same analytical run (intra-run precision), as well as
between runs (inter-run precision). Deviations should not exceed 15%, except for the limit of quantiication, for which deviations
less than or equal to 20% are permissible(20). The imatinib results
obtained were as follows: 102.2% accuracy for intra-assay
tests and 101.1% accuracy for inter-assay tests. The metabolite
(CGP74588) results obtained were as follows: 108.9% accuracy for intra-assay tests and 104.8% accuracy for inter-assay tests.
Recovery: The eficiency of an extraction procedure for a
bioanalytical and analytical method within a limit of variation is measured by the recovery. A percent recovery near 100% for
the analyte and the internal standard is desirable; however, lower
values are acceptable since the recovery is precise and accurate(20). To validate the method, the recovery was evaluated using different types (normal, hemolyzed and lipemic) of human serum at three concentration levels (QCA, QCB and QCC). For this method, the recovery obtained for the different types of human serum and
over the intended concentration range was approximately 100%.
Linearity: Three calibration curves were prepared, analyzed independently and evaluated. Each concentration was calculated by correlating the nominal concentration with the ratio between the area of the analyte and the area of the internal standard (response).
The calibration curves had determination coeficients greater than 0.98, and the deviations of each calibration solution in relation to its nominal value did not exceed 20% for the LLOQ or 15% for
all other concentrations, clearly reaching the ANVISA Resolution
RE 899 standards of 2003. Except for the calibration solutions at the extremes, which were prepared in duplicate, calibration
curves were prepared using single calibration solutions.
Limits of detection and quantiication: The LOD was determined as the concentration capable of producing a response in the instrumental analysis with a signal/noise ratio greater than
3; the LOD was 0.100 mg/mL in these experiments. The lower
limit of quantiication was 0.500 mg/mL, which was validated for
accuracy and precision as described herein and had a signal/noise
ratio greater than 10 compared to blank matrix samples.
Stability: Based on these validated procedures, the standards
and imatinib samples in serum showed no signiicant degradation
within the limits adopted by the laboratory for the temperature, humidity, time and materials used.
corresponding sample numbers). The following conditions applied
to the statistical analyses: (i) only the results of patients with these two results (imatinib serum levels and BCR-ABL quantiication)
were included, and (ii) the patients with imatinib concentrations < 0.100 mg/mL (limit of detection - LOD) were excluded. A total
of 308 samples were included in the study. This set of 308 samples was further divided into two subgroups: one with 223 samples that
achieved better treatment response (MMR) (i.e., a BCR-ABL/BCR
ratio ≤ 0.1% according to an international scale)(22) and another
with the remaining 85 samples (non-MMR). Statistical analyses were based on calculations of mean, median and irst and third quartile values. The irst quartile (Q1) is the value below which
25% of the observations fall, and the third quartile (Q3) is the value below which 75% of the observations fall. Thus, the Q1-Q3 interval corresponds to 50% of the observations. The results were compared to recently published reports.
Calculations and statistical analyses
Data were recorded in Microsoft Excel® 2010 spreadsheets
for statistical analyses. Calculations were performed using the program’s preset functions and graphs were generated using the
“Histogram” data analysis tool. The concentration calculations
and correlation of the calibration curves in the instrumental
analysis (HPLC-MS) were performed using LC-Solutions®
equipment software (Shimadzu, Japan).
Results
Method validation was fully completed, including the parameters, procedures and limits recommended by the bioanalytical guidelines(20,21). The parameters that were evaluated included selectivity, precision, accuracy, recovery at three concentration levels (QCA 1.50 mg/mL, QCB 4.50 mg/mL and QCC
8.10 mg/mL) and linearity with standard samples at concentrations
of 0.500, 1.00, 2.00, 4.00, 6.00, 8.00 and 10.0 mg/mL.
Selectivity: Selectivity deines the ability of the method to identify a
compound in the presence of other components (such as impurities,
degradation products and matrix components)(20,23).To validate this method, the occurrence of carry-over in the chromatographic system, cross-talk in the spectrometer and interferences in response to the
sample matrix used as a blank were determined. To evaluate carry-over,
the standard with the highest concentration was injected followed by a blank solvent sample. For cross-talk testing, analytes and the internal standard were individually injected. To determine whether there
was interference in the blank sample, the extraction procedure was
performed on a sample containing no analytes or internal standards, and the resulting solution was analyzed using the chromatographic
conditions proposed in the method; these results were compared with
the results obtained using an analyte sample at a concentration near
the lower limit of quantiication (LLOQ) that was determined in the solvent. No signiicant effects were observed (greater than 20% of LLOQ) that would affect the accuracy of quantiication.
Precision: Precision corresponds to the agreement between results
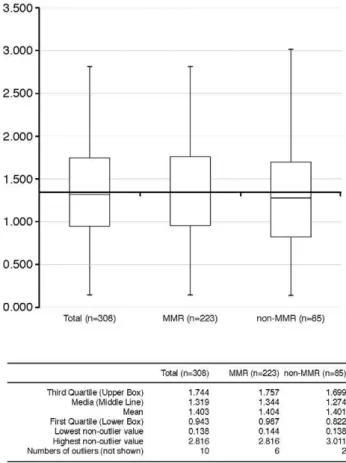
Therapeutic monitoring: In the 308 samples analyzed, the
imatinib serum levels were between 0.138 mg/mL and 2.816 mg/mL.
The median and mean were 1.319 mg/mL and 1.403 mg/mL, respectively. In the subset whose samples achieved MMR (223 samples), imatinib serum concentrations were between 0.144 mg/mL
and 2.816 mg/mL, and the median and mean were 1.344 mg/mL and
1.404 mg/mL, respectively. In the subset where MMR was not
observed (non-MMR, n = 85), imatinib serum concentrations
were between 0.138 mg/mL and 3.011 mg/mL and the median and
mean were 1.274 mg/mL and 1.401 mg/mL, respectively.
Figure 1 shows a histogram of the distribution of imatinib
concentrations in the MMR samples. The ranges deined by
quartiles and frequencies are indicated on the histogram. Figure 2
shows the results of three sets of data in a box-plot, as well as the
parameters used to calculate these data.
Discussion
Imatinib mesylate is still the drug of choice for treating CML(24). Several studies have suggested that treatment with
decreasing doses of imatinib mesylate, ranging from 800 mg/day
to 400 mg/day, would yield a better treatment response for CML in the chronic phase of the disease. These results were obtained by monitoring blood levels of imatinib and comparing these levels to response indicators, such as the hematological response (HR), cytogenetic response (CR) and the molecular response (MR) to BCR-ABL/gene control(25). Dose-reduction studies, such
as the Phase 3 clinical studies designated TOPS (acronym for
Tyrosine Kinase Inhibitor Optimization and Selectivity), which
compared 400 mg/day doses to 800 mg/day doses, have reported reductions in adverse side effects. The TOPS studies showed that
both the MMR and the CCR occurred more quickly in patients
who received 800 mg/day doses, although the responses achieved
by both dosages were equivalent at the end of one year(25). Thus, it is worth assessing the relationship between imatinib
dosage (and its levels in the blood) and the eficacy of treatment
(measured by CCR and MMR) as a means of titrating the dose
to reduce adverse side effects while maintaining the beneits of
treatment. One recently published study showed that at steady state, the minimum imatinib levels are relatively stable over time and proportional to the dose administered. The study also showed that patients with concentrations above 1.165 mg/mL after the
irst month of treatment achieved MMR and CCR more quickly
after one year of follow-up(26).
Doses of imatinib
Figure 1 shows signiicant differences in the distribution of values between the following three data sets: (i) all of the
data, (ii) only patients who achieved MMR, and (iii) patients for which MMR was not achieved (non-MMR). These results indicate that in a given population, maintaining higher serum concentrations is directly related to achieving MMR, while low serum concentrations correlate with a failure to achieve MMR. In fact, the highest mean (and median) concentrations occurred in the MMR subgroup. These results are notably similar to results previously reported for other populations(9,10,26).
Figure 1 - Distribution of imatinib serum concentrations observed in the samples from the better treatment response subgroup (n = 223). Vertical dashed lines mark the irst quartile (0.986 μg/mL), median (1344 μg/mL) and third quartile values (1.752 μg/mL)
Figure 2 - Serum concentrations of imatinib observed in the samples (Set 1: Total - n = 308; Set 2: MMR only - n = 223; Set 3: non-MMR - n = 85). There is a signiicant difference in the distribution of values between sets, especially in relation to the median and amplitude of the values.
It is noteworthy that the serum concentrations measured in the present study were higher than those previously reported for
plasma. This result indicates that the serum matrix used in this
study contains relatively higher concentrations of imatinib(10,16,26).
Population differences that have not been taken into account may
also affect this comparison.
The results herein demonstrate the importance of implementing validated analytical methods to monitor imatinib levels in the blood to better individualize treatment, particularly
for individuals who have adverse or exacerbated side effects or
that present with abnormal MMR and CCR(26,27).
Although previous studies have employed liquid chromatography to quantify imatinib and its metabolite
(CGP74588), the objective of the present study was to develop and fully validate a method that quantiies imatinib and its metabolite
in human serum using UFLC-MS with a single quadrupole mass detector adapted for routine laboratory application. This validated method has several advantages over previously published methods, including decreased consumption of materials, solvents and reagents, greater speed of analysis and increased simplicity of sample preparation. These advantages render the method robust
enough to quantify approximately one hundred samples per day
with decreased generation of chemical or biological waste.
Conclusions
The method developed in this study is speciic, selective,
robust, precise and accurate for quantitatively analyzing imatinib
and its metabolite CGP74588 with a low limit of quantiication
(0.500 mg/mL) and a low limit of detection (0.100 mg/mL) in serum. These concentration detection levels are suitable for detecting therapeutic doses of the medication. This method has been fully validated for several parameters, including selectivity, precision, accuracy, linearity, recovery, limits of detection and
limits of quantiication, and the technique meets the criteria
established by the FDA and ANVISA validation guidelines. Based on these results and their agreement with previously published reports, it is essential for research centers to implement validated analytical methods to monitor imatinib levels in the blood during CML treatment to better individualize therapy while
minimizing adverse side effects and maximizing the therapeutic
effects of the treatment.
The Laboratory of Tumor Biology of the Hematology
Service at HC-FMUSP has successfully implemented routine
analyses of imatinib in serum as a means of diagnostic support during treatment, demonstrating that it is an important tool in monitoring treatment compliance.
References
1. Druker BJ, Guilhot F, O’Brien SG, Gathmann I, Kantarjian H, Gattermann N, Deininger MW, Silver RT, Goldman JM, Stone RM, Cervantes F, Hochhaus A, Powell BL, Gabrilove JL, Rousselot P, Reiffers J, Cornelissen JJ, Hughes T, Agis H, Fischer T, Verhoef G, Shepherd J, Saglio G, Gratwohl A, Nielsen JL, Radich JP, Simonsson B, Taylor K, Baccarani M, So C, Letvak L, Larson RA; IRIS Investigators. Five-year follow-up of patients receiving imatinib for chronic myeloid leukemia.
N Engl J Med. 2006;355(23):2408-17. Comment in: N Engl J Med. 2007;356(17):1780; author reply 1780.
2. Hochhaus A, La Rosée P. Imatinib therapy in chronic myelogenous leukemia: strategies to avoid and overcome resistance. Leukemia. 2004;18(8):1321-31.
3. Kantarjian HM, Giles F, Quintás-Cardama A, Cortes J. Important therapeutic targets in chronic myelogenous leukemia. Clin Cancer Res. 2007;13(4):1089-97.
4. Nardelli J, Sanabani SS, Didone A, Ferreria P de B, Serpa M, Novaes MM, et al. Pretheraputic expression of hoct1 gene predict a complete molecular response to imatinib mesylate in chronic myeloid leukemia chronic phase. Acta Haematol. 2012;127(4):228-34.
5. White DL, Dang P, Engler J, Frede A, Zrim S, Osborn M, et al. Functional activity of the oct-1 protein is predictive of long-term outcome in patients with chronic-phase chronic myeloid leukemia treated with imatinib. J Clin Oncol. 2010;28(16):2761-7.
6. Peng B, Hayes M, Resta D, Racine-Poon A, Druker BJ, Talpaz M, et al. Pharmacokinetics and Pharmacodynamics of imatinib in a phase i trial with chronic myeloid leukemia patients. J Clin Oncol. 2004;22(5):935-42. Comment in: J Clin Oncol. 2005;23(16):3855-6; author reply 3857-8. 7. Baccarani M, Saglio G, Goldman J, Hochhaus A, Simonsson B,
Appelbaum F, Apperley J, Cervantes F, Cortes J, Deininger M, Gratwohl A, Guilhot F, Horowitz M, Hughes T, Kantarjian H, Larson R, Niederwieser D, Silver R, Hehlmann R; European LeukemiaNet. Evolving concepts in the management of chronic myeloid leukemia: recommendations from an expert panel on behalf of the European LeukemiaNet. Blood. 2006;108(6):1809-20.
8. Baccarani M, Cortes J, Pane F, Niederwieser D, Saglio G, Apperley J, Cervantes F, Deininger M, Gratwohl A, Guilhot F, Hochhaus A, Horowitz M, Hughes T, Kantarjian H, Larson R, Radich J, Simonsson B, Silver RT, Goldman J, Hehlmann R; European LeukemiaNet. Chronic myeloid leukemia: an update of concepts and management recommendations of European leukemiaNet. J Clin Oncol. 2009;27(35):6041-51. Comment in: J Clin Oncol. 2010;28(18):e310; author reply e311.
9. Picard S, Titier K, Etienne G, Teilhet E, Ducint D, Bernard MA, et al. Trough imatinib plasma levels are associated with both cytogenetic and molecular responses to standard-dose imatinib in chronic myeloid leukemia. Blood. 2007;109(8):3496-9. Comment in: Blood. 2007;110(5):1699-701; author reply 1701.
10. Larson RA, Druker BJ, Guilhot F, O’Brien SG, Riviere GJ, Krahnke T, Gathmann I, Wang Y; IRIS (International Randomized Interferon vs STI571) Study Group. Imatinib pharmacokinetics and its correlation with response and safety in chronic-phase chronic myeloid leukemia: a subanalysis of the IRIS study. Blood. 2008;111(8):4022-8.
11. Awidi A, Salem II, Najib N, Meleh R, Tarawneh B. Determination of imatinib plasma levels in patients with chronic myeloid leukemia by high performance liquid chromatography-ultraviolet detection and liquid chromatography-tandem mass spectrometry: methods’ comparison. Leuk Res. 2010;34(6):714-7.
12. Parise RA, Ramanathan RK, Hayes MJ, Egorin MJ. Liquid chromatographic-mass spectrometric assay for quantitation of imatinib and its main metabolite (CGP 74588) in plasma. J Chromatogr B Analyt Technol Biomed Life Sci. 2003;791(1-2):39-44.
13. Roth O, Spreux-Varoquaux O, Bouchet S, Rousselot P, Castaigne S, Rigaudeau S, et al. Imatinib assay by HPLC with photodiode-array UV detection in plasma from patients with chronic myeloid leukemia: Comparison with LC-MS/MS. Clin Chim Acta. 2010;411(3-4):140-6. 14. Davies A, Hayes AK, Knight K, Watmough SJ, Pirmohamed M, Clark RE.
15. Mičová K, Friedecký D, Faber E, Polýnková A, Adam T. Flow injection analysis vs. ultra high performance liquid chromatography coupled with tandem mass spectrometry for determination of imatinib in human plasma. Clin Chim Acta. 2010;411(23-24):1957-62.
16. Titier K, Picard S, Ducint D, Teilhet E, Moore N, Berthaud P, et al. Quantiication of imatinib in human plasma by high-performance liquid chromatography-tandem mass spectrometry. Ther Drug Monit. 2005;27(5):634-40. Erratum in: Ther Drug Monit. 2005;27(6):810. 17. Solassol I, Bressolle F, Philibert L, Charasson V, Astre C, Pinguet F.
Liquid chromatography-electrospray mass spectrometry determination of imatinib and its main metabolite, N-desmethyl-imatinib in human plasma. J Liquid Chromat Related Technol. 2006;29(17/20): 2957-74. 18. Bakhtiar R, Khemani L, Hayes M, Bedman T, Tse F. Quantiication of the
anti-leukemia drug STI571 (Gleevec) and its metabolite (CGP 74588) in monkey plasma using a semi-automated solid phase extraction procedure and liquid chromatography-tandem mass spectrometry. J Pharm Biomed Anal. 2002;28(6):1183-94.
19. Miura M, Takahashi N, Sawada KI. Quantitative determination of imatinib in human plasma with high-performance liquid chromatography and ultraviolet detection. J Chromatogr Sci. 2011;49(5):412-5.
20. Brasil. Agência Nacional de Vigilância Sanitária (ANVISA). Resolução RE nº 899, de 29 de maio de 2003. Guia para validação de métodos analíticos e bioanalíticos Brasília: ANVISA; 2003. Available from: http://portal. anvisa.gov.br/wps/wcm/connect/4983b0004745975da005f43fbc4c6735/ RE_899_2003_Determina+a+publica%C3%A7%C3%A3o+do+Guia+ para+valida%C3%A7%C3%A3o+de+m%C3%A9todos+anal%C3% ADticos+e+bioanal%C3%ADticos.pdf?MOD=AJPERES.
21. Food and Drug Administration (FDA). Guidance for industry: bioanalytical method validation. Bethesda: FDA: 2001. Available from: http://www.fda.gov/downloads/Drugs/.../Guidances/ucm070107.pdf. 22. Hughes T, Deininger M, Hochhaus A, Branford S, Radich J, Kaeda J,
et al. Monitoring CML patients responding to treatment with tyrosine kinase inhibitors: review and recommendations for harmonizing current methodology for detecting BCR-ABL transcripts and kinase domain mutations and for expressing results. Blood. 2006;108(1):28-37. Comment in: Blood. 2007;109(5):2263; author reply 2263-4.
23. Vessman J, Stefan RI, Staden JF, Danzer K, Lindner W, Burns DT, et al. Selectivity in analytical chemistry (IUPAC Recommendations 2001). Pure Appl Chem.;73(8):5.
24. Teng JF, Mabasa VH, Ensom MH. The role of therapeutic drug monitoring of imatinib in patients with chronic myeloid leukemia and metastatic or unresectable gastrointestinal stromal tumors. Ther Drug Monit. 2012;34(1):85-97.
25. Cortes J, Giles F, O’Brien S, Thomas D, Garcia-Manero G, Rios MB, et al. Result of high-dose imatinib mesylate in patients with Philadelphia chromosome-positive chronic myeloid leukemia after failure of interferon-alpha. Blood. 2003;102(1):83-6.
26. Guilhot F, Hughes T, Cortes J, Druker BJ, Baccarani M, Gathmann I, et al. Plasma exposure of imatinib and its correlation with clinical response in the Tyrosine Kinase Inhibitor Optimization and Selectivity Trial. Haematologica. 2012;97(5):731-8.
27. Guilhot F, Roy L, Tomowiak C. Current treatment strategies in chronic myeloid leukemia. Curr Opin Hematol. 2012;19(2):102-9.