Distributions of Virus-Like Particles and
Prokaryotes within Microenvironments
Lisa M. Dann1*, James S. Paterson1, Kelly Newton1, Rod Oliver2, James G. Mitchell1
1School of Biological Sciences at Flinders University, Adelaide, South Australia,2Land and Water Research Division at the Commonwealth Scientific and Industrial Research Organisation (CSIRO), Adelaide, South Australia
Abstract
Microbial interactions are important for ecosystem function, but occur at the microscale and so are difficult to observe. Previous studies in marine systems have shown significant shifts in microbial community abundance and composition over scales of micrometres to centi-metres. This study investigates the microscale abundance distributions of virus-like parti-cles (VLPs) and prokaryotes in the lower reaches of a river to determine the extent to which microscale microbial patchiness exists in freshwater systems. Here we report local hotspots surrounded by gradients that reach a maximum 80 and 107 fold change in abundance over 0.9 cm for prokaryotic and VLP subpopulations. Changes in prokaryotic and VLP hotspots were tightly coupled. There were no gradients at tens of centimetres across the boundary layers, which is consistent with strong mixing and turbulence-driven aggregation found in river systems. Quantification of the patchiness shows a marked asymmetry with patches 10 times greater than background common, but depletions being rare or absent in most sam-ples. This consistent asymmetry suggests that coldspots depleted by grazing and lysis are rapidly mixed to background concentrations, while the prevalence of hotspots indicates per-sistence against disruption. The hotspot to coldspot relative abundance may be useful for understanding microbial river dynamics. The patchiness indicates that the mean- field approach of bulk phase sampling misses the microbially relevant community variation and may underestimate the concentrations of these important microbial groups.
Introduction
Heterotrophic prokaryotes are crucial to freshwater systems as they cycle important nutrients, such as nitrogen, carbon and phosphorus [1,2]. Similarly, viruses are likely key players in freshwater ecosystems as they affect primary production, nutrient and dissolved organic matter release, genetic exchange between microorganisms and control bacterial community composi-tion and abundance via viral-mediated lysis [3–7]. The distributions of these microbial com-munities have often been considered homogeneous, leading to mean-field approach sampling whereby bulk phase millilitre to litre samples were considered representative of microbial microscale processes [2]. However, previous studies on patch dynamics within aquatic and OPEN ACCESS
Citation:Dann LM, Paterson JS, Newton K, Oliver R, Mitchell JG (2016) Distributions of Virus-Like Particles and Prokaryotes within Microenvironments. PLoS ONE 11(1): e0146984. doi:10.1371/journal. pone.0146984
Editor:Newton CM Gomes, University of Aveiro, PORTUGAL
Received:September 22, 2015
Accepted:December 23, 2015
Published:January 19, 2016
Copyright:© 2016 Dann et al. This is an open access article distributed under the terms of the
Creative Commons Attribution License, which permits unrestricted use, distribution, and reproduction in any medium, provided the original author and source are credited.
Data Availability Statement:All relevant data are within the paper and its Supporting Information file.
Funding:Commonwealth Scientific and Industrial Research Organisation provided a PhD top up scholarship and consumbables for LD. General support was provided by Australian Research Council grants to JGM. The funders had no role in study design, data collection and analysis, decision to publish, or preparation of the manuscript.
terrestrial ecosystems confirm heterogeneous spatial distributions are common in most organ-isms. For instance, biodiversity‘hotspots’are observed in flora and terrestrial vertebrate species [8,9], with 20% of all plant diversity found in 18 hotspots that accounted for only 0.5% of the Earth’s land area [10,11]. In addition, for marine environments, it is well accepted that micro-bial abundance and activity differ by orders of magnitude over micrometres to centimetres [1, 2,12–16], with previous studies showing 45 to 2584 fold cm-1variation in bacterial and viral abundance [17], and therefore indicating deficiencies within the mean-field sampling approach.
As microbial communities interact at micrometre to millimetres scales, to understand these microscale processes and dynamics, it is important to analyse their distributions at such scales. Microscale sampling is an important supplement when precise abundance estimates are neces-sary, the local interactions may reveal processes not observed by bulk sampling or for localizing particular populations. Determining the microscale abundance distribution is important as it indicates the microbial structure present at the scale of microbial food webs. Determining the microscale abundance distribution is important as it indicates the microbial structure present at the scale of microbial food webs. However, in freshwater systems, studies of microbial distri-butions often still adopt the mean-field approach, therefore excluding direct examination of important ecological associations between microbial communities [18–22].
Associations between microbial populations are often observed within microscale distribu-tions in the form of heterogeneous“hotspots”[1,10–13,19,23]. Hotspots are areas of elevated bacterial or viral abundance, which can result from bacterial accumulation around high nutri-ent concnutri-entration areas via chemotaxis, aggregation or disintegration of particles, small scale water mixing and the occurrence of grazing in adjacent areas or interactions with suspended particles [15,24–26].
Within fluvial systems suspended particulate inorganic and organic matter are often found in high concentrations [27]. This particulate organic matter (POM) can comprise a range of different materials, such as biofilms, soils, riparian vegetation or autochthonous algae, and is an important source of energy as bacterial communities contribute to the decomposition and remineralisation of this POM [28–31]. Previous studies have found higher heterogeneity, and often abundances, within particle-associated, rather than free living communities, with parti-cle-associated bacteria contributing to approximately 30.34% of total bacterial abundance [32–
34]. Particle-associated bacterial communities, such as those found on river snow particles, are important to system function as they contribute to a significant amount of production and activity [33,35–38].
The presence of these particles also impacts viral communities, with viral abundance on sus-pended particulate matter ranging from 105to 1011particles ml-1or between 0.4% and 35% of total viral abundance [33,34]. Viral attachment to particles and/or the presence of particulate matter can result in different ecological consequences; for instance, a loss of infectivity as a result of viral adsorption to solid particles, which causes a reduction in viral infection and lysis and a subsequent increase in free-living prokaryotic growth [29]. In addition, prolonged sur-vival or increased phage production and transduction can result from viral particle attachment as high viral abundances on riverine particles may represent microenvironments of heightened viral infection and lysis of bacterial communities [29,33,39–42].
possible eddies for a given fluid viscosity [46]. For rivers, where the viscosity is close to that of pure water, the Kolmogorov eddy length is approximately 1–10 mm [47,48]. When eddies and heterogeneities are the same size, mixing is the most efficient homogenizing signals. This is rel-evant for this paper because our sampling interval is right at the scale where there should be the most homogeneity [44].
While the high shear of Kolmogorov eddies efficiently erase gradients of microbes and nutrient signals [49–51], many eddies are much larger, which can create conditions for cluster-ing [51]. This is because low shear environments are characterised by eddies with long life-times, which allow microscale nutrient patch formation and consequently chemotactic swarming of bacteria. The lifetimes of these Kolmogorov eddies differ depending on turbu-lence, with freshwater environments having eddy lifetimes of approximately 1,000 seconds and lengths of greater than 3 cm [47,51]. Shear then helps determine where hotspots and coldspots can form, their size and their lifetime [22,47,51,52].
Previously, hotspot discrimination has remained qualitative, identifying abundance regions
‘elevated’above background. However, a quantitative method developed by Dannet al. [17] discriminated hotspot, coldspot and background via rank abundance graphs, separating sam-ple values based on their slope and line of best fit. Hotspots were shown to have steep slopes and follow a power law best fit, coldspots and background values follow linear best fits, while coldspots had steeper slopes than background values [17]. The aim of this study was to test the hypothesis thatmicroscale VLP and prokaryote abundance variations occur in rivers. To test this, the microscale distributions of prokaryote and VLP subpopulations within the Murray River were analysed at millimetre resolution.
Materials and Methods
Sample Collection
Freshwater samples were collected from the Murray River at Murray Bridge, South Australia (-35°12, 139°28). Sampling occurred on June 14th, 2012 at 11 am. Daily summary data showed a water level of 0.45 metres, and electrical conductivity (EC) of 325 uS/cm (Long Island Site ID: A4261162) [53]. Water flow rates ranged from 0.01 m/s to 0.09 m/s. The flow rates were deter-mined via velocity profiles using a Flo-Mate (Model 2000) current and flowmeter. Velocity profiles were taken via fixed time averaging with 60 second intervals. Specific permission to access the sampling site was not required. The field study did not involve endangered or pro-tected species.
Triplicate samples were collected at the sediment-water and air-water interface from three locations each separated by 10 metres. Samples were collected using a two-dimensional sam-pler trialled previously [17]. The samsam-pler, a 3 x 12-well microplate with a glass cover collected three vertical profiles, each containing 12 sample points, ranging from 1.4 cm to 11.3 cm from the sediment- and air-water interface with a sampling resolution of 0.9 cm.
Once collected, samples were transferred into 2 ml cryovials containing 4μl of
glutaralde-hyde (0.5% final concentration) and stored in the dark at 4°C for 15 minutes. Samples were then quick frozen in liquid nitrogen and stored at -80°C until analysis [54,55]. Flow cytometric analysis was performed within three weeks to avoid sample deterioration [54].
Flow cytometry. For prokaryote and VLP enumeration, samples were thawed and diluted 1:100 with Tris-EDTA buffer (pH 8.0, 0.2μm filtered, 10 mM Tris, 1 mM EDTA) and stained
Flow cytometry was performed on a FACSCanto II flow cytometer (BD) using a phosphate-buffered saline (PBS) solution as sheath fluid. Forward-angle light scatter (FSC), right-angle light scatter (SSC) and green fluorescence (SYBR I) were collected for each sample. Each sam-ple was run at a low flow rate setting to obtain less than 1000 events per second. Reference fluo-rescent yellow beads (1μm diameter, Molecular Probes) were added to each sample as an
internal size and concentration standard with flow cytometer settings normalised to fluores-cence and bead concentration [25,59]. Epifluorescent microscopy was used to ensure bead reli-ability by confirming a final concentration of approximately 105beads ml-1per sample [57, 59–61]. Flow cytometric data was exported as FCS 3.0 files and prokaryotic and VLP subpopu-lation enumeration was performed using FlowJo (Tree Star, Inc.) [61]. VLP and prokaryotic subpopulations were discriminated via peaks in monoparametric histograms of SYBR green fluorescence and saturated regions in biparametric cytograms of SYBR green fluorescence and side-scatter [17,54,56,58,62].
Microscale Distribution Analysis
The microscale distributions of prokaryotic and VLP subpopulations at the air- and sediment-water interface were determined via flow cytometric abundance counts in each sample well of the vertical profiles collected. From this, two-dimensional contour plots were constructed using Surfer 10 (Golden Software, Inc.). Background values reported are the median values in the dataset rather than the mean, as inclusion or exclusion of the hotspot values did not overly affect the median values [63].
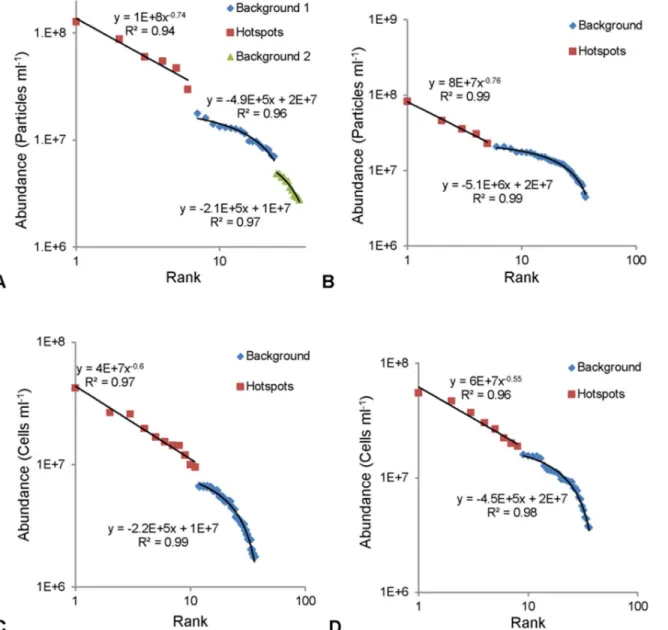
For this study, hotspot and background values were determined via rank abundance graphs [17]. Briefly, background values were those that fitted a linear trend and hence were indistin-guishable from a random distribution, whilst the hotspot values exceeded this linear fit, exhibit-ing a steep power law trend, indicatexhibit-ing their non-random nature [17].
Subpopulation Correlations
Pearson’s correlation coefficients were performed for each vertical profile collected at the air-and sediment-water interface air-and theαof 0.05 was reduced by sequential Bonferroni [64]. All
possible subpopulation correlations were considered in order to identify potential relationships between the VLP and prokaryotic subpopulations. Two-sample t-tests were employed to iden-tify possible abundance differences between the air- and sediment-water interface.
The VLP to prokaryote ratio (VPR) was used as a potential indicator of VLP and prokaryote interactions. Previous studies used the patchine to investigate the biological dynamics of sys-tems [57]. Higher VPRs are typically found in more productive and nutrient-rich ecosyssys-tems with the suggestion that these conditions favour maximum prokaryotic growth and productiv-ity [7,65,66].
Spatial Autocorrelation Analysis
72]. Moran’s I and Geary’s C identify whether two-dimensional and multi-directional correla-tions are present between proximate sample points that have similar values [69,71,72]. Ana-lysing the spatial autocorrelation in VLP and prokaryotic microscale distributions via Moran’s I and Geary’s C builds on previous work by Dannet al. [17].
Moran’s I. Moran’s I spatial autocorrelation statistics test (CrimeStat 3.3, Ned Levine soft-ware) was used to identify the degree of spatial dependence present in the VLP and prokaryotic subpopulations. The equation for Moran’s I is:
I¼N
X
iXjWij Xi X
Xj X
X
iXjWij
X
i Xi X
2 Eq
: 1
WhereNrefers to the sample number,XiandXjare the variable values at specific locations, i and j (where i6¼j),Xis the mean of the variable andWijis the weight applied to the i and j comparison. A weighted Moran’s I test was chosen as this applies a weight value of 1 and 0 to adjacent and non-adjacent sample points respectively.
Moran’s I [72] is a global statistical test used to identify spatial dependence within a dataset. It is multi-directional as it can use vertical, horizontal and diagonal directional analysis for cor-relation calculations. Moran’s I has a value range from +1 to -1, with +1 indicating perfect clus-tering where high/low values are proximate, -1 indicating perfect dispersion where high/low values are found far apart and zero being indicative of a random distribution. For Moran’s I, the critical cut-off values are often established through a collation of previous literature using the same or similar scales or values. This information is lacking for prokaryotes and viruses and the critical cut-off values for small-scale spatial studies are unknown.
Moran Correlograms. Moran correlograms were created using CrimeStat 3.3 whereby output values from Moran’s I statistic were applied to two pairs of sample values that were sep-arated by a chosen lag distance, in this instance 0.9 cm, the distance between each well in the sampler used.
Significance was determined by the standard error obtained from Moran’s I and the degree of spatial autocorrelation was determined via the output values given for each lag distance in the correlograms. From this, the level of spatial dependence could be identified at each sample distance as opposed to the whole sampling area, as was achieved in the Moran’s I statistic.
Geary’s C. Geary’s C spatial autocorrelation test [71] within CrimeStat 3.3 was used to identify deterministic patterning of extreme values and non-spatially related chance phenom-ena within the dataset. The equation for Geary’s C is:
C¼ðN 1Þ
X
iXjWij Xi Xj
2
h i
2 XiXjWij
X
i Xi X
2 Eq
: 2
All terms are the same as inEq 1.
Geary’s C is more sensitive to local clustering and can be used in conjunction with Moran’s I. The Geary’s C statistical test is similar to Moran’s I, however spatial dependence is calculated via the deviation in intensity of each sample value’s location compared to one another, whereas Moran’s I calculates spatial dependence via the cross-product of the deviations from the mean within the sample values.
Geary’s C has a value range from 0 to approximately 2, with no definitive upper limit [46]. Spatial independence is indicated by a value of 1 whilst positive spatial autocorrelation is indi-cated by values<1 and negative spatial autocorrelation is indicated by values>1. Thus,
Results
Prokaryotic and VLP abundance
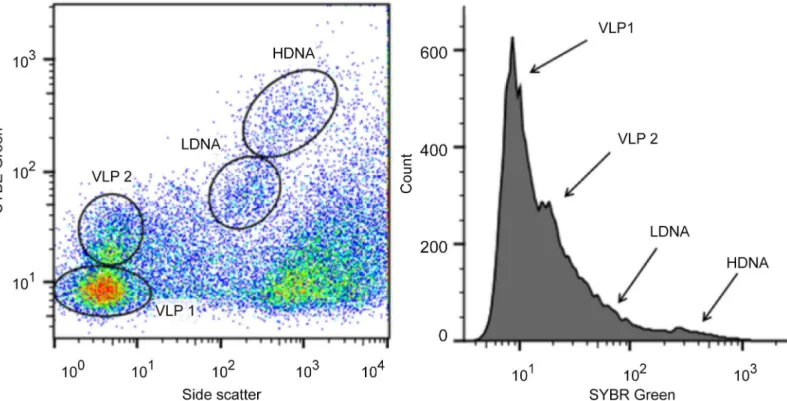
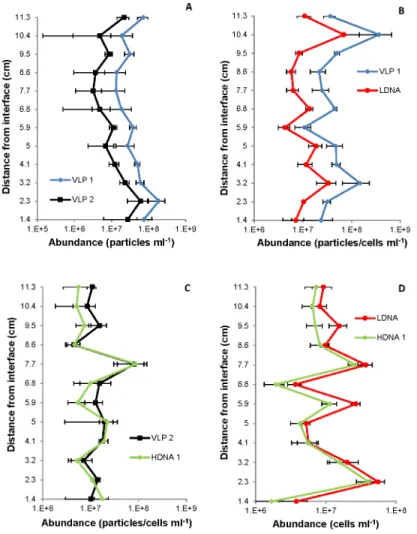
Flow cytometric analysis revealed two prokaryotic subpopulations, referred to as a low- and high-density nucleic acid prokaryote population (LDNA and HDNA), and two virus-like parti-cles (VLP 1 and VLP 2) subpopulations (Fig 1). From all the samples collected, the mean VLP 1 abundance ranged from 5.4 to 6.7 x 10⁷particles ml-1(95%CI = 7.2 x 10⁶particles ml-1, n = 648) whilst mean VLP 2 abundance ranged from 1.7 to 2.1 x 10⁷particles ml-1(95% CI = 2.3 x 10⁶particles ml-1, n = 648) (S1 Table). The mean prokaryotic abundances were lower than the VLP mean abundances, with the mean abundance of the LDNA subpopulation ranging from 1.3 to 1.6 x 10⁷cells ml-1(95%CI = 1.3 x 10⁶cells ml-1, n = 648) and the HDNA subpopulation exhibiting mean abundances that ranged from 0.9 to 1.5 x 10⁷cells ml-1(95% CI = 1.9 x 10⁶cells ml-1, n = 648) (S2 Table). This resulted in a VPR ranging from 0.4 to 3.4 (S3 Table). In all samples, the VLP 1 abundance was higher than VLP 2 and the HDNA abundance was equal to or less than the LDNA abundance (S1andS2Tables). There was no significant difference in VLP and prokaryotic mean abundances between the air-water and sediment-water interface (p = 0.39).
Hotspots
Rank abundance graphs of the vertical profiles revealed hotspots within all the prokaryotic and VLP subpopulations at the air- and sediment-water interface. In 19 of 24 samples the back-ground values followed a single linear trend whilst the remainder followed two or three linear trends. Background values followed a linear trend with slopes ranging from -2 x 10⁵and -5 x 10⁶, whilst the hotspot values followed a power law trend with exponents ranging from -0.26 to -1.43 (Fig 2A–2D).
Fig 1. Representative flow cytometric cytogram and histogram.(A) Cytogram of SYBR green fluorescence versus side scatter and (B) histogram of SYBR green fluorescence showing two VLP (VLP 1 and VLP 2) and two prokaryotic (LDNA and HDNA) subpopulations.
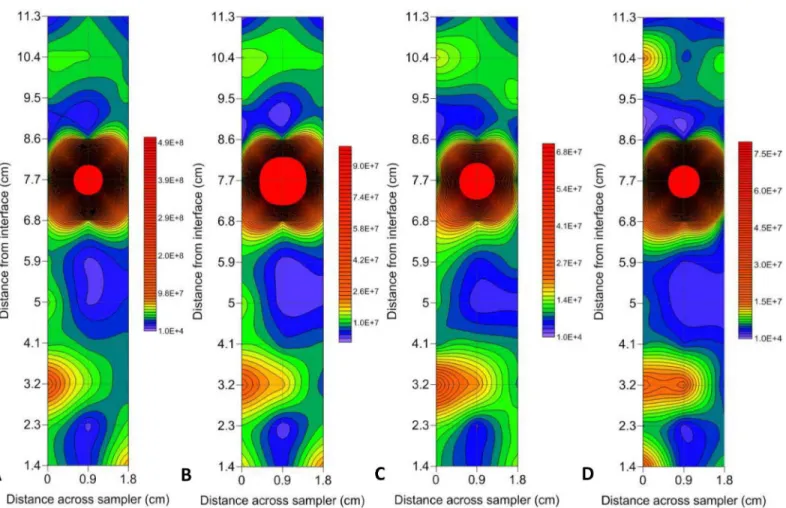
In all instances, the maximum abundance hotspots were present at the sediment-water interface, and when analysing the total 1.8 cm x 11.3 cm sampling area, VLP 1 had a maximum hotspot of 8.5 x 10⁸particles ml-1with a background of 3.6 x 10⁷particles ml-1, resulting in a 24 fold increase in heterogeneity (Fig 3A). Whereas VLP 2 had a lower maximum hotspot value of 2.6 x 10⁸particles ml-1but over a background of 1 x 10⁷particles ml-1resulting in a 26 fold change in heterogeneity, which was higher than VLP 1 (Fig 3B).
As the prokaryotic abundances were lower than the VLP abundances, the maximum abun-dance hotspots found in LDNA and HDNA were lower than VLP 1 and VLP 2. LDNA had a maximum abundance hotspot of 1.3 x 10⁸cells ml-1over a background of 9 x 10⁶cells ml-1, resulting in a 15 fold change in heterogeneity over the 1.8 x 11.3 cm sampling area (Fig 3C). HDNA had similar values, with a maximum abundance hotspot of 1.4 x 10⁸cells ml-1but over a background of 4.6 x 10⁶cells ml-1resulting in a 31 fold difference in heterogeneity which was Fig 2. Representative rank abundance graphs for hotspot determination. Background values followed a linear trend, whilst hotspots exhibited a power law trend.(A) VLP 2 at air-water interface. (B) VLP 1 at air-water interface. (C) HDNA at sediment-water interface. (D) LDNA at air-water interface.
higher than LDNA and was the largest change in heterogeneity in all of the subpopulations (Fig 3D).
However, these maximum abundance hotspot values were not the cause for the largest changes in heterogeneity. The largest fold changes were from one sample point to the next, over a distance of 0.9 cm, rather than across the entire sampling area. This was due to the occurrence of single point hotspots adjacent to low abundance values. VLP 1 showed a maxi-mum 74 fold change in heterogeneity over 0.9 cm, whilst VLP 2 had the highest change in het-erogeneity showing a maximum 107 fold change over 0.9 cm (Fig 3A and 3B). For the
prokaryotic subpopulations, LDNA had a maximum 41.5 fold change over 0.9 cm, whilst HDNA showed a maximum 80.5 fold change over 0.9 cm (Fig 3C and 3D).
Subpopulation correlations
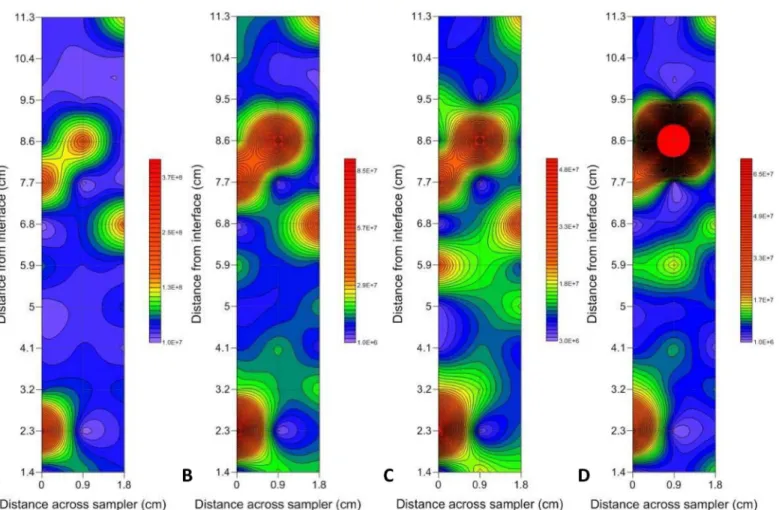
Two-dimensional contour plots revealed that the prokaryotic and VLP subpopulations were correlated overall, but that there were locational differences caused by the presence or absence of hotspots in prokaryotic and VLP abundance (Fig 4).
To identify potential relationships between plankton populations, Pearson correlation coef-ficients were run for each subpopulation pair at the air-water interface and sediment-water Fig 3. Contour plots showing hotspots in prokaryotic and VLP subpopulations at the sediment-water interface.(A) VLP 1 (B) VLP 2 (C) LDNA (D) HDNA. Abundance levels indicated via a colour intensity scale in units of cells/particles ml-1. Faint gridlines indicate sample intervals. A minimum contour interval value of 10000 was chosen as this was larger than the maximum flow cytometer machine error observed in blank control samples. Solid red areas indicate abundance points higher than the maximum contour level selected.
interface. From the 108 possible single vertical profile subpopulation correlations between VLP 1, VLP 2, LDNA and HDNA, 92 were significantly correlated with an r value0.79
(p0.003, n = 108) (Fig 5A and 5B). Of these correlated profiles, all of VLP 1 and VLP 2, 16/ 18 of the VLP 1 and LDNA and VLP 2 and LDNA, 15/18 of the VLP 2 and HDNA, 14/18 of the LDNA and HDNA and 13/18 of the VLP 1 and HDNA subpopulation profiles were corre-lated (S4 Table).
Spatial Autocorrelation
Moran’s I and Geary’s C. Significant spatial autocorrelation values were seen in 29% of the prokaryotic and VLP subpopulations. Significant Moran’s I values were present in VLP 1 and VLP 2 at 1 out of 3 of the sediment-water interface environments. The range of Moran’s I values for the VLP subpopulations was -0.07 to 0.05 with significance being seen at I values of 0.05. All prokaryotic subpopulations had non-significant Moran’s I values with the range of I values being -0.02 to 0.07 (S5andS6Tables).
Significant Geary’s C values were seen in all subpopulations at 1 out of 3 of the sediment-water interface environments, as well as HDNA at 1 out of 3 of the air-sediment-water interface environ-ments, whilst their corresponding Moran’s I values were non-significant. The range of Geary’s Fig 4. Representative two-dimensional contour plots showing the presence vs. absence of hotspots in prokaryotic and VLP abundance.(A) VLP 1, (B) VLP 2, (C) LDNA and (D) HDNA at the air-water interface. Abundance levels indicated via a colour intensity scale in units of cells/particles ml-1. Faint gridlines indicate sample intervals. A minimum contour interval value of 10000 was chosen as this was larger than the maximum flow cytometer machine error observed in blank control samples. Solid red areas indicate abundance points higher than the maximum contour level selected.
C values for the prokaryotic subpopulations was 0.97 to 1.16 with significance seen at C values of1.13, whilst the range of Geary’s C values for the VLP subpopulations was 0.95 to 1.17 with significance seen at C values of1.16 (S5andS6Tables).
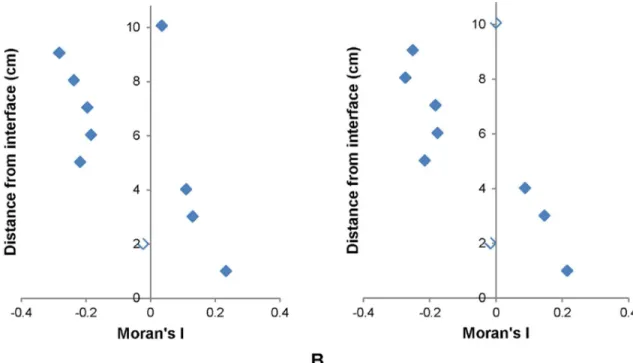
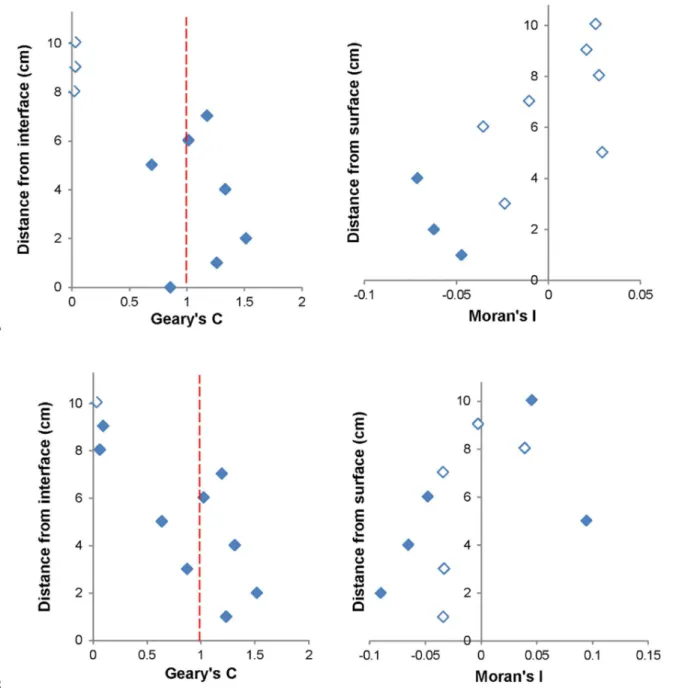
Moran and Geary Correlograms. Significant Moran correlograms were only found for VLP subpopulations at 1 out of 3 of the sediment-water interface environments (Fig 6A and 6B). Significant Geary correlograms were seen in all subpopulations for 1 out of 3 of the sedi-ment-water interface environments, as well as HDNA at 1 out of 3 air-water interface environ-ments, whilst their corresponding Moran correlograms were non-significant (Fig 7A and 7B). Moran correlograms showed a general trend of positive to negative spatial association whilst Geary correlograms showed alternation between positive and negative spatial autocorrelation with no clear pattern amongst all significant correlograms (Figs6and7).
Fig 5. Single vertical profiles showing correlations between VLP and prokaryotic subpopulations.(A) VLP 1 and VLP 2, (B) VLP 1 and LDNA at the sediment-water interface (r = 0.99, p<0.0001); and (C) VLP 2 and HDNA 1, (D) LDNA and HDNA 1 at the air-water interface (r0.97, p<0.0001). Error bars represent 95% confidence intervals.
Discussion
Microscale Microbial Patchiness
It is now acknowledged, at least for marine systems, that important microbial processes occur at scales of micrometres to centimetres. Here we tested the hypothesis that microscale micro-bial communities within freshwater systems exhibit similar patchy abundance distributions as previously observed in marine systems [2,9,16,17,23,25,74,75]. Our findings showed varia-tions in abundance of 107 and 80.5 fold over 0.9 cm in VLP and prokaryotic subpopulavaria-tions, indicating heterogeneity consistent with marine systems where it is attributed to mixing and aggregation. However, the magnitude of the gradients was higher than the previously observed maxima of 45 fold variation over 0.9 cm reported for bacterioplankton in marine systems [17]. This potentially indicates that microscale patchiness within interface microenvironments may be higher in freshwater rather than marine systems and that microscale heterogeneity exists at scales that directly impact microbial interactions.
However, as flow and shear patterns are often unique within fluvial systems, the microbial patchiness observed may not be the same or similar between other freshwater systems. For instance, less mixing in lakes compared to flowing waters could potentially result in different levels of microscale patchiness, perhaps due to lake snow or more stable phytoplankton cell dis-tributions. Also, as aggregates in riverine systems are smaller in size than those observed in lakes and marine environments, due to their exposure to contact shear force, this could impact on the level of heterogeneity observed in microbial communities [29–37]. Hydrological and seasonal patterns, such as algal blooms, leaf fall or terrestrial material inflow during flood events, will also impact microbial patchiness due to their observed effects on particle-attached microbial communities [29,32].
Previously, studies of microbial distributions in freshwater systems often relied on bulk phase, large scale sampling where individual samples were separated by metre to kilometre scales [18–22]. This sampling approach misses the important ecological associations that occur Fig 6. Significant Moran correlograms.(A) VLP 1 and (B) VLP 2 at the sediment-water interface. Unfilled data points indicate non-significance.
between individual microbial populations at micrometre to centimetre scales. In this study, the vast differences in microbial biomass from one sample point to the next would have been missed had bulk phase sampling been employed, hence influencing estimates in carbon flow. In addition, the results provide further evidence that nutrient exchanges may happen rapidly over very short distances [1,25]. Here, the ability to collect two-dimensional profiles at a high resolution has allowed discrimination between single point hotspots and adjacent low back-ground values (Fig 3). These single point hotspots and adjacent low backback-ground values were responsible for the large fold changes in this study, and show the utility of this two-dimensional Fig 7. Significant Geary correlograms and corresponding non-significant Moran correlograms.(A) VLP 1 and (B) LDNA at the sediment-water interface. Unfilled data points indicate non-significance. Dashed red lines in Geary correlograms indicate point of spatial independence, with values above indicating negative spatial autocorrelation and values below indicating positive spatial autocorrelation.
sampling technique to provide enhanced scale resolution, as seen previously in marine systems [17]. Our results suggest that where accurate abundance estimates are needed, large scale sam-pling may improve accuracy by including a few high resolution samples.
The steep adjacent gradients from one sample point to the next in this study illustrate the presence of microscale heterogeneity primarily due to the presence of hotspots. Hotspots in the microscale distributions of prokaryotes and VLPs are well accepted in marine systems, having been found in coral reefs [74], estuaries [16,17,23] seawater aquarium [25], eutrophic coastal waters [2,13,16,23,75] and oligotrophic open ocean systems [16].
The hotspots observed may indicate microbial interactions with suspended particulate mat-ter. For instance, river snow particles can contain high microbial abundances, with these abun-dances often exceeding the abundance in the water column [33]. These particle associated microbial hotspots can contribute to a significant amount of production and activity [35–38]. Viral attachment to particulate matter can lead to viral abundance hotspots due to prolonged survival or increased phage production and transduction [29,39–42]. This increased viral pro-duction on particles can also result in viral abundance hotspots within the free-living portion of the water column [29].
Nutrient patches may also explain the hotspots in freshwater prokaryote and VLP popula-tions. Nutrient patches are small, being micrometres to centimetres in size and often short-lived, lasting seconds to minutes. These are generated by events such as algal lysis and the sink-ing of organic particles [25,26,48,51]. As the sampling resolution was larger than the Batche-lor scale, chemical gradients could exist from one sample point to the next. These chemical gradients and nutrient patches attract chemotactic bacteria which form clusters around the high nutrient areas [26,76]. The bacterial accumulation favours viral infection due to high host density allowing viruses to infect multiple bacteria [25,48]. The abundance patterns that were observed suggested that bacteria had chemotactically responded to nutrient patches, leading to high bacterial abundance at some locations, followed by viral lysis of some of these bacterial species, and hence associated high viral abundance.
VLP and Prokaryote Subpopulations
The VLP 1 subpopulation was the most abundant which is consistent with previous studies [77,78] (Fig 1). Previous studies have also shown VLP 1 to contain bacteriophage [58,79,80]. However, recent work could not rule out the presence of algal and cyanobacterial viruses in the VLP 1 region [81] and additionally identified active lytic bacteriophage, specifically myo-viruses, within VLP 2 FCM signatures [82].
VLP to Prokaryote Ratio
The mean VPR found in this study was much lower than previous freshwater studies, with the most similar system being a eutrophic subtropical Australian river, which had a minimum VPR of 3.0 [22,83]. However, this minimum VPR was seen during the summer, which is in contrast to this study which sampled during winter. As higher VPRs are typically seen in pro-ductive environments, which are suggested to be due to higher nutrient levels favouring maxi-mum prokaryotic growth and productivity rates, the low VPRs obtained in this study may indicate a less productive system [65,83–85]. The results confirm the mechanisms for large scale viral and bacterial interactions.
VLP and Prokaryote Relationships
prokaryotic and VLP communities (Fig 5). Previous studies have shown positive interdepen-dence between VLP abundance and prokaryotic numbers [86] and subpopulation correlations in marine systems for VLP 1 and LDNA and VLP 2 and HDNA leading to the belief VLP pop-ulations are the phage of the prokaryotic poppop-ulations [3,15,25,87]. The correlations indicate mutual succession of VLPs and prokaryotes, where cell growth is in equilibrium with cell lysis.
The strong correlations may be due to pre-lytic events where bacterial numbers are high and viral numbers are high as was seen in the abundance values [16,88]. Also, as sampling occurred in winter when nutrient concentrations are minimal and bacterial productivity is at its lowest, lysis would be low and lysogenic viral activity would dominate, causing bacterial and viral numbers to remain relatively constant [78,89]. Correlations may also represent phyto-plankton bloom demise, where bacterial numbers and productivity are high leading to high viral numbers that can last for days to weeks [66,90–92]. In addition, correlations could indi-cate nutrient patches attracting bacteria and consequently viruses to high host density areas [76].
Microscale prokaryote and VLP distributions showed different hotspot and coldspot pat-terns. The two-dimensional contour plots at the air-water interface showed prokaryote hot-spots but the absence of VLP hothot-spots 6 cm from the interface surface (Fig 4). This indicates dynamic differences between prokaryotes and VLPs, perhaps representative of bacterial accu-mulation around a nutrient source prior to viral attack, or a suspended biofilm particle that is impenetrable to viruses.
Spatial Autocorrelation within Microbial Subpopulations
Spatial autocorrelation analysis revealed 29% of the prokaryotic and VLP subpopulations were non-randomly distributed at 0.9 cm distances on the local and global scale. Previously signifi-cant Moran’s I values have been observed in marine bacterioplankton, however not for VLP subpopulations [17]. As significant Moran’s I values were positive and significant Geary’s C values were>1, this indicates positive and negative spatial autocorrelation and hence regions
of clustering and dispersion, which were present as hotspots and coldspots in two-dimensional abundance distributions [72]. Hotspots may indicate nutrient patches and subsequent bacterial accumulation and viral lysis, whilst coldspots could indicate low nutrient concentration regions where bacterial abundance and productivity is low and lysogeny is favoured [1,48,68,93–95].
Skewing was present in the results, with non-significant Moran’s I values but significant Geary’s C values found for VLP 1, VLP 2, LDNA and HDNA at 1 out of the 3 sediment-water interface environments and HDNA at 1 out of the 3 air-water interface environments (Fig 7). This indicates, although these subpopulations were spatially dependent on the global scale, on the local scale they showed negative spatial autocorrelation areas [69]. This skewing was due to extreme outlier values, i.e. hotspots, which were almost an order of magnitude higher than the rest of the dataset therefore indicates the importance of using Geary’s C in conjunction with Moran’s I.
Conclusion
Here we report microscale patchiness in freshwater microbial communities with abundance variations of 107 and 80.5 fold over 0.9 cm for VLP and prokaryotic subpopulations. This indi-cates that within freshwater ecosystems microbial interactions are likely to differ markedly at the microscale. The pattern of variation is consistent with observations in marine systems for variation caused by mixing and aggregation and therefore suggests, as with marine systems, that bulk phase sampling will not provide accurate representation of the dynamics of microbial processes within freshwater systems.
Spatial autocorrelation analysis showed VLP and prokaryotic subpopulation distributions were non-random and spatially dependent due to heterogeneous hotspots and coldspots. This indicates that the dissipation rates within slow flowing river systems allow nutrient patch for-mation with lifetimes that exceed bacterial chemotaxis rates.
Supporting Information
S1 Table. Mean abundances of VLP subpopulations.
(DOCX)
S2 Table. Mean abundances of prokaryotic subpopulations.
(DOCX)
S3 Table. VLP to prokaryote ratio of the mean abundances.
(DOCX)
S4 Table. Corresponding r and p values for correlated prokaryotic and VLP subpopulation profiles.
(DOCX)
S5 Table. Moran’s I and Geary’s C values for prokaryotic subpopulations.
(DOCX)
S6 Table. Moran’s I and Geary’s C values for VLP subpopulations.
(DOCX)
Acknowledgments
We thank Dr C. MacArdle and S. Bailey of the Flow Cytometry Unit of the Flinders Medical Centre, South Australia.
Author Contributions
Conceived and designed the experiments: LMD JGM RO. Performed the experiments: LMD JSP. Analyzed the data: LMD JGM RO. Contributed reagents/materials/analysis tools: KN JSP. Wrote the paper: LMD JGM RO KN JSP.
References
1. Azam F Microbial control of oceanic carbon flux: the plot thickens. Science 1998; 280: 694–696
2. Long RA & Azam F Microscale patchiness of bacterioplankton assemblage richness in seawater. Aquatic Microbial Ecology2001; 26: 103–113
4. Newton RJ, Jones SE, Eiler A, McMahon KD & Bertilsson S A guide to natural history of freshwater lake bacteria. Microbiology and Molecular Biology Reviews 2011; 75 (1): 14–49 doi:10.1128/MMBR. 00028-10PMID:21372319
5. Suttle CA Viruses in the sea. Nature 2005; 437: 356–361 PMID:16163346
6. Wilhelm SW & Matteson AR Freshwater and marine virioplankton: a brief overview of commonalities and differences. Freshwater Biology 2008; 53: 1076–1089
7. Wommack KE & Colwell RR Virioplankton: Viruses in aquatic ecosystems. Microbiology and Molecular Biology Reviews 2000; 64: 69–114 PMID:10704475
8. Brooks TM, Mittermeier RA, Mittermeier CG, Da Fonseca GAB, Rylands AB, Konstant WR, Flick P, Pil-grim J, Oldfield S, Magin G & Hilton-Taylor C Habitat loss and extinction in hotspots of biodiversity. Con-servation Biology 2002; 16 (4): 909–923
9. Margules CR & Pressey RL Systematic conservation planning. Nature 2000; 405: 243–253 PMID: 10821285
10. Mittermeier RA, Myers N, Thomsen JB, Da Fonseca GAB & Olivieri S Biodiversity hotspots and major tropical wilderness areas: approaches to setting conservation priorities 1998; 12 (3): 516–520
11. Myers N, Mittemeier RA, Mittermeier CG, Da Fonseca GAB & Kent J Biodiversity hotspots for conserva-tion priorities Nature 2000; 430: 853–858
12. Duarte CM & Vaqué D Scale dependence of bacterioplankton patchiness. Marine Ecology Progress Series 1992; 84 (1): 95–100
13. Mitchell JG & Fuhrman JA Centimetre scale vertical heterogeneity in bacteria and chlorophyll a. Marine Ecology Progress Series 1989; 54: 141–148
14. Seymour JR, Mitchell JG & Seuront L Microscale heterogeneity in the activity of coastal bacterioplank-ton communities. Aquatic Microbial Ecology 2004; 35: 1–16
15. Seymour JR, Seuront L & Mitchell JG Microscale and small-scale temporal dynamics of a coastal planktonic microbial community. Marine Ecology Progress Series 2005a; 300: 21–37
16. Seymour JR, Seuront L, Doubell M, Waters RL & Mitchell JG Microscale patchiness of virioplankton. Journal of the Marine Biological Association of the United Kingdom 2006; 86: 551–561
17. Dann LM, Mitchell JG, Speck PG, Newton K, Jeffries T & Paterson J Virio- and bacterioplankton micro-scale distributions at the sediment-water interface. PLoS One 2014; 9 (7): 1–14
18. Jezbera J, Jezberová J, Koll U, Horňák K,Šimek K & Hahn MW Contrasting trends in distribution of four major planktonic betaproteobacterial groups along a pH gradient of epilimnia of 72 freshwater habitats. FEMS Microbiology Ecology 2012; 81: 467–479 doi:10.1111/j.1574-6941.2012.01372.xPMID: 22452571
19. Lear G, Bellamy J, Case BS, Lee JE & Buckley HL Fine-scale spatial patterns in bacterial community composition and function within freshwater ponds. The ISME Journal 2014; 8: 1715–1726 doi:10. 1038/ismej.2014.21PMID:24577354
20. Liu Z, Huang S, Sun G, Xu Z & Xu M Phylogenetic diversity, composition and distribution of bacterio-plankton community in the Dongjiang River, China. FEMS Microbiology Ecology 2011; 80: 30–44
21. Palijan G Abundance and biomass responses of microbial food web components to hydrology and environmental gradients within a floodplain of the River Danube. Microbial Ecology 2012; 64: 39–53 doi:10.1007/s00248-012-0016-zPMID:22327270
22. Pollard PC & Ducklow H Ultrahigh bacterial production in a eutrophic subtropical Australian river: Does viral lysis short-circuit the microbial loop? Limnol. Oceanogr. 2011; 56 (3): 1115–1129
23. Seymour JR, Mitchell JG, Pearson L, Waters R Heterogeneity in bacterioplankton abundance from 4.5 millimetre resolution sampling. Aquatic Microbial Ecology 2000; 22: 143–153.
24. Barbara G & Mitchell JG Marine bacterial organisation around point-like sources of amino acids FEMS Microbiology Ecology 2003; 43: 99–109. doi:10.1111/j.1574-6941.2003.tb01049.xPMID:19719700
25. Blackburn N, Fenchel T & Mitchell JG Microscale nutrient patches in planktonic habitats shown by che-motactic bacteria. Science 1998; 282: 2254–2256 PMID:9856947
26. Stocker R & Seymour JR (2012) Ecology and physics of bacterial chemotaxis in the ocean. Microbiol-ogy and Molecular BiolMicrobiol-ogy Reviews 76: 792–812 doi:10.1128/MMBR.00029-12PMID:23204367
27. Peduzzi P Virus ecology of fluvial systems: a blank spot on the map? Biology Reviews 2015; doi:10. 1111/brv.12202
29. Luef B, Neu TR, Zweimüller I & Peduzzi P Structure and composition of aggregates in two large Euro-pean rivers, based on confocal laser scanning microscopy and image and statistical analyses. Applied and Environmental Microbiology 2009; 75 (18): 5952–5962 doi:10.1128/AEM.00186-09PMID: 19633114
30. Simon N, Grossart HP, Schweitzer B & Ploug H Microbial ecology of organic aggregates in aquatic eco-systems. Aquatic Microbial Ecology 2002; 28: 175–211
31. Zimmermann-Timm H Characteristics, dynamics and importance of aggregates in rivers–an invited review. International Review of Hydrobiology 2002; 87: 197–240
32. Besemer K, Moeseneder MM, Arrieta JM, Herndl GJ & Peduzzi P Complexity of bacterial communities in a river-floodplain system (Danube, Austria). Applied and Environmental Microbiology 2005; 71 (2): 609–620 PMID:15691909
33. Luef B, Aspetsberger F, Hein T, Huber F & Peduzzi P Impact of hydrology on free-living and particle-associated microorganisms in a river floodplain system (Danube, Austria). Freshwater Biology 2007; 52: 1043–1057
34. Peduzzi P & Luef B Viruses, bacteria and suspended particles in a backwater and main channel site of the Danube (Austria). Aquatic Sciences 2008; 70 (2): 186–194 PMID:21151810
35. Griffith PC, Douglas DJ & Wainright SC Metabolic activity of size-fractionated microbial plankton in estuarine, nearshore, and continental shelf waters of Georgia. Marine Ecology Progress Series 1990; 108: 1–10
36. Grossart HP & Simon M Limnetic macroscopic organic aggregates (lake snow): occurrence, character-istics, and microbial dynamics in Lake Constance. Limnology and Oceanography 1993; 38: 532–546
37. Grossart HP & Simon M Bacterial colonisation and microbial decomposition of limnetic organic aggre-gates (lake snow). Aquatic Microbial Ecology 1998; 15: 127–140
38. Iriberri J, Unanue M, Barcina I & Egia L Seasonal variation in population density and heterotrophic activ-ity of attached and free living bacteria in coastal waters. Applied and Environmental Microbiology 1987; 53: 2308–2314 PMID:16347451
39. Kapuscinski RB & Mitchell R Processes controlling virus inactivation in coastal waters. Water Research 1980; 14: 363–371
40. Kokjohn TA, Sayler GS & Miller RV Attachment and replication ofPseudomonas aeruginosa bacterio-phages under conditions stimulating aquatic environments. General Microbiology 1991; 137: 661–666
41. Ripp S & Miller RV Effects of suspended particulates on the frequency of transduction among Pseudo-monas aeruginosain a freshwater environment. Applied and Environmental Microbiology 1995; 61: 1214–1219 PMID:16534986
42. Suttle CA & Chen F Mechanisms and rates of decay of marine viruses in seawater. Applied and Envi-ronmental Microbiology 1992; 58: 3721–3729 PMID:16348812
43. Abraham ER The generation of plankton patchiness by turbulent stirring. Nature 1998; 391: 577–580
44. Siegel DA Resource competition in a discrete environment: Why are plankton distributions paradoxi-cal? Limnology and Oceanography 1998; 43 (6): 1133–1146
45. Young WR, Roberts AJ & Stuhne G Reproductive pair correlations and the clustering of organisms. Nature 2001; 412: 328–331 PMID:11460162
46. Kolmogorov AN (1991) Dissipation of energy in the locally isotropic turbulence. Proceedings: Mathe-matical and Physical Sciences 434: 15–17
47. Hondzo M & Lyn D (1999) Quantified small-scale turbulence inhibits the growth of a green alga. Fresh-water Biology 41: 51–61
48. Taylor JR & Stocker R (2012) Trade-offs of chemotactic foraging in turbulent waters. Science 338: 675–679 doi:10.1126/science.1219417PMID:23118190
49. Durham WM & Stocker R (2012) Thin phytoplankton layers: Characteristics, mechanisms, and conse-quences. Annu, Rev. Mar. Sci. 4: 177–207
50. Durham WM, Kessler JO & Stocker R (2009) Disruption of vertical motility by shear triggers formation of thin phytoplankton layers. Science 323: 1067–1070 doi:10.1126/science.1167334PMID:19229037
51. Mitchell JG, Okubo A & Fuhrman JA (1985) Microzones surrounding phytoplankton form the basis for a stratified marine microbial ecosystem. Nature 316: 58–59
52. Mitchell JG, Yamazaki H, Seuront L, Wolk F & Li H (2008) Phytoplankton patch patterns: Seascape anatomy in a turbulent ocean. Journal Of Marine Systems 69 (3–4): 247–253
54. Brussaard C (2004) Optimisation of Procedures for Counting Viruses by Flow Cytometry Applied and Environmental Microbiology 70: 1506–1513 PMID:15006772
55. Paterson JS, Nayar S, Mitchell JG & Seuront L (2012) A local upwelling controls viral and microbial community structure in South Australian continental shelf waters. Estuarine, Coastal and Shelf Science 96: 197–208
56. Roudnew B, Seymour JR, Jeffries TC, Lavery TJ, Smith RS & Mitchell JG (2012) Bacterial and virus-like particle abundances in purged and unpurged groundwater depth profiles. Groundwater Monitoring and Remediation 32 (4): 72–77
57. Roudnew B, Lavery TJ, Seymour JR, Jeffries TC & Mitchell JG (2014) Variability in bacteria and virus-like particle abundances during purging of unconfined aquifers. Groundwater 52 (1): 118–124
58. Marie D, Brussaard C, Thyrhaug R, Bratbak G & Vauolt D (1999) Enumeration of Marine Viruses in Cul-ture and Natural Samples by Flow Cytometry. Applied and Environmental Microbiology 65: 45–52 PMID:9872758
59. Schapira M, Buscot MJ, Leterme SC, Pollet T, Chapperon C & Seuront L Distribution of heterotrophic bacteria and virus-like particles along a salinity gradient in a hypersaline coastal lagoon. Aquatic Micro-bial Ecology 2009; 54: 171–183
60. Gasol JM & Del Giorgio PA Using flow cytometry for counting natural planktonic bacteria and under-standing the structure of planktonic bacterial communities. Scientia Marina 2000; 64: 197–224
61. Smith RJ, Paterson JS, Sibley CA, Hutson JL & Mitchell JG Putative effect of aquifer recharge on the abundance and taxonomic composition of endemic microbial communities. PLoS One 2015. doi:10. 1371/journal.pone.0129004
62. Marie D, Partensky F, Jacquet S & Vaulot D Enumeration and Cell Cycle Analysis of Natural Popula-tions of Marine Picoplankton by Flow Cytometry Using the Nucleic Acid Stain SYBR Green I. Applied and Environmental Microbiology 1997; 63: 186–193 PMID:16535483
63. Wiebe PH Small-scale spatial distribution in oceanic zooplankton. American Society of Limnology and Oceanography 1970; 15: 205–217.
64. Holm S A simple sequentially rejective multiple test procedure. Scandinavian Journal of Statistics 1979; 6: 65–70
65. Jacquet S, Miki T, Noble R, Peduzzi P & Wilhelm S Viruses in aquatic ecosystems: important advance-ments of the last 20 years and prospects for the future in the field of microbial oceanography and limnol-ogy. Advances in Oceanography and Limnology 2010; 1: 97–141
66. Weinbauer MG Ecology of prokaryotic viruses. FEMS Microbiology Reviews 2004; 28: 127–181 PMID: 15109783
67. Smith SC & Bruce CW CrimeStat1III User Workbook, The National Institute of Justice. 2008.
Avail-able:http://www.icpsr.umich.edu/CrimeStat/workbook/CrimeStat_Workbook.pdf
68. Waters RL, Mitchell JG & Seymour JR Geostatistical characterisation of centimetre-scale spatial struc-ture ofin vivofluorescence. Marine Ecology Progress Series 2003; 251: 49–58
69. Sokal RR & Oden NL Spatial autocorrelation in biology: 1. Methodology. Biological Journal of the Lin-nean Society 1978; 10: 199–228
70. Peakall R, Ruibal M & Lindenmayer DB Spatial autocorrelation analysis offers new insights into gene flow in the Australian bush rat, Rattus fuscipes. Evolution 2003; 57: 1182–1195 PMID:12836834
71. Geary RC The contiguity ratio and statistical mapping. The Incorporated Statistician 1954; 5: 115–145
72. Moran PAP Notes on continuous stochastic phenomena. Biometrika 1950; 37: 17–23 PMID: 15420245
73. Griffith DA Spatial autocorrelation: a primer. Resource publications in Geography. Association of Amer-ican Geographers, Washington, D.C; 1987.
74. Seymour JR, Patten N, Bourne DG & Mitchell JG Spatial dynamics of virus-like particles and heterotro-phic bacteria within a shallow coral reef. Marine Ecology Progress Series 2005b; 288: 1–8
75. Seymour JR, Seuront L, Doubell M, Mitchell JG Mesoscale and microscale spatial variability of bacteria and viruses during a Phaeocystisglobosa bloom. Eastern English Channel. Estuarine, Coastal and Shelf Science 2008; 80: 589–597.
76. Stocker R Marine microbes see a sea of gradients. Science 2012; 338: 628–633 doi:10.1126/science. 1208929PMID:23118182
78. Thomas R, Berdjeb L, Sime-Ngando T & Jacquet S Viral abundance, production, decay rates and life strategies (lysogeny versus lysis) in Lake Bourget (France). Environmental Microbiology 2011; 13: 616–630 doi:10.1111/j.1462-2920.2010.02364.xPMID:21054737
79. Goddard VJ, Baker AC, Davy JE, Adams DG, De Ville MM, Thackeray SJ, et al. Temporal distribution of viruses, bacteria and phytoplankton throughout the water column in a freshwater hypereutrophic lake. Aquatic Microbial Ecology 2005; 39: 211–223
80. Payet JP & Suttle CA Physcial and biological correlates of virus dynamics in the southern Beaufort Sea and Amundsen Gulf. Journal of Marine Systems 2008; 74: 933–945
81. Parvathi A, Zhong X & Jacquet S Dynamics of various viral groups infecting autotrophic plankton in Lake Geneva. Advances in Oceanography and Limnology 2012; 3 (2): 171–191
82. Zhong X, Pradeep Ram AS, Colombet J & Jacquet S Variations in abundance, genome size, morphol-ogy, and functional role of the virioplankton in lakes Annecy and Bourget over a 1-year period. Microbial Ecology 2014; 67 (1): 66–82 doi:10.1007/s00248-013-0320-2PMID:24253662
83. Jacquet S, Domaizon I, Personnic S, Ram ASP, Hedal M, Duhamel S et al. Estimates of protozoan-and viral-mediated mortality of bacterioplankton in Lake Bourget (France). Freshwater Biology 2005; 50: 627–645
84. Maranger R & Bird DF Viral abundance in aquatic systems–a comparison between marine and fresh-waters. Marine Ecology Progress Series 1995; 121: 217–226
85. Meyer KA, O’Neil JM, Hitchcock GL & Heil CA Microbial production along the West Florida Shelf: Responses of bacteria and viruses to the presence and phase ofKarenia brevisblooms. Harmful Algae 2014. doi:10.1016/j.hal.2014.04.015
86. Peduzzi P & Schiemer F (2004) Bacteria and viruses in the water column of tropical freshwater reser-voirs Environmental Microbiology 6(7): 707–715 PMID:15186349
87. Cochlan WP, Wikner J, Steward GF, Smith DC & Azam F Spatial distribution of viruses, bacteria and chlorophyllain neritic, oceanic and estuarine environments. Marine Ecology Progress Series 1993; 92: 77–87
88. Breitbart M Marine viruses: truth or dare. Annu. Rev. Mar. Sci. 2012; 4: 425–448
89. Ortmann AC, Lawrence JE & Suttle CA Lysogeny and lytic viral production during a bloom of cyanobac-teriumSynechococcusspp. Microbial Ecology 2002; 43: 225–231 PMID:12023729
90. Hennes KP & Simon M Significance of bacteriophage for controlling bacterioplankton growth in a meso-trophic lake. Applied and Environmental Microbiology 1995; 61: 333–340 PMID:16534914
91. Larsen A, Fonnes Flaten GA, Sandaa RA, Castberg T, Thyrhaug R, Erga SR, et al. Spring phytoplank-ton bloom dynamics in Norwegian coastal waters: Microbial community succession and diversity. Lim-nology and Oceanography 2004; 49: 180–190
92. Yager P, Connelly T, Mortazavi B, Wommack K, Bano N, Bauer J, et al. Dynamic bacterial and viral response to an algal bloom at subzero temperatures. Limnology and Oceanography 2001; 46: 790– 801
93. Patten NL, Seymour JR & Mitchell JG Flow cytometric analysis of virus-like particles and heterotrophic bacteria within coral-associated reef water. Journal of the Marine Biological Association of the United Kingdom 2006; 86: 563–566
94. Seymour JR, Ahmed T, Durham WM, Stocker R Chemotactic response of marine bacteria to the extra-cellular products of Synechococcus and Prochlorococcus. Aquatic Microbial Ecology 2010; 59: 161– 168. doi:10.3354/ame01400