RESEARCH ARTICLE
A microarray study of altered gene expression during
melanoblasts migration in normal pigmented White Leghorn
and hyperpigmented mutant Silky Fowl
Yulin LI1*, Deping HAN1*, Junying LI1, Dawn KOLTES2, Xuemei DENG (
✉
)11 Key Laboratory of Animal Genetics and Breeding of the Ministry of Agriculture, College of Animal Science and Technology, China Agricultural University, Beijing 100193, China
2 Iowa State University, Ames, IA 50011, USA
Abstract Melanoblasts originating from neural crest cells can migrate through the mesenchyme of the developed embryo and give rise to melanocytes. Unlike the melanocytes that are confined to the integument in other vertebrates, melanocytes in Silky Fowl can reach the ventral regions of the embryos owing to differences in gene expression in the process of melanoblasts migration. In this study, we used microarray profiling to identify differences in gene expression between White Leghorn and Silky Fowl. Differential expression of 2517 microarray probes (P<0.01, Fold Change>2) was observed in Silky Fowl
compared to White Leghorn. After filtration by cluster analysis, functional annotation and pathway analysis, eight differentially expressed genes were identified to be closely related to the development of melanocytes. Moreover, differences in expression of immune genes were also detected between Silky Fowl and White Leghorn. The differentially expressed genes associated with melanocyte development were verified by q-PCR, and results were highly consistent with the microarray data. The genes with significantly altered expression involved in melanoblast migration and development suggested that different microenvironments resulted in the abnormal melanoblast migration in Silky Fowl, although there were no big differences in melanoblast development between these two breeds. The candidate genes discovered in this study are beneficial to understand the molecular mechanism of hyperpigmentation in Silky Fowl.
Keywords Silky Fowl, White Leghorn, melanoblast migration, gene expression
1
Introduction
As a population of cells derived from neural crest cells, melanoblasts can normally migrate through the mesench-yme giving rise to melanocytes which are mainly distributed in the epidermis, hair-follicle and optic dermis shielding the skin from sunburn and maintaining hair color. When they arrive at the space between the neural tube and somites at the thoracic level, the neural crest cells first begin to migrate, differentiating into neurons and glial cells [1]. Twenty four hours later, the neural crest cells begin to migrate through the neural tube to form melanocyte precursors or melanoblasts, and at stage 20, melanoblasts pause at the“staging area” [2,3]. Then the melanoblasts migrate to the dorsolateral space by the dorsolateral pathway under the complex regulation of developmental and migratory signals [4]. By stage 28, the distribution of melanoblasts in embryos resembles that in adults [5]. Recently, a few signal molecules that can enhance or constrain melanoblast migration have been identified [6– 10], but the molecular mechanisms responsible for the migration of melanoblasts requires further investigation.
Silky Fowl (SF) is famous in China for their special medical and health-promoting potentials, by virtue of the hyperpigmentation in their inner organs. As a natural mutant breed, SF shows extensive pigmentation, including periosteum, gonads, trachea, heart, liver, gizzard, cecum, perimysium and many other organs [11]. This rare and extensive hyperpigmentation in SF compared to the other higher vertebrates, provides us a very appropriate natural mutant model to investigate the mechanism of gene regulation during melanocyte development.
Previous studies have realized that the ectopic pattern of pigmentation in SF results from an abnormal migration of melanoblasts. Whereas in White Leghorn (WL) the melanoblast migration only takes the dorsolateral pathway between the ectoderm and somites, the melanoblasts in SF
Received November 30, 2014; accepted December 28, 2014 Correspondence: [email protected]
*These authors contributed equally to the work
can migrate ventrally between the neural tube and somites in addition to dorsolateral migration [12]. At stage 20, melanoblasts have invaded the dorsolateral pathway in both SF and WL. By stage 22, melanoblasts in SF begin to invade the ventral path, whereas the melanoblasts in WL will have migrated only half-way along the dorsolateral path. By stage 24, melanoblasts already occupy the ventral path in SF, but not in WL. From stage 26, melanoblasts are dramatically increased in ventromedial positions in SF [5]. The abnormal migration of melanoblasts in SF is substantially correlated with the absence of some environ-mental barrier molecules which prohibit melanoblasts migration and can be identified by peanut agglutinin [13]. Some studies have shown that hyperpigmentation is regulated by Id and Fm genes [14] and Edn3 plays the role ofFmin controlling the hyperpigmentation [15], but the precise mechanism of gene regulation of hyperpig-mentation in SF is still elusive.
In this study, global gene expression at the early embryo stages of the WL and SF were investigated using microarrays and the differentially expressed genes were identified. To the best of our knowledge, this is the first comparison of transcriptional expression during melano-blast development between WL and hyperpigmented SF. This report can help us to better understand the complex mechanism of melanoblast migration at the transcriptional level between these two chicken breeds.
2
Materials and methods
2.1 Ethics statement
Animal use and animal trials in this study have been approved by the Beijing Municipal Committee of Animal Management and the Ethics Committee of China Agri-cultural University.
2.2 Animals
The WL and SF eggs in this study were obtained from the chicken farm in China Agricultural University and incubated under humid conditions at 38°C. The embryos were collected and sampled at hatching day 3 (stage 20), day 3.5 (stage 22), day 4 (stage 24), and day 4.5 (stage 26). The body trunks from three embryos were sampled at the fore-limb bud and pooled together as a biological replicate. Three replicates were designed at each point. All samples were immersed in RNAfixer liquid (Tiangen Biotech Co., Ltd., China) and store at – 80°C.
2.3 RNA extraction
Total RNA from samples was isolated using Trizol according to the manufacturer’s protocol (Invitrogen, USA). The RNA was purified using the RNAeasy mini
kit (Qiagen, USA) and RNA quality and purity were determined by NanoDrop ND-1000 spectrophotometer at 260/280 nm (NanoDrop Technologies, USA). The integ-rity of total RNA was detected using Agilent BioAnalyzer 2100 (Agilent Technologies, USA). Only the RNA samples with RNA Integrity Number (RIN) above 7 were used for the subsequent experiments.
2.4 cRNA synthesis
Two micrograms of purified total RNA was transcribed into cDNA using the Low RNA Input Linear Amplication kit (Agilent Technologies, USA). Then cDNA was transcribed into cRNA (complementary Ribonucleic Acid, in vitro transcription product with cDNA as a template) which was labeled with Cy3 NHS ester (GE healthcare, USA) using T7 RNA polymerase (Agilent Technologies). The labeled probes were purified with RNAeasy mini kit (Qiagen, USA) and the quality and quantity were determined by NanoDrop ND-1000 spectro-photometer (NanoDrop Technologies, USA).
2.5 Microarray hybridization and data analysis
The Cy3 labeled RNA samples were hybridized with the 44K Agilent chicken genome oligo microarray in triplicate [16]. The microarrays were incubated at 65°C for 17 h in Agilent’s hybridization chambers and rotated at 10 revolutions per minute. After washing with Expression Wash Buffer Kit (Agilent Technologies, USA), all the microarrays were scanned at 5 µm resolution using an Agilent G2565BA Microarray Scanner System (Agilent Technologies, USA) with an extended dynamic range (PMT 10/100). The expression data from all arrays were normalized and filtered using GeneSpring 7.3 and the significant difference was analyzed at a cut-off with P value less than 0.01 and fold change greater than 2. Gene Ontology (GO) and pathway analysis of significantly differentially expressed genes were performed using SBC Analysis System (http://sas.ebioservice.com/). Results are marked as significantly different at theP<0.05 level.
2.6 Quantitative analysis
Six genes were quantified and verified by q-PCR using SYBR Green Real-time PCR Master Mix (Takara, Japan). 0.5 µg of total RNA was transcribed into cDNA with the PrimerScript RT reagent Kit (Takara, Japan) according to the manufacturer’s instruction. Primers were designed by primer express 2.0 (Applied Biosystems, USA) and synthesized (Invitrogen USA). The primer sequences and product sizes were listed in Table 1. The cycling parameters of quantitative PCR amplification were as follows: initial heat-denature at 95°C for 15 min, 33 cycles at 95°C for 20 s, 62°C for 20 s, and 72°C for 20 s, and
preformed to exclude genomic DNA contamination and confirm the primer specificities. GAPDH was used as house-keeping gene in this assay. Data were collected from three biological replicates, and each biological replicate had three technical replicates. Statistical significance was set atP<0.05.
3
Results
3.1 Differentially expressed genes in SF and WL
The genes differentially expressed between SF and WL at hatching day 3, 3.5, 4 and 4.5 were detected and analyzed. 1146, 951, 1089 and 974 up- and down-expressed genes
were found at each time point, respectively (Fig. 1).
3.2 Gene ontology and biological pathways annotation of differentially expressed genes
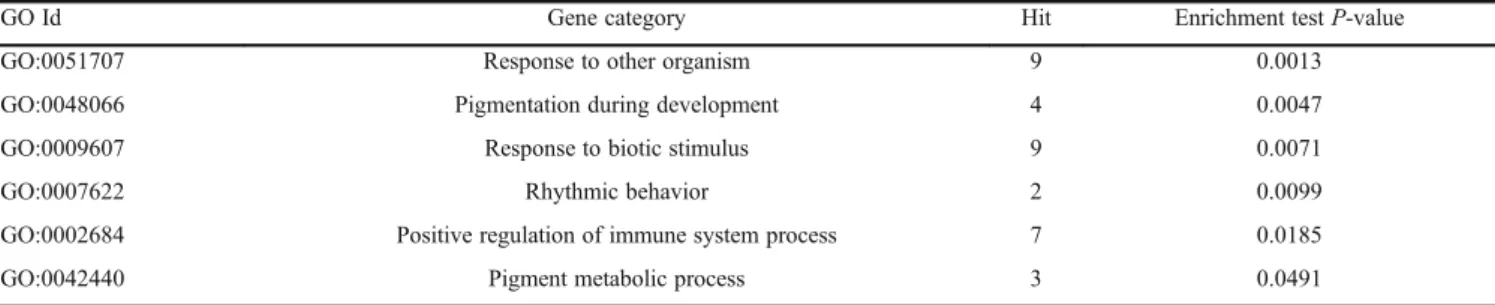
Differentially expressed genes between SF and WL were categorized by gene ontology and six over represented GO categories between SF and WL were identified (Table 2). The GO terms of pigmentation during development and pigment metabolic process are significantly enriched functional categories in our study, and are mainly associated with melanocyte development. In addition, GO terms of positive regulation of immune system process (P= 0.0185) and response to biotic stimulus (P= 0.0071) were found to be differentially regulated between the two
Table 1 Primer sequences used for quantitative real-time PCR
Gene Accession number Primer sequences 5′– 3′
GAPDH NM_204305 Upper: AAAGTCCAAGTGGTGGCCATC
Down: TTTCCCGTTCTCAGCCTTGAC
Edn3 AB235921 Upper: CAGCCTTCATTTCGGTGCTCT Down: TGCATCGGTCCTTCTCTGTTG
Ednrb2 NM_204120 Upper: TCCCCTTAGTATGCACTGGCA
Down: ACGCCGTTTCATGTGGTCA
Scf NM_205130 Upper: GCGCTGCCATTCCTTATGAAG Down: TGGATTCCCGCAGGAACTCT
Mc1r NM_001031462 Upper: TCCGCCACATGGACAATGT Down: GCAGCGCATAGAAGATGGTGA
Pomc NM_001031098 Upper: GAAAAGAAGGATGGAGGCTCG Down: CGATGGCGTTTTTGAACAGAG
Fig. 1 Numbers of differentially expressed genes between Silky Fowl and White Leghorn during critical times of melanocyte migration. Black bars: number of up-regulated genes in Silky Fowl; open bars: Numbers of down- regulated genes in Silky Fowl. Expression data werefiltered by GeneSpring 10 usingt-test (P<0.01, Fold change>2).
Table 2 Overrepresented GO categories of differentially expressed genes between SF and WL
GO Id Gene category Hit Enrichment testP-value
GO:0051707 Response to other organism 9 0.0013
GO:0048066 Pigmentation during development 4 0.0047
GO:0009607 Response to biotic stimulus 9 0.0071
GO:0007622 Rhythmic behavior 2 0.0099
GO:0002684 Positive regulation of immune system process 7 0.0185
breeds. Moreover, there were significant differences in expressions of the genes associated with responses to other organism (P = 0.0013) and rhythmic behavior (P = 0.0099).
By searching the Biocarta and KEGG (Kyoto Encyclo-pedia of Genes and Genomes) databases (http://www. genome.jp/kegg/pathway.html), seven significantly enriched pathways were mapped (Table 3). Melanogenesis was the most significantly over-represented pathway (P= 0.0015) in this study including seven differently expressed genes. The same five genes were detected in both the melanogenesis pathway and neuroactive ligand-receptor interaction pathway, owing to melanoblasts being derived from neural crest cells. Eight genes in the cytokine-cytokine receptor interaction pathway were identified. Other significantly over-represented pathways were retinol metabolism, ABC transporters, purine metabolism and the NOD-like receptor signaling pathway.
3.3 Differentially expressed genes related to melanocyte development
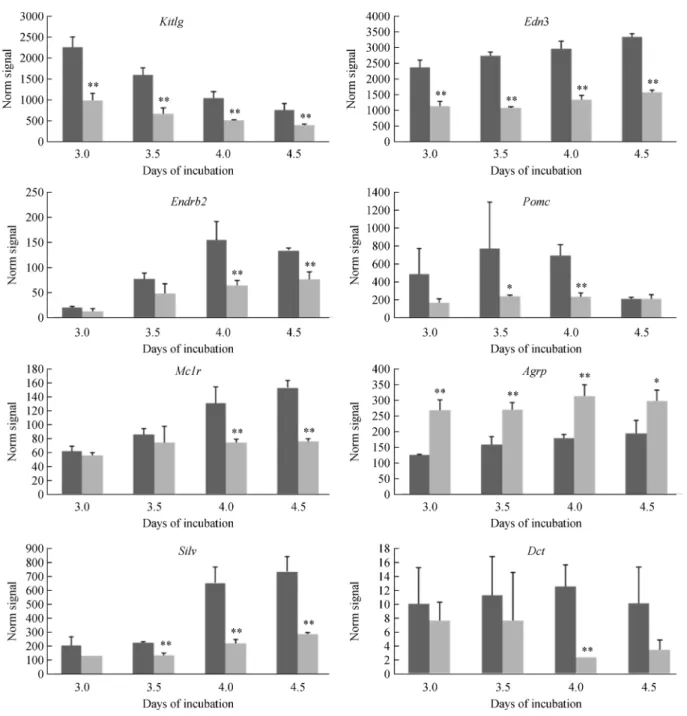
According to the annotations, a list of genes related to melanocyte development significantly differentially expressed between SF and WL was compiled. In general, higher expression of the dorsolateral genes Kitlg, Edn3, andPomcwas observed in SF compared to WL, at all four stages (Fig. 2). However, the expression of the melanocyte specific genesMc1r,Ednrb2,Silv, andDctwas statistically different until day 4 between SF and WL. The expression ofAgrpin WL was significant higher than that in SF at all four stages (Fig. 2). The results of microarray assay demonstrated that the eight differential expression genes show more than a twofold difference between SF and WL at one or more developmental stages.
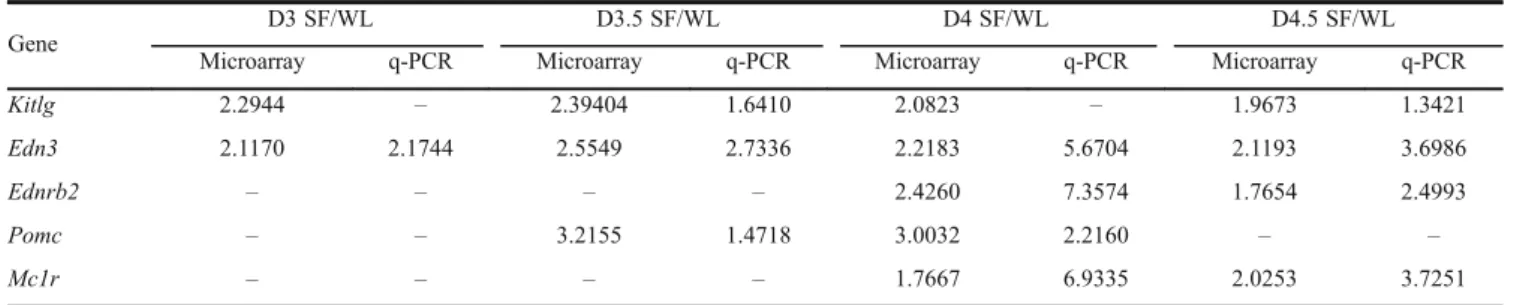
3.4 Differentially expressed genes were verified by quanti-tative PCR
To verify the microarray data, quantitative real-time PCR was conducted. Five of the genes (Kitlg, Edn3, Ednrb2, PomcandMc1r) related to melanocyte development that showed differential expressions were selected for q-PCR.
The results showed that there was strong coincidence with the microarray data (Table 4), with only slightly different fold-changes.
4
Discussion
The thoracic region of the chicken embryo is an important target for studying the mechanism of melanocyte devel-opment and most of the research findings for melanocyte development come from the studies at the thoracic level in avian embryos [11,12]. Melanocyte development depends on precise temporal and spatial gene regulation during embryogenesis. SF embryos show abnormal migration of melanoblasts, during embryogenesis and the gene expres-sion profiles at four representative stages of melanoblast migration were investigated and analyzed, in order to provide information regarding melanocyte development by comparison with the process in WL.
Previously, we reported the use of a semiquantitative method to investigate the expression profiles of 13 genes which are relevant to the development of melanocytes from day 2.5 to 15 in SF and WL [17]. Our results showed thatAgrpplays an important role in the process of melanin synthesis. But, there are several shortcomings in the semiquantitative method for analysis. First, the circle number in semiquantitative analysis is very difficult to control. Second, the expression level varies for different genes, stages and chicken breeds. Therefore, the difference between many high-expressed and low-expressed genes will not be found. In this study, a 44K Agilent chicken whole genome wide oligo nucleotide (60-mer) microarray was adopted to investigate the molecular events during melanocyte development in the thoracic region in SF compared with WL. Unlike a short oligonucleotide library, a long oligo nucleotide microarray can provide signifi -cantly improved sensitivity and can even detect one single transcript in one cell [18]. Previous studies have shown that the 44K Agilent chicken long oligonucleotide microarray can provide reliable results by detecting different chicken tissues [19]. Moreover, in order to improve the accuracy, three tissues from different individuals were pooled together for RNA extraction and
Table 3 Significantly enriched pathways of differentially expressed genes between SF and WL
Pathway DB Gene category Hit Enrichment testP-value
Kegg
Melanogenesis 7 0.0015
Neuroactive ligand-receptor interaction 12 0.0059
Cytokine-cytokine receptor interaction 8 0.0151
Retinol metabolism 3 0.0161
ABC transporters 3 0.0251
Purine metabolism 6 0.0288
hybridization in this study. There were two reasons for pooling: (1) tissue derived from a single embryos at these stages was too small to extract sufficient RNA; (2) pooling reduced the effect of individual variation, but highlighted the differences between breeds [20,21].
The key objective of this study was to identify candidate genes relevant to melanocyte development. According to functional annotation, the genes Kitlg, Edn3, Ednrb2, Pomc,Mc1r,Agrp,SilvandDctwere identified and shown to be significantly associated with the development of
melanocytes. Kitlg is produced by the dermomyotome, which could direct the melanoblasts to the dorsolateral pathway and induce high mitogenesis of melanoblasts by binding with the Kit receptor [22]. In mouse, the expression of Kitlg has been detected in the dermomyo-tome, and the Kit receptor is expressed on the cell surface of melanoblasts. After binding, Kitlg can assist the melanoblast migration to the dorsal pathway [23]. How-ever, in the avian embryo, some researchers foundKitlgis not produced by the dermomyotome but by the ectoderm Fig. 2 Expression patterns of differentially expressed genes related to pigment development. Data are represented as meanSD of replicates. The statistical variation between two chicken breeds was assessed byt-test (* meansP<0.05, ** meansP<0.01). Dark bars:
after stage 25 when melanoblast migration has finished [24]. Moreover, they suggested thatKitlg has no role in regulating the melanoblast migration in chicken [12,24]. In our study, however, the expression of Kitlg mRNA was detected no later than stage 20, and showed significantly increased expressed in SF, but the expression level gradually declined in both chicken breeds. It is suggested, therefore, that Kitlg may be involved in the atypical migration of melanocytes in SF in early embryo develop-ment.
By combination with Ednrb2, Edn3 can regulate substantially the migration and proliferation of melano-blasts [25]. From the results of mice experiment,End3was found to be the necessary factor for the specialization of melanoblasts, which can collaborate with the Kit signal pathway to regulate melanoblast migration. In avians, Edn3 is expressed by the ectoderm and dermomyotome during early embryo development [26]. Initially, Ednrb was found in the neural crest cells, and then decreased Ednrbexpression and increasedEdnrb2 expression were detected in melanoblasts when they began to migrate in the dorsal pathway. SoEdn3plays a positive role in attracting melanoblasts into the dorsolateral space [10]. Besides the effect on melanoblast migration, several studies discovered that Edn3 could obviously promote proliferation and maintain survival of melanoblasts, which was closely related to hyperpigmentation of internal organs in SF [27]. Our results indicated that theEdn3significantly increased from day 3, which could facilitate the migration, survival and differentiation of the melanoblasts in SF. In view of the sample limitation in this study, the question whetherEnd3 is expressed in other embryo tissues that results in wide distribution of melanocytes need to be further investigated. In contrast, the delayed expression ofEdnrb2in embryos probably resulted from the fact that melanonblasts increased significantly until day 4 post incubation [5].
Pomc is a precursor peptide, which could produce numerous peptides by proteolytic action [28]. Two peptides from Pomc, ACTH and α-MSH can stimulate
melanogenesis, dendricity and proliferation of melano-cytes by interaction with their surface receptor Mc1r [29,30]. After binding, the cAMP or PKA signal pathways can be activated, followed by stimulated expression of Mitf
which is the most important factor in the multiple stages of melanocyte development. In our study, overexpression of Pomc on day 3.5 and 4 post incubation was detected and might have resulted in an increase inα-MSH. Additionally,
it is noteworthy that increased expression of Mc1R was detected on day 4 and 4.5 post incubation, and the increasedα-MSH could interact with Mc1R and play a role
in the development of melanocytes. Agrp is an antagonist of Mc3R and Mc4R in mammals, but would be a physiological antagonist of Mc1R in chicken [31]. We found thatAgrpexpression in WL was significantly higher than that in SF, which can result in no pigmentation in WL but obvious pigmentation in multiple tissues in SF.
Silv is one of the main structuralfibrillar components for the formation of melanosomes [32]. We found that in SF, Silv expression was obviously increased from day 3.5 to day 4.5, which is coincides with the time of melanoblast migration and location. Dct is a key enzyme during melanin synthesis and controls the types and qualities of melanin in melanocytes [33,34]. In our study, the increase of Dct in SF was detected which would be helpful for the demand for melanin synthesis at the late stages of embryo development. The results indicated that high expressions ofSilvandDctin SF embryos occurred after 4 days post incubation when the melanocytes significantly increased, and similar changes toEdnrb2andMc1Rappeared.
There are undoubtedly significant differences in genes expression during melanocyte development between SF and WL, but it is intriguing to note the differential expression between the two in the genes associated with the immune response. The results of GO annotation showed that innate immune genes were expressed in the SF embryo, such as the immune defense genesDefb1,Gal, Tap2 and IL-2rg, whereas some downregulated immune response genes were also observed includingIRF7,IL18, Cd3e and Pldn (Data not shown). In addition, the Kegg pathway analysis showed that the differentially expressed genes were mainly involved in cytokine-cytokine receptor interaction and the NOD-like receptor signaling pathway, which relate to many biological processes. These results suggest that the big differences in immune genes expression are possibly related to the substantial melano-blasts migration in early SF embryo development, Table 4 Detection of expression of six genes by microarray and quantitative real-time PCR
Gene
D3 SF/WL D3.5 SF/WL D4 SF/WL D4.5 SF/WL
Microarray q-PCR Microarray q-PCR Microarray q-PCR Microarray q-PCR
Kitlg 2.2944 – 2.39404 1.6410 2.0823 – 1.9673 1.3421
Edn3 2.1170 2.1744 2.5549 2.7336 2.2183 5.6704 2.1193 3.6986
Ednrb2 – – – – 2.4260 7.3574 1.7654 2.4993
Pomc – – 3.2155 1.4718 3.0032 2.2160 – –
Mc1r – – – – 1.7667 6.9335 2.0253 3.7251
resulting in the aberrant development of the immune systems in SF. However, the immune defense genes were upregulated as a result, which could shield against pathogens infection or external stress. This suggestion needs further studies to be confirmed.
5
Conclusions
This studyfirst dissected the gene expression differences between hyperpigmented SF and normal WL using microarray analysis. On account of the nonsufficient probes, several genes related to melanocyte development were found during embryo development. Other genes discovered in this study will help us to understand the influence of hyperpigmentation on other tissue develop-ment in SF.
Acknowledgements This work was supported by Natural Science Foundation of China (31472082, 30771535) and the National High-tech R&D Program of China (2013AA102501).
Compliance with ethics guidelines Yulin Li, Deping Han, Junying Li, Dawn Koltes and Xuemei Deng declare that they have no conflict of interest orfinancial conflicts to disclose.
All applicable institutional and national guidelines for the care and use of animals were followed.
References
1. Loring J F, Erickson C A. Neural crest cell migratory pathways in the trunk of the chick embryo.Developmental Biology, 1987, 121 (1): 220–236
2. Dorsky R I, Moon R T, Raible D W. Control of neural crest cell fate by the Wnt signalling pathway.Nature, 1998, 396(6709): 370–373
3. Jin E J, Erickson C A, Takada S, Burrus L W. Wnt and BMP signaling govern lineage segregation of melanocytes in the avian embryo.Developmental Biology, 2001, 233(1): 22–37
4. Harris M L, Erickson C A. Lineage specification in neural crest cell pathfinding.Developmental Dynamics, 2007, 236(1): 1–19
5. Faraco C D, Vaz S A, Pástor M V, Erickson C A. Hyperpigmenta-tion in the Silkie fowl correlates with abnormal migraHyperpigmenta-tion of fate-restricted melanoblasts and loss of environmental barrier molecules.
Developmental Dynamics, 2001, 220(3): 212–225
6. Ma Y, Li A, Faller W J, Libertini S, Fiorito F, Gillespie D A, Sansom O J, Yamashiro S, Machesky L M. Fascin 1 is transiently expressed in mouse melanoblasts during development and promotes migration and proliferation. Development, 2013, 140(10): 2203–
2211
7. Lindsay C R, Lawn S, Campbell A D, Faller W J, Rambow F, Mort R L, Timpson P, Li A, Cammareri P, Ridgway R A, Morton J P, Doyle B, Hegarty S, Rafferty M, Murphy I G, McDermott E W, Sheahan K, Pedone K, Finn A J, Groben P A, Thomas N E, Hao H, Carson C, Norman J C, Machesky L M, Gallagher W M, Jackson I J, Van Kempen L, Beermann F, Der C, Larue L, Welch H C, Ozanne B W, Sansom O J. P-Rex1 is required for efficient melanoblast
migration and melanoma metastasis.Nature Communications, 2011, 2: 555
8. Santiago A, Erickson C A. Ephrin-B ligands play a dual role in the control of neural crest cell migration.Development, 2002, 129(15): 3621–3632
9. Jia L, Cheng L, Raper J. Slit/Robo signaling is necessary to confine early neural crest cells to the ventral migratory pathway in the trunk.
Developmental Biology, 2005, 282(2): 411–421
10. Pla P, Alberti C, Solov’eva O, Pasdar M, Kunisada T, Larue L. Ednrb2 orients cell migration towards the dorsolateral neural crest pathway and promotes melanocyte differentiation. Pigment Cell Research, 2005, 18(3): 181–187
11. Muroya S, Tanabe R, Nakajima I, Chikuni K. Molecular characteristics and site specific distribution of the pigment of the Silky fowl. Journal of Veterinary Medical Science, 2000, 62(4): 391–395
12. Reedy M V, Faraco C D, Erickson C A. Specification and migration of melanoblasts at the vagal level and in hyperpigmented Silkie chickens.Developmental Dynamics, 1998, 213(4): 476–485
13. de Freitas P F, Ferreira F F, Faraco C D. PNA-positive glycoconjugates are negatively correlated with the access of neural crest cells to the gut in chicken embryos.The Anatomical Record. Part A: Discoveries in Molecular, Cellular, and Evolutionary Biology, 2003, 273A(2): 705–713
14. Dorshorst B, Okimoto R, Ashwell C. Genomic regions associated with dermal hyperpigmentation, polydactyly and other morpholo-gical traits in the Silkie chicken.Journal of Heredity, 2010, 101(3): 339–350
15. Shinomiya A, Kayashima Y, Kinoshita K, Mizutani M, Namikawa T, Matsuda Y, Akiyama T. Gene duplication ofendothelin 3 is closely correlated with the hyperpigmentation of the internal organs (Fibromelanosis) in Silky chickens.Genetics, 2012, 190(2): 627–
638
16. Li X, Chiang H I, Zhu J, Dowd S E, Zhou H. Characterization of a newly developed chicken 44K Agilent microarray.BMC Genomics, 2008, 9(1): 60
17. Li Y, Zhu X, Yang L, Li J, Lian Z, Li N, Deng X. Expression and network analysis of genes related to melanocyte development in the Silky Fowl and White Leghorn embryos. Molecular Biology Reports, 2011, 38(2): 1433–1441
18. Shippy R, Sendera T J, Lockner R, Palaniappan C, Kaysser-Kranich T, Watts G, Alsobrook J. Performance evaluation of commercial short-oligonucleotide microarrays and the impact of noise in making cross-platform correlations.BMC Genomics, 2004, 5(1): 61 19. Sarson A J, Wang Y, Kang Z, Dowd S E, Lu Y, Yu H, Han Y, Zhou
H, Gong J. Gene expression profiling within the spleen of
Clostridium perfringens-challenged broilers fed antibiotic-medi-cated and non-mediantibiotic-medi-cated diets.BMC Genomics, 2009, 10(1): 260 20. Kendziorski C M, Zhang Y, Lan H, Attie A D. The efficiency of
pooling mRNA in microarray experiments.Biostatistics, 2003, 4(3): 465–477
21. Peng X, Wood C L, Blalock E M, Chen K C, Landfield P W, Stromberg A J. Statistical implications of pooling RNA samples for microarray experiments.BMC Bioinformatics, 2003, 4(1): 26 22. Bonaventure J, Domingues M J, Larue L. Cellular and molecular
mela-noma cells.Pigment Cell & Melanoma Research, 2013, 26(3): 316–
325
23. Wehrle-Haller B, Morrison-Graham K, Weston J A. Ectopicc-kit
expression affects the fate of melanocyte precursors inPatchmutant embryos.Developmental Biology, 1996, 177(2): 463–474
24. Reedy M V, Johnson R L, Erickson C A. The expression patterns of
c-kitandS1in chicken embryos suggest unexpected roles for these genes in somite and limb development.Gene Expression Patterns, 2003, 3(1): 53–58
25. Pla P, Larue L. Involvement of endothelin receptors in normal and pathological development of neural crest cells. International Journal of Developmental Biology, 2003, 47(5): 315–325
26. Nataf V, Amemiya A, Yanagisawa M, Le Douarin N M. The expression pattern of endothelin 3 in the avian embryo.Mechanisms of Development, 1998, 73(2): 217–220
27. Lahav R, Dupin E, Lecoin L, Glavieux C, Champeval D, Ziller C, Le Douarin N M. Endothelin 3 selectively promotes survival and proliferation of neural crest-derived glial and melanocytic pre-cursorsin vitro.Proceedings of the National Academy of Sciences of the United States of America, 1998, 95(24): 14214–14219
28. Seidah N G, Benjannet S, Hamelin J, Mamarbachi A M, Basak A, Marcinkiewicz J, Mbikay M, Chrétien M, Marcinkiewicz M. The subtilisin/kexin family of precursor convertases. Emphasis on PC1, PC2/7B2, POMC and the novel enzyme SKI-1.Annals of the New
York Academy of Sciences, 1999, 885(1): 57–74
29. Suzuki I, Cone R D, Im S, Nordlund J, Abdel-Malek Z A. Binding of melanotropic hormones to the melanocortin receptor MC1R on human melanocytes stimulates proliferation and melanogenesis.
Endocrinology, 1996, 137(5): 1627–1633
30. Kauser S, Thody A J, Schallreuter K U, Gummer C L, Tobin D J. A fully functional proopiomelanocortin/melanocortin-1 receptor sys-tem regulates the differentiation of human scalp hair follicle melanocytes.Endocrinology, 2005, 146(2): 532–543
31. Takeuchi S, Teshigawara K, Takahashi S. Widespread expression of Agouti-related protein (AGRP) in the chicken: a possible involve-ment of AGRP in regulating peripheral melanocortin systems in the chicken. Biochimica et Biophysica Acta, 2000, 1496(2–3): 261–
269
32. Berson J F, Theos A C, Harper D C, Tenza D, Raposo G, Marks M S. Proprotein convertase cleavage liberates afibrillogenic fragment of a resident glycoprotein to initiate melanosome biogenesis.
Journal of Cell Biology, 2003, 161(3): 521–533
33. Lamoreux M L, Wakamatsu K, Ito S. Interaction of major coat color gene functions in mice as studied by chemical analysis of eumelanin and pheomelanin.Pigment Cell Research, 2001, 14(1): 23–31