Climatic Stress during Stand Development
Alters the Sign and Magnitude of
Age-Related Growth Responses in a Subtropical
Mountain Pine
Paloma Ruiz-Benito1
*, Jaime Madrigal-González2, Sarah Young3, Pierre Mercatoris1,
Liam Cavin1, Tsurng-Juhn Huang3, Jan-Chang Chen4, Alistair S. Jump1
1Biological and Environmental Sciences, School of Natural Sciences, University of Stirling, Stirling, United Kingdom,2Forest Ecology and Restoration Group, Department of Life Sciences, University of Alcala, Alcalá de Henares, Madrid, Spain,3School of Medicine and Research Center for Biodiversity, China Medical University, Taichung, Taiwan,4Department of Forestry, National Pingtung University of Science and Technology, Nei Pu Hsiang, Pingtung, Taiwan
Abstract
The modification of typical age-related growth by environmental changes is poorly under-stood, In part because there is a lack of consensus at individual tree level regarding age-de-pendent growth responses to climate warming as stands develop. To increase our current understanding about how multiple drivers of environmental change can modify growth re-sponses as trees age we used tree ring data of a mountain subtropical pine species along an altitudinal gradient covering more than 2,200 m of altitude. We applied mixed-linear mod-els to determine how absolute and relative age-dependent growth varies depending on stand development; and to quantify the relative importance of tree age and climate on indi-vidual tree growth responses. Tree age was the most important factor for tree growth in models parameterised using data from all forest developmental stages. Contrastingly, the relationship found between tree age and growth became non-significant in models parame-terised using data corresponding to mature stages. These results suggest that although ab-solute tree growth can continuously increase along tree size when trees reach maturity age had no effect on growth. Tree growth was strongly reduced under increased annual temper-ature, leading to more constant age-related growth responses. Furthermore, young trees were the most sensitive to reductions in relative growth rates, but absolute growth was strongly reduced under increased temperature in old trees. Our results help to reconcile pre-vious contrasting findings of age-related growth responses at the individual tree level, sug-gesting that the sign and magnitude of age-related growth responses vary with stand development. The different responses found to climate for absolute and relative growth rates suggest that young trees are particularly vulnerable under warming climate, but re-duced absolute growth in old trees could alter the species’potential as a carbon sink in
the future. OPEN ACCESS
Citation:Ruiz-Benito P, Madrigal-González J, Young S, Mercatoris P, Cavin L, Huang T-J, et al. (2015) Climatic Stress during Stand Development Alters the Sign and Magnitude of Age-Related Growth Responses in a Subtropical Mountain Pine. PLoS ONE 10(5): e0126581. doi:10.1371/journal. pone.0126581
Academic Editor:Eryuan Liang, Chinese Academy of Sciences, CHINA
Received:December 8, 2014
Accepted:April 6, 2015
Published:May 14, 2015
Copyright:© 2015 Ruiz-Benito et al. This is an open access article distributed under the terms of the
Creative Commons Attribution License, which permits unrestricted use, distribution, and reproduction in any medium, provided the original author and source are credited.
Data Availability Statement:The authors confirm that all data underlying the findings are fully available without restriction. Data available from the Dryad Digital Repository: doi:10.5061/dryad.r8p5m.
Funding:This research was supported by an International Joint Project Grant from The Royal Society and the National Science Council of Taiwan and by Leverhulme Trust project IN-2013-004.
Introduction
Forests are key ecosystems for the global carbon cycle [1] and provide multiple ecosystem ser-vices fundamental to human well-being [2]. During the last century a rapid increase in forest growth has been observed worldwide alongside elevated atmospheric carbon dioxide (e.g. [3,
4]). However, signs of forest response saturation to CO2increases have already been reported [5] and there is increasing evidence that rising atmospheric CO2can no longer offset the nega-tive impacts of warming on tree growth (e.g. [6]). Understanding the variation in the contribu-tion of individual trees to stand productivity is particularly important because although large trees may have a disproportionate role in accumulating biomass (e.g. [7]) differential sensitivity to climate has been reported as trees age (e.g. [8,9]). Consequently, we urgently need to under-stand how interactions between age and climate warming may affect individual tree growth to adequately predict stand-level responses and likely future impacts on the carbon cycle e.g. through absolute tree growth, [1,7] and vulnerability to climate warming (e.g. through relative tree growth, [10]).
Absolute and relative age-related growth responses have been widely studied at stand level, because absolute growth informs about net changes in biomass while relative growth depends on the previous size. Absolute age-related growth generally shows hump-shaped responses as stand develops (e.g. [11,12]). Declines in absolute stand growth at mature stages have been re-lated to tree-level physiological constrains, as reduced carbon gains and photosynthetic effi-ciency (i.e. due to unbalanced carbon gains and respiration); nutrient decreases and hydraulic constraints (i.e. less supply of water and nutrients in large trees); and changes in root-to-shoot allocation (e.g. [13,14]). At tree level, relative growth rates generally decrease with age and/or size [15] but contrasting absolute growth responses have been recently reported and discussed (seeS1 Table): from no evidence of age-related responses [16] and hump-shaped responses (e.g. [17,18]), to a continuous biomass increase with tree size and age (e.g. [7,19]). The contin-uous increase in absolute tree growth with age as opposed to the traditional hump-shaped growth at stand level could be due to changes through stand development, for example: (i) physiological adjustments such as crown optimization (i.e. leaves are organised in mature stages to maximize carbon gains) and increased leaf packing (i.e. leaf area index can increase with age producing higher growth, [20] can occur; and (ii) differential resource availability, stand heterogeneity and species dominance [21,22]. Furthermore, growth could be largely re-duced under increased climatic stress and high competition levels [23,24]. However, it is not completely understood if interactions between climate and age as stands develop might lead to different age- and size-dependent absolute and relative growth patterns (e.g. [25]).
Larger sensitivities to climate in young as opposed to old trees may imply bottlenecks in forest persistence under warming climate (e.g. [10]).
The study of the effects of climate warming on tropical forests has been particularly scarce and controversial compared to higher latitudes [30,35,36]. In this study, we examined both absolute and relative tree level growth responses to age and climate of a sub-tropical pine spe-cies,Pinus taiwanensisHayata, along a large altitudinal gradient ofc. 2,200 vertical meters. We used tree ring data to account for age-dependent growth responses during the 20thcentury at the tree level while considering climatic variability (see [37,38]). The large altitudinal and tem-poral gradient covered by this study provides a good example a mountain sub-tropical species where increased temperature may have altered age-related growth patterns at the tree level dur-ing stand development. Our main objectives are: (i) to determine how age-related growth re-sponses vary when forests are assessed from developing stages to maturity, and (ii) to quantify the relative importance and interactions between tree age and climate on absolute and relative age-related tree growth responses. We addressed three main hypotheses: (i) absolute growth would increase and relative growth decrease as trees age when all stand developmental stages are considered together, but slight declines or no-effects would be observed in mature stages; (ii) increased temperature would cause reduced tree growth, particularly in trees located in the warmest sites covered by this study; and (iii) young trees would be more responsive to climate in relative growth terms, whereas we do not have a clear expectation for absolute growth. The results provided here constitute new evidence to better understand how age-related growth patterns depend on stand development and predict potential impacts of warming climate de-pending on tree ontogeny.
Material and Methods
Study Site and Analysed Variables
Pinus taiwanensisis the most widely distributed pine species in Taiwan, occurring from warm
temperate to sub-alpine climates.P.taiwanensisis an early successional species and can occur as pure stands throughout its altitudinal gradient as well as mixed stands with broadleaved spe-cies to isolated trees in high-elevation montane meadows. However, stands of this spespe-cies can also constitute a successional end-point under severe environmental conditions, such as on precipices or shallow and stony soils (e.g. [39]). The sites selected in this study covered a large altitudinal gradient which varied markedly on species composition and richness (seeFig 1).
Pinus taiwanensisgrows within the subtropical biome in central Taiwan covering a large
al-titudinal gradient.Pinus taiwanensisdominates during early stages of stand development, re-maining a dominant vegetation component in small patches across the large altitudinal gradient covered in this study (2,250 m a.s.l.). Five study sites were established covering the al-titudinal distribution ofP.taiwanensisforests (from 695 to 2,945 m a.s.l.). Sites covered a gradi-ent of forest composition, from species rich sub-tropical lowland forests to relatively species poor high altitude forest surrounded by the montane conifer,Abies kawakamii(seeS2 Table). For each of the five study sites, monthly mean annual temperature (°C) and annual precipita-tion (mm) was obtained from 1960 to 2009 (seeFig 2). Mean annual temperature (°C) for each site was interpolated from the records of Alishan meteorological station (2,413 m a.s.l.) accord-ing to the regional altitudinal temperature lapse of -0.5°C each 100 m [40]. Annual precipita-tion (mm) was obtained from interpolated precipitaprecipita-tion data provided by Taiwan from the Central Weather Bureau, Taiwan.
manipulation of endangered or protected species. From each study site, 20 dominant or co-dominant trees were selected and two or three cores were collected from each individual tree using a 4.3 mm increment borer at breast height (1.30 m). Samples were prepared for tree-ring analysis using standard dendroecological techniques and scanned at 3,200 d.p.i. using a flatbed scanner and saved as. jpg files. Total ring width was measured to an accuracy of 0.001 mm using CooRecorder v.2.3.13 [41]. A small number of cores that were not readable were exclud-ed. In order to detect dating and measurements errors, ring-width series were checked with COFECHA v606P software [42]. Sections of any core that showed a poor match with the COFECHA master series for each site (i.e. correlation<0.3) were identified. Where poor
matching of correctly dated segments resulted from twisted, compressed or decayed wood, these cores were excluded from the analysis. Ring width for each year was averaged between
Fig 1. Map ofPinus taiwanensissites sampled in Taiwan.We includedPinus taiwanensisdistribution [65] and the altitudinal gradient in Taiwan (digital elevation model STRM30, SRTM V2,http://www2.jpl.nasa.gov/ srtm/).
the cores taken from each tree to produce a final ring width series for each individual. Statistics of ring width chronologies (seeS3 Table) shows that mean sensitivity ranged between 0.170 and 0.414 (i.e. range of easy dating, [34]).
Ring width values (mm yr-1) were used to estimate the age at breast height. After determina-tion of the full core width (mm), a central area of the tree cross-secdetermina-tion remained with un-known age. This area was divided by average ring width for the first recorded 10 years of the tree growth to estimate the number of years of this section. This estimated value was added to the number of years of growth recorded for the core to provide an approximate measure of ab-solute tree age (No. years) in each of the five study sites when the samples were collected in 2010.
Ring width (RW, mm yr-1) was converted to tree basal area increment (BAI, mm2yr-1) using dplR library [43] in R version 3.0.1 [44], according to the following standard formula:
BAI ¼ pðR2
n R
2
n 1Þ ð1Þ
WhereRis the radius of the tree (mm) andnis the year of the tree ring formation. Finally, we also calculated relative tree growth (RTG, % yr-1), as the annual basal area increment with re-spect to the basal area of the previous year. Relative growth rate was also selected because it is easily comparable among different tree and stand developmental stages [45].
Fig 2. Temporal change in climate from 1960 to 2009 for the study area.We show the mean climate in all the sites sampled for the period 1960–2009 of (a) mean annual temperature (°C) and (b) annual precipitation (mm).
doi:10.1371/journal.pone.0126581.g002
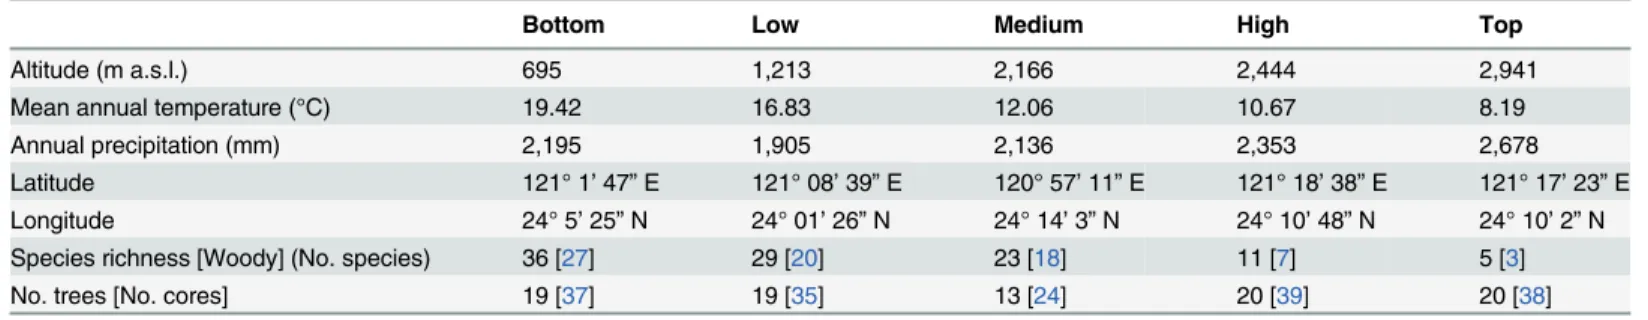
Table 1. Summary characteristics of the study sites alongPinus taiwanensisdistribution.
Bottom Low Medium High Top
Altitude (m a.s.l.) 695 1,213 2,166 2,444 2,941
Mean annual temperature (°C) 19.42 16.83 12.06 10.67 8.19
Annual precipitation (mm) 2,195 1,905 2,136 2,353 2,678
Latitude 121° 1’47”E 121° 08’39”E 120° 57’11”E 121° 18’38”E 121° 17’23”E
Longitude 24° 5’25”N 24° 01’26”N 24° 14’3”N 24° 10’48”N 24° 10’2”N
Species richness [Woody] (No. species) 36 [27] 29 [20] 23 [18] 11 [7] 5 [3]
No. trees [No. cores] 19 [37] 19 [35] 13 [24] 20 [39] 20 [38]
Statistical Analysis
We modelled basal area increment (BAI, mm2yr-1) and relative tree growth (RTG, %) using linear mixed-effects models for two data-sets: (i) data covering all developmental stages (i.e. using data from 1960 to 2009 where climatic information was available), and (ii) mature-stage data following stabilization of basal area increment as tree age increases (i.e. using data from the inflection point for each site showed inFig 3). To split the data in the mature development stage, mean basal area increment for each site and all data were smoothed using a cubic smoothing spline and smoothing parameters that varied between 0.8 and 0.9 and obtaining the same results in R.3.0.1 [44], allowing us to highlight growth trends while retaining their
Fig 3. Basal area increment and relative growth from 1909 to 2009 in each site ((a) and (b), respectively).Arrows show the inflection point for each site and the legend gives the year following the inflection point for each site indicating the beginning of the mature phase of growth.
variability. We calculated an inflection point of basal area increment, marking the start point at which the mature phase occurs in each site from the next year of the inflection point to avoid the growth peak during stand development (seeFig 3). All statistical analysis were performed usingBAIandRGTdata for each tree and year (i.e. smoothed data was not used).
Linear mixed-effects models were fitted using a normal distribution of residuals and an identity link for the response variable (using log(BAI) or log(RTG) as response variable). The linear mixed-effects models had a normal error distribution and an identity link. For the two sets of models we included one fixed predictor of tree age (TA, No. years): (i) tree age in models parameterised using all developmental stage data (i.e. this measure varies within time); and (ii) absolute tree age in models parameterised with mature stage data (i.e. absolute tree age). We also included two fixed predictor climatic variables: mean annual temperature (MAT, °C), and annual precipitation (PP, mm; see mean values inTable 1). Based on our initial hypotheses and preliminary analysis of response variables along explanatory predictors (seeS1andS2Figs), we tried differential functional forms, including linear or nonlinear terms for each explanatory variable and the pair-wise interactionsTA×MATandTA×PP(seeS4andS5Tables). All the numerical predictor variables were standardised (i.e. the mean was subtracted from each value and divided by the standard deviation), enabling the interactions to be tested and compared [46]. Tree identity nested in site identity was included in the model as a random effect to ac-count for non-independence due to their similar localities. Additionally, in order to detect co-linearity between explanatory variables, we calculated the variance inflation factors (VIFs) for each predictor variable. VIFs calculate the degree to which co-linearity inflates the estimated regression coefficients as compared with the orthogonal predictors. Our results confirmed that co-linearity was not a major problem in our data (VIF<1.5).
The most parsimonious model was determined using AIC (Akaike Information Criterion) as an indicator of both parsimony and likelihood, where a difference lower than 10 indicated no support for the most complex model [47]. To identify the best-supported model we con-structed all possible combinations of alternative models, from the maximal model considering both the main effects and the pair-wise interactions between the fixed effects. However, as we were interested in analysing the effect of tree age on basal area increment and relative tree growth, we always retained tree age as a variable in order to compare its effect between different models. Therefore, tree age was retained even when it was not supported by the most parsimo-nious model for comparative purposes (seeS5 Table). Repeated analyses with tree age excluded showed that parameters estimates were not affected by its inclusion in the model (data not shown). From the final models selected, each variable and interaction term was dropped, using the differences in AIC to quantify the relative importance of each predictor variable.
Results
Absolute and Relative Tree Growth in all Developmental Stages and
Mature Forests
Using data from all developmental stages, the best model of basal area increment (BAI) includ-ed all main effects and the pair-wise interaction between tree age and mean annual temperature (seeTable 2), according to the following form:
logðBAIÞ ¼ b1þb2ðTAÞ þb3ðTA2
Þ þb4ðMATÞ þb5ðMAT2
Þ þb6ðPPÞ þb7ðTAÞðMATÞ ð2Þ
whereβ1toβ7are the estimated parameters and the predictor variables were: tree age (TA), mean
annual temperature (MAT) and annual precipitation (PP).
Additionally, in relative tree growth (RTG) models an interaction between tree age (TA) and annual precipitation (PP) was supported by the best model. Therefore, the best model of relative tree growth (RTG) using data from all developmental stages followed the next form:
logðRTGÞ ¼b1þb2ðTAÞ þb3ðTA 2
Þ þb4ðMATÞ þb5ðMAT 2
Þ þb6ðPPÞ þb7ðTAÞðMATÞ þb8ðTAÞðPPÞ ð3Þ
whereβ1toβ8are the estimated parameters. Marginal pseudo-R2of theBAIandRTGmodels varied between 0.25 and 0.70 (i.e. variance explained by thefixed terms), and conditional pseu-do-R2varied between 0.74 and 0.89 (i.e. variance explained by thefixed and random terms, see
Table 3for the estimated parameter values within each model and response variables andS3
andS4Figs for residuals).
Using data from mature stages of growth the best models of basal area increment (BAI) and relative tree growth (RTG) only included the effects of climatic variables (seeS5 Table). Howev-er, in order to compare individual tree growth responses with models parameterised using data from all developmental stages, we included the main effects of the predictor variables explored, according to the following form:
logðBAI;RTGÞ ¼ b1þb2ðTAÞ þb3ðMATÞ þb4ðMAT2
Þ þb5ðPPÞ ð4Þ
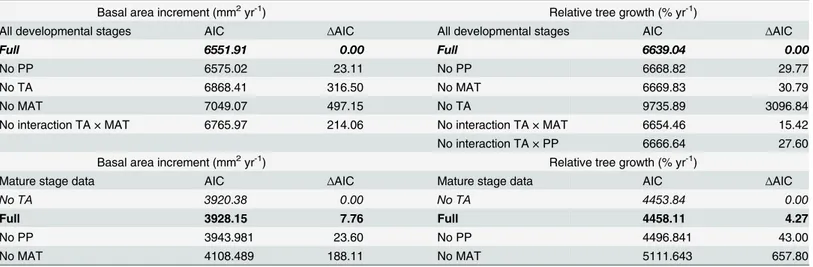
Table 2. Alternative models of basal area increment and relative tree growth based on Akaike Information Criterion.
Basal area increment (mm2yr-1) Relative tree growth (% yr-1)
All developmental stages AIC ∆AIC All developmental stages AIC ∆AIC
Full 6551.91 0.00 Full 6639.04 0.00
No PP 6575.02 23.11 No PP 6668.82 29.77
No TA 6868.41 316.50 No MAT 6669.83 30.79
No MAT 7049.07 497.15 No TA 9735.89 3096.84
No interaction TA × MAT 6765.97 214.06 No interaction TA × MAT 6654.46 15.42
No interaction TA × PP 6666.64 27.60
Basal area increment (mm2yr-1) Relative tree growth (% yr-1)
Mature stage data AIC ∆AIC Mature stage data AIC ∆AIC
No TA 3920.38 0.00 No TA 4453.84 0.00
Full 3928.15 7.76 Full 4458.11 4.27
No PP 3943.981 23.60 No PP 4496.841 43.00
No MAT 4108.489 188.11 No MAT 5111.643 657.80
Full models include the main effects of tree age (TA), mean annual temperature (MAT) and annual precipitation (PP). Alternative models ignore the effects (‘No’) of the main effects of each explanatory variable or interactions. The bestfitting model is determined by∆AIC value of zero and it is given in italics.
The selected model includes the effect of tree age and it is given in bold.
whereβ1toβ5are the estimated parameters and the predictor variables were: tree age (TA), mean annual temperature (MAT) and annual precipitation (PP). Marginal pseudo-R2of the models varied between 0.42 and 0.43 (i.e. variance explained by thefixed terms), and condi-tional pseudo-R2varied between 0.92 and 0.98 (i.e. variance explained by thefixed and random terms, seeTable 3for the estimated parameter values within each model and response variables andS3andS4Figs for residuals).
Effects of Tree Age and Climate on Absolute and Relative Tree Growth
AIC model comparisons indicate that in the models considering all developmental stages, tree age (TA) and mean annual temperature (MAT) were the most important determinants of indi-vidual tree growth (Table 2). Annual precipitation was generally less important, although re-tained by the best model (Table 2). Contrastingly, for models parameterised using data from the mature stage of growth, the model comparison suggests that tree age is not supported by the best models (see∆AIC inTable 2).
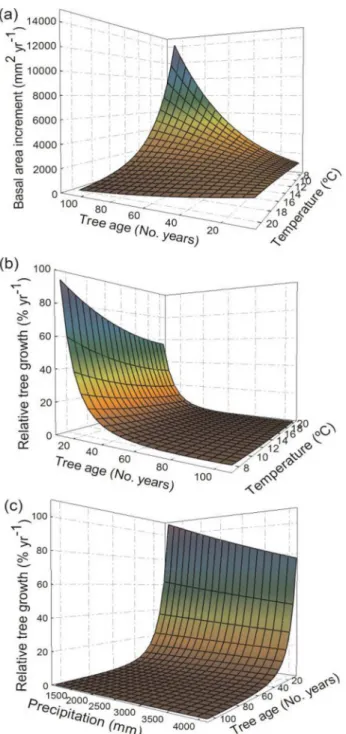
Tree growth responses with age varied the sign and magnitude depending on stand develop-ment (seeFig 4and parameter values inTable 3). In models parameterized using all develop-mental stages we observed that basal area increment increases along the entire tree age gradient (Fig 4A). Relative tree growth was greatest for young trees (TA<20 years), levelling out at larger tree ages (Fig 4A). However, in models parameterised using mature stage data, there was almost no effect of tree age on tree growth (Fig 4B).
At high mean annual temperatures both absolute and relative tree growth were lowest, inde-pendently of the data considered (i.e. both all developmental stages together and mature stage alone, seeFig4C and 4D). Furthermore, the interactions between tree age and mean annual
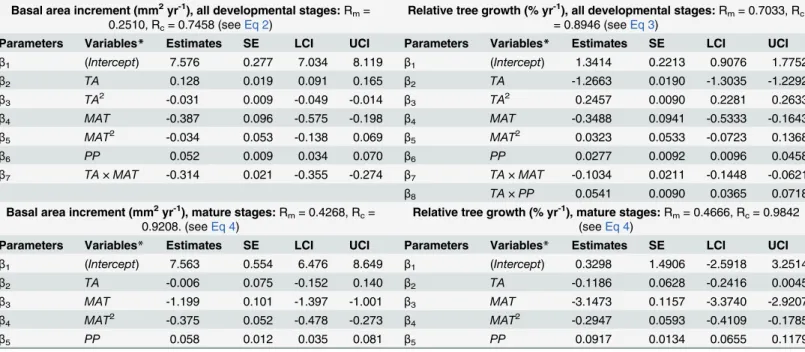
Table 3. Parameters of the final models of basal area increment and relative tree growth.
Basal area increment (mm2yr-1), all developmental stages:Rm= 0.2510, Rc= 0.7458 (seeEq 2)
Relative tree growth (% yr-1), all developmental stages:Rm= 0.7033, Rc = 0.8946 (seeEq 3)
Parameters Variables* Estimates SE LCI UCI Parameters Variables* Estimates SE LCI UCI β1 (Intercept) 7.576 0.277 7.034 8.119 β1 (Intercept) 1.3414 0.2213 0.9076 1.7752
β2 TA 0.128 0.019 0.091 0.165 β2 TA -1.2663 0.0190 -1.3035 -1.2292
β3 TA2 -0.031 0.009 -0.049 -0.014 β3 TA2 0.2457 0.0090 0.2281 0.2633
β4 MAT -0.387 0.096 -0.575 -0.198 β4 MAT -0.3488 0.0941 -0.5333 -0.1643
β5 MAT2 -0.034 0.053 -0.138 0.069 β5 MAT2 0.0323 0.0533 -0.0723 0.1368
β6 PP 0.052 0.009 0.034 0.070 β6 PP 0.0277 0.0092 0.0096 0.0458
β7 TA×MAT -0.314 0.021 -0.355 -0.274 β7 TA×MAT -0.1034 0.0211 -0.1448 -0.0621
β8 TA×PP 0.0541 0.0090 0.0365 0.0718
Basal area increment (mm2yr-1), mature stages:Rm= 0.4268, Rc= 0.9208. (seeEq 4)
Relative tree growth (% yr-1), mature stages:Rm= 0.4666, Rc= 0.9842 (seeEq 4)
Parameters Variables* Estimates SE LCI UCI Parameters Variables* Estimates SE LCI UCI β1 (Intercept) 7.563 0.554 6.476 8.649 β1 (Intercept) 0.3298 1.4906 -2.5918 3.2514
β2 TA -0.006 0.075 -0.152 0.140 β2 TA -0.1186 0.0628 -0.2416 0.0045
β3 MAT -1.199 0.101 -1.397 -1.001 β3 MAT -3.1473 0.1157 -3.3740 -2.9207
β4 MAT2 -0.375 0.052 -0.478 -0.273 β4 MAT2 -0.2947 0.0593 -0.4109 -0.1785
β5 PP 0.058 0.012 0.035 0.081 β5 PP 0.0917 0.0134 0.0655 0.1179
Parameters and variables related to the parameters (Parameters and Variables, respectively), mean parameter estimates (Estimates), standard error (SE), 95% confidence intervals (LCI and UCI), marginal pseudo-R2(Rm) and conditional pseudo-R2(Rc) for basal area increment (mm2yr-1) and relative tree growth (% yr-1) models performed with all data and mature stage data. Variables acronyms:TA, tree age (No. years);MAT, mean annual temperature (°C);PP, annual precipitation (mm).
temperature indicated that at high mean annual temperature both absolute and relative tree growth responses are suppressed along the entire tree age gradient (seeFig5A and 5B). The re-duction of absolute tree growth caused by increasing mean annual temperature was much higher in old trees (i.e. reductions in absolute tree growth along increased temperature were greater for old than young trees,Fig 5A), but in relative tree growth variation along ture was greater in young trees (i.e. reductions in relative tree growth with increased tempera-ture were greater for young than old trees,Fig 5B).
Regarding annual precipitation effects on tree growth, although its effect was lower than the one observed for mean annual temperature, we observed a positive linear relationship with an-nual precipitation for absolute tree growth in all forest types (seeFig4E and 4F). However, for
Fig 4. Predicted basal area increment and relative tree growth along against age, temperature and precipitation.Predicted tree basal area increment (m2yr-1) and relative tree growth (% yr-1) for all data and mature stage data in relation to: ((a) and (b), respectively) tree age (No. years), ((c) and (d), respectively) mean annual temperature (°C), and ((e) and (f), respectively) annual precipitation (mm).
relative tree growth there was no variation in growth responses with annual precipitation, ex-cept for small trees in models parameterized with all developmental stages, where higher growth responses were observed at low annual precipitation levels (Fig 5C).
Fig 5. Interactive effects of tree age and climate on basal area increment and relative tree growth. Predicted (a) basal area increment (m2yr-1) and (b) relative tree growth (% yr-1) along tree age (No. years) and mean annual temperature (°C); and (c) relative tree growth along tree age (No. years) and mean annual precipitation (mm) in models parameterised using data from all developmental stages.
Discussion
Tree age was the most important factor determining absolute and relative tree growth, but this relationship was not significant in mature stand development stages, confirming that stand de-velopment and stand structure play a crucial role driving the sign and magnitude of age-related responses (e.g. [8,50]). Mean annual temperature was more important than annual precipita-tion shaping both absolute and relative tree growth. Increased temperature caused a sharp de-crease in tree growth and age-related relationships were neutral at high mean annual
temperature levels. Furthermore, under increased temperature, young trees were the most sen-sitive in relative growth terms, but old trees were the most sensen-sitive in absolute growth terms. These patterns suggest that a warming climate is likely to cause a strong reduction of growth in subtropicalPinus taiwanensisstands at high temperatures (e.g. lowland forests), potentially al-tering future carbon storage due to reduced absolute growth of large trees and constraining rel-ative growth of young trees.
Effects of Stand Development on Age-Related Growth Responses
Our results demonstrate that absolute tree growth increases and relative tree growth decreases with tree age up to 80 years during stand development (seeFig 4A). The positive effect of tree age on absolute growth agrees with recent evidence found worldwide [7]. Positive tree growth with stand age and/or size have been related to tree physiological adjustments as stand develops as more efficient leaf organization and increased leaf packing within the crown (i.e. old trees tend to maximize the light captured, [20]). Therefore, increases in total leaf area may compen-sate reductions in photosynthetic or growth efficiency, suggesting that carbon limitation is not leading to age-related growth decline [18], although the negative effect of nutrient and water supply on tree growth is more controversial (see [15,51]).
Despite the increased absolute growth with tree size observed as stands develop; the rela-tionship became not significant and slightly negative at mature stages (seeFig 4Band parame-ters inTable 3). During stand development there are changes in stand structure (e.g. vegetation height, tree density, evenness) that determine nutrient and light availability [52,53]. Therefore, the sign and magnitude of age-related growth responses at the individual level may change dur-ing stand development dependdur-ing on the competitive environment [8,22]. However, the slight decline of growth found with tree age is consistent with recent evidence that suggests more neutral relationships with tree age due to physiological and structural adjustments at the tree level [20,50] that may be compensated by a greater likelihood of cavitation in the xylem of large trees (i.e. hydraulic failure, see [15]). Our results bring further evidence to unify the con-troversial patterns of growth at the tree level, because models parameterized at mature stages may have relatively similar stand structure conditions (e.g. medium to high stand density and heterogeneity) where productivity declines with age have been largely observed [cf.7,13].
Effects of Climate on Tree Growth Responses
processes [57]. There is an intense debate regarding whether increased carbon fertilization can offset reduced productivity due to increased temperatures in tropical forests [58]. However, there is increasing evidence that higher temperatures can exceed the temperature threshold for photosynthesis and cause reductions in CO2assimilation and growth in tropical and subtropi-cal forests (e.g. [59]).
The largest growth declines with mean annual temperature occurred in mature stage forests (seeFig4C and 4D), suggesting that areas where mean annual temperature is the highest (e.g. lowland forests) and canopies are particularly dense could suffer particularly reduced growth. Other authors have already observed that growth responses with temperature are also depen-dent on stand structural conditions [50], because high competition is a key driver determining tree growth patterns (e.g. [24]).Pinus taiwanensisis able to colonise even under extreme cli-matic conditions and plays a crucial role in stabilising slopes after landslides in this typhoon prone region [39]. However, if climate continues to warm (a net mean temperature increment ofc. 1°C from 1960 to 2010 is observed inFig 2C), our results indicate that it may cause strong-ly reduced tree growth ofP.taiwanensisforests.
Annual precipitation had a positive effect on absolute tree growth, suggesting that incre-ments in water availability can lead to growth pulses (see Figs1and3). The lower importance of annual precipitation than temperature determining tree growth agrees with previous sugges-tions regarding the relatively low correlation between productivity and rainfall in tropical for-ests [60]. However, although we found that annual precipitation had a relatively low
importance, temporal changes in rainfall patterns can result in absolute tree growth increments (seeFig 2BandFig4E and 4F). Relative tree growth was higher at low values of annual precipi-tation in young trees, which can be due to the fact that high precipiprecipi-tation levels can cause an-aerobic soil conditions or increase nutrient limitation in tropical forests, and thus, reduce growth [61].
Interactive Effects between Climate and Age on Growth
We observed strong interactions between mean annual temperature and tree age, which sug-gest that reductions of absolute tree growth under increased temperature disproportionally af-fect old trees (Fig 5A) whereas young trees were more sensitive in terms of relative tree growth (Fig 5B). On the one hand, our results suggest that large and old trees are able to store large amounts of biomass [7], but old trees may have particularly reduced growth under climate warming [9] as observed in the steep drop in absolute tree growth with increased mean annual temperature. This result agrees with previous studies, which found a higher sensitivity of abso-lute tree growth to climate in old trees and hypothesized that there is an increased probability of hydraulic failure in large individuals (e.g. [31,62]). On the other hand, the larger sensitivity of relative tree growth to increased temperature in young trees agrees point out that these early stages can be particularly impacted by rising temperatures. Other authors have also found a higher sensitivity of young trees for relative tree growth, and this result has been related to a more conservative use of water (e.g. [8,10]). Overall, our results suggest that growth in old trees may be more resilient to climate warming than for young trees, but small changes in growth can cause steep drops in absolute tree growth under increased temperature.
Conclusions
development stages and therefore they may change depending on the competitive environ-ment, stand heterogeneity, nutrient availability and species composition [8,50].
Overall, the strong negative effect of climate warming on individual tree growth suggests that these forests are highly vulnerable to increased temperature. Rising temperatures due to climate change have been already identified as critical for determining altitudinal species range shifts in tropical forests [30,63]. Furthermore, we found that growth reductions have the po-tential to disproportionately affect warm areas and mature stands. Therefore, it is critical to un-derstand the impact of potential growth reductions throughout the range ofP.taiwanensis since it may negatively impact on the essential ecosystem services that this species provides [39]. Any growth reduction occurring as a consequence of climate warming is also likely to lead to altitudinal changes of species distributions and competitive ability, thereby impacting community structure and diversity below the treeline, as has been witnessed for plant species at higher altitudes in this region [64].
Our results agree with recent suggestions of the importance of large trees for absolute tree growth and, therefore, on the carbon cycle [7,10]. Absolute growth increments may be reduced under increased temperature, which might compromise the role of forests as a future carbon sink under climate change scenarios. Furthermore, young trees were highly sensitive in relative growth terms to temperature increases, suggesting that early establishment stages may consti-tute a bottleneck for persistence as the climate warms.
Supporting Information
S1 Fig. Box-whisker plots of stand basal area increment and relative tree growth with pre-dictor variables in models developed using all data.((a) and (b), respectively) tree age (No. years), ((c) and (d), respectively) mean annual temperature (°C) and ((e) and (f), respectively) annual precipitation (mm).
(DOCX)
S2 Fig. Box-whisker plots of stand basal area increment and relative tree growth with pre-dictor variables in mature stages.((a) and (b), respectively) tree age (No. years), ((c) and (d), respectively) mean annual temperature (°C) and ((e) and (f), respectively) annual precipitation (mm).
(DOCX)
S3 Fig. Residuals of basal area increment models.Scatterplot of residual versus predicted log of basal area increment and histogram of the residuals residual for the final models using all data ((a) and (b), respectively) and using data corresponding to mature stages ((c) and (d), re-spectively).
(DOCX)
S4 Fig. Residuals of relative tree growth models.Scatterplot of residual versus predicted log of relative tree growth (% yr-1) and histogram of the residuals residual for the final models using all data ((a) and (b), respectively) and using data corresponding to mature stages ((c) and (d), respectively).
(DOCX)
S1 Table. Selected studies of age- and size- dependent growth responses reported at the in-dividual tree level.
(DOCX)
and shrubs in each site. (DOCX)
S3 Table. Summary statistics of ring width index chronologies ofPinus taiwanensisfor the common interval 1975–2009.
(DOCX)
S4 Table. Comparison of basal area increment and relative tree growth models parameter-ized using Akaike Information Criterion (AIC).The models were parameterized using one predictor variable (i.e. tree age, mean annual temperature or annual precipitation) and different functional forms (i.e. linear or quadratic).
(DOCX)
S5 Table. Comparison of alternative basal area increment models and relative tree growth models.We tested seven candidate models without interactions and three models that include all possible pair-wise interactions between tree age and climatic variables using Akaike Infor-mation Criterion (AIC).
(DOCX)
Acknowledgments
We thank Jonathan S. Lefcheck for posting a script to calculate R2following [48] in R using mixed-effects models (http://jonlefcheck.net).
Author Contributions
Conceived and designed the experiments: ASJ. Performed the experiments: ASJ TJH. Analyzed the data: PRB SY PM LC. Wrote the paper: PRB ASJ JMG. Analysed the samples: SY PM LC. Performed the statistical analysis and interpreted the data: PRB ASJ JMG. Contributed to sub-sequent drafts: PRB ASJ JMG SY PM LC TJH JCC.
References
1. Pan Y, Birdsey RA, Fang J, Houghton R, Kauppi PE, Kurz WA, et al. A large and persistent carbon sink in the world's forests. Science. 2011; 333(6045):988–93. doi:10.1126/science.1201609PMID: 21764754
2. Gamfeldt L, Snall T, Bagchi R, Jonsson M, Gustafsson L, Kjellander P, et al. Higher levels of multiple ecosystem services are found in forests with more tree species. Nature Communications. 2013; 4:1340. doi:10.1038/ncomms2328PMID:23299890
3. Ciais P, Schelhaas MJ, Zaehle S, Piao SL, Cescatti A, Liski J, et al. Carbon accumulation in European forests. Nature Geosciences. 2008; 1:425–9.
4. Fang J, Kato T, Guo Z, Yang Y, Hu H, Shen H, et al. Evidence for environmentally enhanced forest growth. Proc Natl Acad Sci U S A. 2014; 111:9527–32. doi:10.1073/pnas.1402333111PMID: 24979781
5. Nabuurs G-J, Lindner M, Verkerk PJ, Gunia K, Deda P, Michalak R, et al. First signs of carbon sink sat-uration in European forest biomass. Nat Clim Change. 2013; 3(9):792–6.
6. Penuelas J, Hunt JM, Ogaya R, Jump AS. Twentieth century changes of tree-ringδ13C at the southern range-edge ofFagus sylvatica: increasing water-use efficiency does not avoid the growth decline
in-duced by warming at low altitudes. Global Change Biol. 2008; 14(5):1076–88.
7. Stephenson NL, Das AJ, Condit R, Russo SE, Baker PJ, Beckman NG, et al. Rate of tree carbon accu-mulation increases continuously with tree size. Nature. 2014; 507:90–3. doi:10.1038/nature12914
PMID:24429523
9. Prior LD, Bowman DMJS. Big eucalypts grow more slowly in a warm climate: evidence of an interaction between tree size and temperature. Global Change Biol. 2014; 20(9):2793–9. doi:10.1111/gcb.12540
PMID:24469908
10. Voelker SL. Age-dependent changes in environmental influences on tree growth and their implications for forest responses to climate change. In: Meinzer FC, Lachenbruch B, Dawson TE, editors. Size- and age-related changes in tree structure and function. Dordrecht: Springer Science+Business Media B. V.; 2011. pp. 455–79.
11. Ryan MG, Binkley D, Fownes J. Age-related decline in forest productivity: pattern and process. Adv Ecol Res. 1997; 27:213–62.
12. Odum EP. The strategy of ecosystem development. Science. 1969; 164(3877):262–70. PMID: 5776636
13. Ryan MG, Binkley D, Fownes JH, Giardina CP, Senock RS. An experimental test of the causes of forest growth decline with stand age. Ecol Monogr. 2004; 74(3):393–414.
14. Gower ST, McMurtrie RE, Murty D. Aboveground net primary production decline with stand age: Poten-tial causes. Trends Ecol Evol. 1996; 11(9):378–82. PMID:21237883
15. Mencuccini M, Martínez-Vilalta J, Vanderklein D, Hamid HA, Korakaki E, Lee S, et al. Size-mediated ageing reduces vigour in trees. Ecol Lett. 2005; 8(11):1183–90. doi:10.1111/j.1461-0248.2005.00819. xPMID:21352442
16. Xu C, Turnbull MH, Tissue DT, Lewis JD, Carson R, Schuster WSF, et al. Age-related decline of stand biomass accumulation is primarily due to mortality and not to reduction in NPP associated with individu-al tree physiology, tree growth or stand structure in aQuercus-dominated forest. J Ecol. 2012; 100 (2):428–40.
17. Caspersen JP, Vanderwel MC, Cole WG, Purves DW. How stand productivity results from size- and competition-dependent growth and mortality. PloS ONE. 2011; 6(12):e28660. doi:10.1371/journal. pone.0028660PMID:22174861
18. Piper FI, Fajardo A. No evidence of carbon limitation with tree age and height inNothofagus pumilio
under Mediterranean and temperate climate conditions. Ann Bot. 2011; 108(5):907–17. doi:10.1093/ aob/mcr195PMID:21852277
19. Sillett SC, Van Pelt R, Koch GW, Ambrose AR, Carroll AL, Antoine ME, et al. Increasing wood produc-tion through old age in tall trees. For Ecol Manage. 2010; 259(5):976–94.
20. Coomes DA, Holdaway RJ, Kobe RK, Lines ER, Allen RB. A general integrative framework for model-ling woody biomass production and carbon sequestration rates in forests. J Ecol. 2012; 100(1):42–64. 21. Weiner J, Thomas SC. The nature of tree growth and the“age-related decline in forest productivity”.
Oikos. 2001; 94(2):374–6.
22. Foster J, D'Amato A, Bradford J. Looking for age-related growth decline in natural forests: unexpected biomass patterns from tree rings and simulated mortality. Oecologia. 2014; 175(1):363–74. doi:10. 1007/s00442-014-2881-2PMID:24442595
23. Vayreda J, Martínez-Vilalta J, Gracia M, Retana J. Recent climate changes interact with stand structure and management to determine changes in tree carbon stocks in Spanish forests. Global Change Biol. 2012; 18(3):1028–41.
24. Gómez-Aparicio L, García-Valdés R, Ruiz-Benito P, Zavala MA. Disentangling the relative importance of climate, size and competition on tree growth in Iberian forests: implications for management under global change. Global Change Biol. 2011; 17(7):2400–14.
25. Niinemets Ü. Responses of forest trees to single and multiple environmental stresses from seedlings to mature plants: Past stress history, stress interactions, tolerance and acclimation. For Ecol Manage. 2010; 260(10):1623–39.
26. Rozendaal DMA, Zuidema P. Dendroecology in the tropics: a review. Trees. 2011; 25(1):3–16. 27. Babst F, Poulter B, Trouet V, Tan K, Neuwirth B, Wilson R, et al. Site- and species-specific responses
of forest growth to climate across the European continent. Global Ecol Biogeogr. 2013; 22:706–17. 28. Enquist BJ, Leffler AJ. Long-term tree ring chronologies from sympatric tropical dry-forest trees:
individ-ualistic responses to climatic variation. J Trop Ecol. 2001; 17(01):41–60.
29. Way DA, Oren R. Differential responses to changes in growth temperature between trees from different functional groups and biomes: a review and synthesis of data. Tree Physiology. 2010; 30(6):669–88. doi:10.1093/treephys/tpq015PMID:20368338
30. Corlett RT. Impacts of warming on tropical lowland rainforests. Trends Ecol Evol. 2011; 26(11):606–13. doi:10.1016/j.tree.2011.06.015PMID:21803440
32. Vieira J, Campelo F, Nabais C. Age-dependent responses of tree-ring growth and intra-annual density fluctuations ofPinus pinasterto Mediterranean climate. Trees-Struct Funct. 2009; 23(2):257–65.
33. Esper J, Niederer R, Bebi P, Frank D. Climate signal age effects—Evidence from young and old trees in the Swiss Engadin. For Ecol Manage. 2008; 255(11):3783–9.
34. Speer JH. Fundamentals of tree ring research. Tucson: The University of Arizona Press; 2010. 35. Wright SJ. Tropical forests in a changing environment. Trends Ecol Evol. 2005; 20(10):553–60. PMID:
16701434
36. Zuidema PA, Baker PJ, Groenendijk P, Schippers P, van der Sleen P, Vlam M, et al. Tropical forests and global change: filling knowledge gaps. Trends Plant Sci. 2013; 18(8):413–9. doi:10.1016/j.tplants. 2013.05.006PMID:23809291
37. Carrer M. Individualistic and time-varying tree-ring growth to climate sensitivity. PLoS ONE. 2011; 6(7): e22813. doi:10.1371/journal.pone.0022813PMID:21829523
38. Rozas V. Individual-based approach as a useful tool to disentangle the relative importance of tree age, size and inter-tree competition in dendroclimatic studies. iForest. 2015; 8:187–94.
39. Huang T. Flora of Taiwan. 2nd ed. Taipei, Taiwan: Department of Botany, National Taiwan Univiver-sity; 2002.
40. Guan BT, Hsu H-W, Wey T-H, Tsao L-S. Modeling monthly mean temperatures for the mountain re-gions of Taiwan by generalized additive models. Agr Forest Meteorol. 2009; 149(2):281–90.
41. Larsson L-A. CooRecorder: image co-ordinate recording program. Sweden: Cybis Elektronik & Data AB; 2003.
42. Holmes RL. Computer-assisted quality control in tree-ring dating and measurement. Tree Ring Bull. 1983; 43:69–78.
43. Bunn AG. Statistical and visual crossdating in R using the dplR library. Dendrochronologia. 2010; 28 (4):251–8. doi:10.1007/s11604-009-0414-4PMID:20512541
44. R Core Team. R: A language and environment for statistical computing. Vienna: R Foundation for Sta-tistical Computing; 2013. Available:http://www.R-project.org.
45. Paine CET, Marthews TR, Vogt DR, Purves D, Rees M, Hector A, et al. How to fit nonlinear plant growth models and calculate growth rates: an update for ecologists. Methods Ecol Evol. 2012; 3(2):245–56. 46. Zuur AF, Ieno EN, Walker NJ, Saveliev AA, Smith GM. Mixed effects models and extension in Ecology
with R. New York: Springer; 2009.
47. Burnham KP, Anderson DR. Model selection and multimodel inference: a practical information-theoret-ic approach. 2 ed. New York: Springer-Verlag; 2002.
48. Nakagawa S, Schielzeth H. A general and simple method for obtaining R2from generalized linear mixed-effects models. Methods Ecol Evol. 2013; 4(2):133–42.
49. Bates D, Maechler M, Bolker B. lme4: Linear mixed-effects models using Eigen and S4. R package ver-sion 1.0–5. 2013. Available:http://CRAN.R-project.org/package = lme4. Accessed 17 October 2013. 50. Coomes D, Flores O, Holdaway R, Jucker T, Lines ER, Vanderwel MC. Wood production response to
climate change will depend critically on forest composition and structure. Global Change Biol. 2014; 20 (12):3632–45. doi:10.1111/gcb.12622PMID:24771558
51. Drake JE, Raetz LM, Davis SC, DeLucia EH. Hydraulic limitation not declining nitrogen availability causes the age-related photosynthetic decline in loblolly pine (Pinus taedaL.). Plant Cell Environ. 2010; 33(10):1756–66. doi:10.1111/j.1365-3040.2010.02180.xPMID:20545880
52. Binkley D. A hypothesis about the interaction of tree dominance and stand production through stand de-velopment. For Ecol Manage. 2004; 190(2–3):265–71.
53. Anten NPR, Selaya NG. Ecophysiology of secondary succession in tropical moist forest: scaling from individual traits to whole-plant performance. In: Meinzer FC, Lachenbruch B, Dawson TE, editors. Size-and age-related changes in tree structure Size-and function. Dordrecht: Springer Science+Business Media B.V.; 2011. pp. 429–54.
54. Clark DA, Piper SC, Keeling CD, Clark DB. Tropical rain forest tree growth and atmospheric carbon dy-namics linked to interannual temperature variation during 1984–2000. Proc Natl Acad Sci U S A. 2003; 100(10):5852–7. PMID:12719545
55. Feeley KJ, Wright SJ, Supardi MNN, Kassim AR, Davies SJ. Decelerating growth in tropical forest trees. Ecol Lett. 2007; 10(6):461–9. PMID:17498145
57. Lin Y-S, Medlyn BE, Ellsworth DS. Temperature responses of leaf net photosynthesis: the role of com-ponent processes. Tree Physiology. 2012; 32(2):219–31. doi:10.1093/treephys/tpr141PMID:
22278379
58. Lloyd J, Farquhar GD. Effects of rising temperatures and [CO2] on the physiology of tropical forest trees. Philosophical Transactions of the Royal Society B: Biological Sciences. 2008; 363(1498):1811–
7. doi:10.1098/rstb.2007.0032PMID:18267901
59. Doughty CE, Goulden ML. Are tropical forests near a high temperature threshold? Journal of Geophys-ical Research: Biogeosciences. 2008; 113(G1):G00B7.
60. Luyssaert S, Inglima I, Jung M, Richardson AD, Reichstein M, Papale D, et al. CO2balance of boreal, temperate, and tropical forests derived from a global database. Global Change Biol. 2007; 13 (12):2509–37.
61. Schuur E, Matson P. Net primary productivity and nutrient cycling across a mesic to wet precipitation gradient in Hawaiian montane forest. Oecologia. 2001; 128(3):431–42. doi:10.1007/s004420100671 PMID:24549913
62. Linares JC, Taïqui L, Sangüesa-Barreda G, Seco JI, Camarero JJ. Age-related drought sensitivity of Atlas cedar (Cedrus atlantica) in the Moroccan Middle Atlas forests. Dendrochronologia. 2013; 31 (2):88–96.
63. Colwell RK, Brehm G, Cardelús CL, Gilman AC, Longino JT. Global warming, elevational range shifts, and lowland biotic attrition in the wet tropics. Science. 2008; 322(5899):258–61. doi:10.1126/science. 1162547PMID:18845754
64. Jump AS, Huang T-J, Chou C-H. Rapid altitudinal migration of mountain plants in Taiwan and its impli-cations for high altitude biodiversity. Ecography. 2012; 35(3):204–10.
![Fig 1. Map of Pinus taiwanensis sites sampled in Taiwan. We included Pinus taiwanensis distribution [65]](https://thumb-eu.123doks.com/thumbv2/123dok_br/18399213.358481/4.918.292.821.105.751/pinus-taiwanensis-sampled-taiwan-included-pinus-taiwanensis-distribution.webp)