ACPD
8, 1291–1320, 2008March 2006 total solar eclipse effects
on ecosystems
G. Economou et al.
Title Page
Abstract Introduction
Conclusions References
Tables Figures
◭ ◮
◭ ◮
Back Close
Full Screen / Esc
Printer-friendly Version
Interactive Discussion
EGU
Atmos. Chem. Phys. Discuss., 8, 1291–1320, 2008 www.atmos-chem-phys-discuss.net/8/1291/2008/ © Author(s) 2008. This work is licensed
under a Creative Commons License.
Atmospheric Chemistry and Physics Discussions
Eclipse e
ff
ects on field crops and marine
zooplankton: the 29 March 2006 Total
Solar Eclipse
G. Economou1, E. D. Christou2, A. Giannakourou2, E. Gerasopoulos3, D. Georgopoulos3, V. Kotoulas1, D. Lyra1, N. Tsakalis1, M. Tziortzou4, P. Vahamidis1, E. Papathanassiou2, and A. Karamanos1
1
Laboratory of Agronomy, Faculty of Plant Production, Agricultural University of Athens, 75 Iera Odos Str., 11855 Athens, Greece
2
Institute of Oceanography, Hellenic Center for Marine Research, Greece
3
Institute for Environmental Research and Sustainable Development, National Observatory of Athens, Greece
4
NASA Goddard Space Flight Center – ESSIC/Univ. of Maryland Smithsonian Institution, SERC, USA
Received: 1 October 2007 – Accepted: 15 November 2007 – Published: 25 January 2008
ACPD
8, 1291–1320, 2008March 2006 total solar eclipse effects
on ecosystems
G. Economou et al.
Title Page
Abstract Introduction
Conclusions References
Tables Figures
◭ ◮
◭ ◮
Back Close
Full Screen / Esc
Printer-friendly Version
Interactive Discussion
EGU
Abstract
The effects in the biosphere from the Total Solar Eclipse of 29 March 2006 were
in-vestigated in field crops and marine zooplankton. Taking into account the decisive role of light on the photoenergetic and photoregulatory plant processes, measurements of photosynthesis and stomatal behaviour were conducted on seven important
field-5
grown cereal and leguminous crops. A drop in photosynthetic rates, by more than a fac-tor of 5 in some cases, was observed, and the minimum values of photosynthetic rates
ranged between 3.13 and 10.13µmol CO2m−
2
s−1. However, since solar irradiance
attenuation has not at the same time induced stomatal closure thus not blocking CO2
uptake by plants, it is probably other endogenous factors that has been responsible
10
for the observed fall in photosynthetic rates. Field studies addressing the migratory re-sponses of marine zooplankton (micro-zooplankton (ciliates), and meso-zooplankton) due to the rapid changes in underwater light intensity were also performed. The light in-tensity attenuation was simulated with the use of accurate underwater radiative transfer modeling techniques. Ciliates, responded to the rapid decrease in light intensity during
15
the eclipse adopting night-time behaviour. From the meso-zooplankton assemblage,
various vertical migratory behaviours were adopted by different species.
1 Introduction
On 29 March 2006, millions of people in the Northern Hemisphere had the opportunity to observe a total solar eclipse. In the Greek territory, the phenomenon had a maximum
20
duration of 2 min and 58 s, at the small island of Kastelorizo in the east-southern part of the country.
The effects of solar eclipses on the behaviour of living organisms have been the
subject of many observations. Plant behaviour was first studied by Deen and Bruner (1933) by following stomatal movements of the gray birch during the sun eclipse of
25
ACPD
8, 1291–1320, 2008March 2006 total solar eclipse effects
on ecosystems
G. Economou et al.
Title Page
Abstract Introduction
Conclusions References
Tables Figures
◭ ◮
◭ ◮
Back Close
Full Screen / Esc
Printer-friendly Version
Interactive Discussion
EGU
and insects during seven eclipses between 1954 and 1975 (Zirker, 1995). More recent data have shown that birds behave as they normally do at sunset (Tramer, 2000), animals alter their behaviour (Jennings et al., 1998) and some planktonic crustacea are vertically redistributed (Vecchione et al., 1986; Giroud and Balvay, 1999).
In general, eclipse effects on plants are expected to be related to the light
limita-5
tion experienced during the phenomenon. Although fluctuating light conditions are a common feature for natural habitats (e.g. through transitional light flecks in canopies, changing cloudiness, diurnal periods of light and dusk), the dynamics of the decline
of radiation during an eclipse typically differ (Schulze and Hall, 1982; Kuppers et al.,
1997). Moreover, observations have shown that a drop of sap flow in a number of plants
10
was related to solar eclipses (Ladefoged, 1963; Fernandez et al., 1996; Morecroft et al., 2000).
Developmental processes, such as transient aberrations in the chromosomal struc-ture of root meristems and a delaying seed germination, have been also ascribed to the impact of an eclipse (Sathalah et al., 1984; Kumar et al., 1984). In addition, limited
15
short-term effects on photosynthesis and evapotranspiration of crop plants, such as
pigeon pea and bread wheat, were reported by Singh et al. (1992). In mature forest
trees ofPicea abies,Fagus sylvaticaandQuercus robur photosynthesis was reduced
to an extent that allowed net CO2evolution from leaves during an eclipse (H ¨aberle et.
al., 2001).
20
The effects of solar eclipses on marine ecosystems have been partially studied.
Pepita (1955) reported an upward migration of free-swimming larvae of shrimps, clams, snails and barnacles, as well as of adult copepods during the period of maximum to-tality, in Sebastopol Bay. Skud (1967) observed a decrease in zooplankton volumes at surface waters in Maine, although he reported an upward migration of two copepod
25
species (Pseudocalanus minutusandAcartia longiremis), during the time of darkness.
euphausi-ACPD
8, 1291–1320, 2008March 2006 total solar eclipse effects
on ecosystems
G. Economou et al.
Title Page
Abstract Introduction
Conclusions References
Tables Figures
◭ ◮
◭ ◮
Back Close
Full Screen / Esc
Printer-friendly Version
Interactive Discussion
EGU
aceans (e.g. Nannocalanus minor, Scolecithrix danae and Undinula vulgaris) in the
Gulf of Mexico, responded to the noontime solar eclipse of March 1970 by migrating to the surface. Moreover, according to Bright et al. (1972), the response as reflected in the number of organisms captured at the surface, was larger than the respective response to a decrease in light intensity at night. Some studies of the movements of
5
scattering layers during solar eclipses showed that layers started ascending at the be-ginning of the eclipse (Backus et al., 1965; Tont and Wick, 1973; Kampa, 1975), while in other cases the scattering layers did not respond at all (Franceschini et al., 1970).
The diurnal vertical migration of many zooplankters is a well known behavior, with some of the organisms migrating several hundred meters in the water column
(Mar-10
shall and Orr, 1955; Longhurst, 1976). The factors controlling vertical migration in mesopelagic species, however, have not been intensively studied. It is generally ac-cepted that down-welling irradiance plays an important role (Banse, 1964; Ringelberg, 1995), since most vertical migrations of plancton occur at sunrise and sunset. Al-though, most of the above studies concern mesozooplankton there is lack of
informa-15
tion concerning other zooplankton organisms.
This study aims at investigating the effects of solar eclipses on field crops and marine
zooplankton in Greece, during the 29 March 2006 total solar eclipse. Since there is
no available evidence on the mechanisms involved in the effects of solar eclipses on
photosynthesis and stomatal behaviour, and taking also into account the decisive role
20
of light on the photoenergetic and photoregulatory plant processes, this has been an
excellent opportunity. A total solar eclipse, providing a sort of artificial night, offers
the possibility to study the migratory responses of marine organisms. Field studies
addressing this issue are scarce, primarily because of the difficulties associated with
measuring rapid changes in underwater light intensity, simultaneously with changes in
25
ACPD
8, 1291–1320, 2008March 2006 total solar eclipse effects
on ecosystems
G. Economou et al.
Title Page
Abstract Introduction
Conclusions References
Tables Figures
◭ ◮
◭ ◮
Back Close
Full Screen / Esc
Printer-friendly Version
Interactive Discussion
EGU
2 Materials and methods
2.1 Photosynthesis and stomatal conductance in field crops
2.1.1 Study site
The study was carried out in the experimental field of the Agricultural University of
Athens (37◦59′N, 23◦32′E), at an altitude of 30 m a.s.l. The site was located about
5
560 km from the central axis of the eclipse totality, with 84% sun obscuration. The crops have been growing in a slightly alkaline (pH 7.24) clay loam soil (35.9% sand,
35.9% silt and 29.8% clay) over an area of 400 m2.
2.1.2 Plant material
Seven important field-grown cereal and leguminous crops were studied. In particular,
10
the studied crops were: cereals [Triticum durum (durum wheat), Tr. aestivum (bread
wheat),Hordeum vulgare(barley), Avena sativa(oat)] and legumes [Lathyrus sativus
(grass pea),Pisum sativum(pea) andVicia faba(faba bean)]. During the eclipse case
study all cereals were at the booting stage and the legumes at flower appearance. The measurements were taken on the third leaf from the top for the cereals and on the
15
leaves at the middle of the stem for the legumes.
2.1.3 Measurements of photosynthesis and stomatal conductance
The chlorophyll fluorescence technique was used to measure the photosynthetic
activ-ity of leaves. Net photosynthesis (Pn) and stomatal conductance (gs) were measured
in the field using a closed portable Infra-Red Gas Analysis (IRGA, LI-COR, LI-6200
20
model) system. The top leaf was enclosed in a 4 litre chamber connected to the IRGA, and the instrument was moved from crop to crop for consecutive measurements within
less than one minute. Air flow rate into the IRGA system was 800µmole s−1.
ACPD
8, 1291–1320, 2008March 2006 total solar eclipse effects
on ecosystems
G. Economou et al.
Title Page
Abstract Introduction
Conclusions References
Tables Figures
◭ ◮
◭ ◮
Back Close
Full Screen / Esc
Printer-friendly Version
Interactive Discussion
EGU
chamber, was found to be 1700±150µmol photons m−2s−1. Pn and gs calculation
was based on the equations of Leuning and Sands (1989) and are expressed asµmol
CO2m−2
s−1
and mole m−2
s−1
, respectively. Hourly measurements were carried out during 6:00–17:00 UTC on 29 March 2006.
Additional meteorological and actinometric data monitored at Thission station
(Na-5
tional Observatory of Athens) were used in this study. Information about the station characteristics and infrastructure used can be found in Founda et al. (2007).
2.2 Marine zooplankton
2.2.1 Study site and hydrographic measurements
One oceanographic cruise on board the R/V AEGAIO was carried out on 29 March
10
2006, at a fixed station close to Kastelorizo Island in the Eastern Mediterranean
(36◦08′N, 29◦34′E). Downward surface global (200–850 nm) and direct (280–700 nm)
irradiance spectra were measured during 9:00–13:00 UTC at a sampling frequency of 20 s and 8 s, respectively, using two diode-array spectrometers (Kazadzis et al., 2007; Blumthaler et al., 2006).
15
The water column structure was sampled before, during, and after the eclipse, at approximately 1 h intervals, during an 8 h period (Table 1). Vertical profiles of temper-ature and salinity were measured with a Seabird CTD System (911 plus) assembly. Phytoplankton fluorescence (Chl-a) was recorded with a Chelsea in situ fluorometer. Water samples were taken in the euphotic 0–100 m layer, using Niskin bottles with
20
ACPD
8, 1291–1320, 2008March 2006 total solar eclipse effects
on ecosystems
G. Economou et al.
Title Page
Abstract Introduction
Conclusions References
Tables Figures
◭ ◮
◭ ◮
Back Close
Full Screen / Esc
Printer-friendly Version
Interactive Discussion
EGU
2.2.2 Zooplankton measurements
Five hundred ml micro-zooplankton samples were preserved with borax-buffered
for-malin (final concentration 2% formaldehyde) and stored at 4◦C in the dark. Before
examination, samples were left to settle in their bottles in the dark at 4◦C and after
48 h, the top 400 ml of the sample was slowly siphoned off. The bottom 100 ml of the
5
sample was transferred into sedimentation chambers, allowed to settle for 24 h (Uter-mohl, 1951) and was finally examined by means of an inverted microscope OLYMPUS IX 70.
Meso-zooplankton was sampled by vertical hauls of a WP-2 net (200µm mesh size).
Samples were fixed immediately after collection and preserved in a 4% borax buff
ered-10
formaldehyde seawater solution. In the laboratory the samples were split using a fol-som splitter. The first half was used to get information on the taxonomic level of order or species and counted under an OLYMPUS stereoscope.
2.2.3 Underwater radiative transfer modeling
Measured changes in above water light intensity and underwater composition during
15
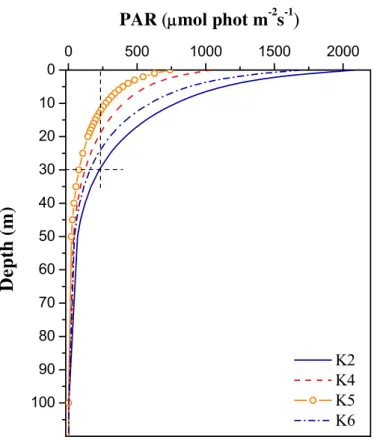
the solar eclipse, were used as input to the extensively validated Hydrolight Radiative Transfer Program (Mobley, 1988), to estimate changes in underwater radiation fields. In the absence of in situ underwater radiometric measurements, the model calculations allowed us to estimate the changes in light levels (e.g. PAR) at specific depths in the water column, where changes in micro- and meso-zooplankton concentrations were
20
observed during the solar eclipse event. Mobley (1994) has given a detailed description of the physical assumptions and mathematical calculations in the Hydrolight Model.
Tzortziou et al. (2006) recently reported very good agreement (differences less than
10%) between in situ measurements of water leaving radiance and Hydrolight results, over a wide range of conditions in the bio-optically complex estuarine waters of the
25
ACPD
8, 1291–1320, 2008March 2006 total solar eclipse effects
on ecosystems
G. Economou et al.
Title Page
Abstract Introduction
Conclusions References
Tables Figures
◭ ◮
◭ ◮
Back Close
Full Screen / Esc
Printer-friendly Version
Interactive Discussion
EGU
Measurements of downward surface irradiance spectra,Es(λ), and chl-a vertical
pro-files were used as inputs to perform the model calculations. The water was modeled by three components: pure water, pigmented particles and covarying colored dissolved organic matter (CDOM). We assumed that mineral concentrations were negligible in the very clear, oligotrophic waters at the Kastelorizo site.
5
The Pope and Fry (1997) absorption values for pure water and the seawater
scat-tering coefficients of Morel (1974) as retabulated by Smith and Baker (1981), were
used in our model simulations. Particle absorption at depth z and wavelength λ,
ap(z,λ), was estimated using the Morel (1991) model and the chlorophyll-specific
absorption coefficients given in Prieur and Sathyentranath (1981). Absorption by
10
CDOM,aCDOM(z,λ), was assumed to covary with particle absorption according to
aCDOM(z,λ)=0.2·ap(z,440)·exp[-0.014·(λ-440)] (Mobley and Sundman, 2000).
Particu-late scattering was estimated using the Gordon and Morel (1983) model, while CDOM was assumed to be non-scattering. Because measurements of particulate backscat-tering were not available, a backscatbackscat-tering fraction of 0.044 was used in our
calcula-15
tions based on previous studies for clear waters (e.g. Mobley, 1994; Stramski et al., 2004). Raman scattering and CDOM and chlorophyll-a fluorescence were included in
all model runs using the Hydrolight default assumptions for fluorescence efficiency and
wavelength redistribution functions for fluorescence by chlorophyll (Mobley, 1994) and CDOM (Hawes, 1992).
20
Water surface roughness was estimated assuming that the slope probability distribu-tion of the capillary waves follows the Cox and Munk (1954) wind-direcdistribu-tion independent
distribution. A wind speed of 5 m s−1 was used in the simulations based on local
me-teorological observations. The water column was assumed to be infinitely deep below the greatest depth of interest (ca. 250 m). Model results included underwater vertical
25
profiles of photosynthetically active radiation, PAR (in µmol phot m−2 s−1), estimated
according to Mobley (1994) from underwater scalar irradiance, Eo(z,λ), and integrated
ACPD
8, 1291–1320, 2008March 2006 total solar eclipse effects
on ecosystems
G. Economou et al.
Title Page
Abstract Introduction
Conclusions References
Tables Figures
◭ ◮
◭ ◮
Back Close
Full Screen / Esc
Printer-friendly Version
Interactive Discussion
EGU
3 Results and discussion
3.1 The effect of the solar eclipse on photosynthesis and stomatal conductance
On 29 March 2006, the eclipse effects on the biosphere and on various atmospheric
layers have been investigated during a combined field experiment over Greece. Infor-mation about the experimental campaigns, the measurement sites, eclipse path maps
5
and eclipse local circumstances at each location, can be found in the overview paper by Gerasopoulos et al. (2007).
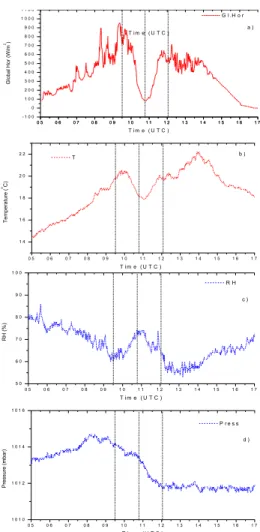
The diurnal course of meteorological parameters during 29 March 2006 is shown in
Fig. 1. Solar global irradiance (Fig. 1a) displayed a sharp decline of 796 W m−2during
the eclipse, in comparison with the pre-eclipse maximum. A decline was also exhibited
10
in air temperature (2.2◦C, Fig. 1b) and atmospheric pressure (0.7 hPa, Fig. 1d). On the
other hand, relative humidity increased by about 10% (Fig. 1c). The combination of light
“switch off” and increased humidity, together with the decreased temperature during
eclipses has been previously shown to have an impact on forest trees (e.g. Steppe et al, 2002).
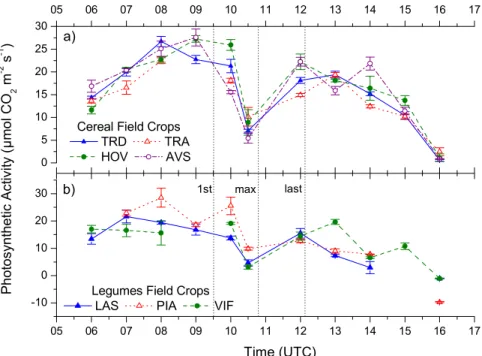
15
Figure 2 illustrates the diurnal course of photosynthetic rate for the cereals and legumes examined. A drop in photosynthetic rates, by more than a factor of 5 in some cases, was observed as a response to the variation in PAR during the eclipse. The minimum values of observed photosynthetic rates ranged between 3.13 (faba beans)
and 10.13µmol CO2m−
2
s−1 (bread wheat). The relative reduction of photosynthesis
20
during the eclipse varied among the different species (Table 2, Fig. 2). Faba beans,
oats and grass pea were the most intensely affected, in contrast to whereas bread
wheat, pea, barley and durum wheat. In general, cereals were less influenced than legumes; with min/max ratios on average 0.31 and 0.24, respectively.
Given that the minimum irradiance during the eclipse was equivalent to that recorded
25
at 16:00 UTC (about 62 W m−2), it is not surprising that the rates of photosynthesis
at totality were roughly similar to those observed at 16:00 UTC. Thus, the effects of
ACPD
8, 1291–1320, 2008March 2006 total solar eclipse effects
on ecosystems
G. Economou et al.
Title Page
Abstract Introduction
Conclusions References
Tables Figures
◭ ◮
◭ ◮
Back Close
Full Screen / Esc
Printer-friendly Version
Interactive Discussion
EGU
Matyssek (1986) and H ¨aberle et al. (2001).
One-way ANOVA was applied, on three replicates for each plant, in order to test the
statistical significance of the variance in stomatal conductance (gs). Table 3 shows
the diurnal changes of gs for the examined species. In all species except pea, gs
showed a decline at 10:00 UTC and at earlier eclipse stages, occasionally significant
5
(e.g. in bread wheat, oats, and faba beans) in comparison with the preceding values. At
10:30 UTC however a time near the totality,gs returned to values before the beginning
of the eclipse, maintained throughout the rest of the day. Thus, the drop in gs at
10:00 UTC is probably not eclipse induced and an additional important argument is
that the timings of minimumgs and minimum photosynthetic rate do not coincide.
10
From the above it is evidenced that the diurnal course of gs followed the typical
pattern expected for mesophytic crop species: higher values early in the day 6:00– 7:00 UTC, steadily declining within the next two-three hours and remaining stable
there-after. It is also known that morning values ofgs are higher than those observed in the
afternoon for similar PAR (Rochette et al., 1991). A midday temporary decrease ings
15
is also a common phenomenon in dry environments, like the one of southern Greece.
Accordingly, the drop in gs observed at 10:00 UTC simply reflects normal, “midday
stomatal closure” (Miller, 1938; Meidner and Mansfield, 1968).
Stomatal movements are greatly affected by environmental conditions. Light is
re-ported to be amongst the most important factors determining the course of stomatal
20
behaviour (Meidner and Memsfield, 1968), although many interactions with other
en-vironmental (e.g. CO2–concentration, vapour pressure deficit, temperature, etc.) and
plant factors (plant water status, endogenous rhythms) exist to a considerable extent. It is obvious from our results that the solar eclipse has influenced photosynthesis (Fig. 2)
but on the other hand it was not an important factor directly affecting the course ofgs
25
(Table 3). Consequently, since solar irradiance attenuation has not induced stomatal
closure thus not blocking CO2 uptake by plants, it is probably other endogenous
ACPD
8, 1291–1320, 2008March 2006 total solar eclipse effects
on ecosystems
G. Economou et al.
Title Page
Abstract Introduction
Conclusions References
Tables Figures
◭ ◮
◭ ◮
Back Close
Full Screen / Esc
Printer-friendly Version
Interactive Discussion
EGU
Photosynthesis is inherently dependent on light. The three functions of the light har-vesting apparatus (light capturing, energy transfer and electron transfer) are controlled by the physical and chemical characteristics of the plant pigments. Absence of light dis-rupts electron transport, leading to a decline of photosynthesis (Schreiber et al., 1995). This sequence of events also occurs during a solar eclipse which, to some extent,
re-5
sembles the daily down and dusk periods with their gradual changes in PAR. However, in contrast with normal diurnal courses, the time span of the decline in PAR and its sub-sequent recovery during a total solar eclipse last for only a few minutes each, which is much shorter than the duration of dawn and dusk in the temperate climates.
3.2 The effect of eclipse on marine zooplankton
10
The solar eclipse induced effects on ecosystems has been additionally investigated in
the marine environment. These effects are mainly driven by the change of
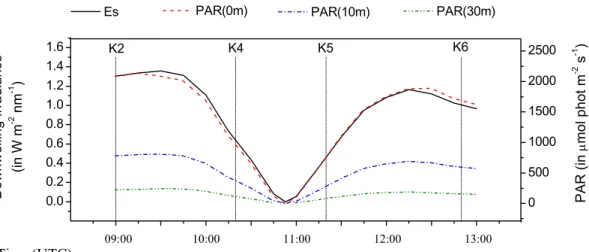
underwa-ter irradiance that has been simulated via the Hydrolight Radiative Transfer Program for the case of Kastelorizo. Figure 3 shows the change with time in downward
irradi-ance as measured above the water surface,Es, during the eclipse event. Light
inten-15
sity dropped dramatically with the onset of the eclipse, withEs at 550 nm decreasing
from ∼1.35 W m−2nm−1 at 9:35 UTC (1st contact) to below the range of the
instru-ment’s sensitivity during totality 10:53 UTC, increasing again to∼1.16 W m−2nm−1 at
12:10 UTC (last contact). Model estimated photosynthetically active radiation (PAR)
just below the water surface was∼2000µmol phot m−2s−1just before the 1st contact,
20
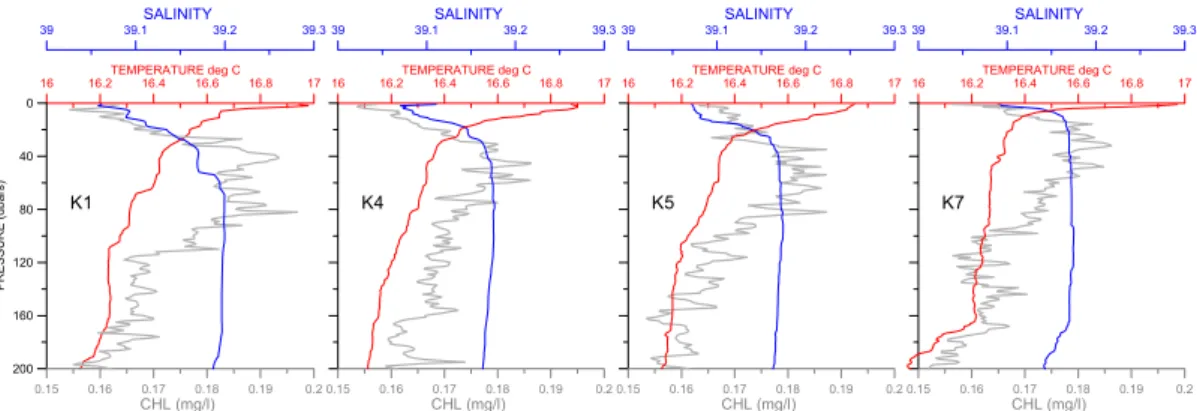
while the evolution of PAR at more depths (10 and 30 m) is also shown in Fig. 3. The water column structure at the sampled station before, during and after the
eclipse is described in Fig. 4. Temperature and salinity ranged from 16.2 to 17◦C and
from 39 to 39.2 psu, respectively, in the upper 200 m. Due to spring warming, the sur-face layer (from the sursur-face down to 20–30 m) is warmer and saltier than the underlying
25
ACPD
8, 1291–1320, 2008March 2006 total solar eclipse effects
on ecosystems
G. Economou et al.
Title Page
Abstract Introduction
Conclusions References
Tables Figures
◭ ◮
◭ ◮
Back Close
Full Screen / Esc
Printer-friendly Version
Interactive Discussion
EGU
remained almost constant during the eclipse event. Chl-a concentration varied from
0.14 to 0.19µg l−1, with a small chlorophyll maximum between 40 and 60 m. No
signif-icant changes in chl-a vertical distribution were observed during the eclipse event.
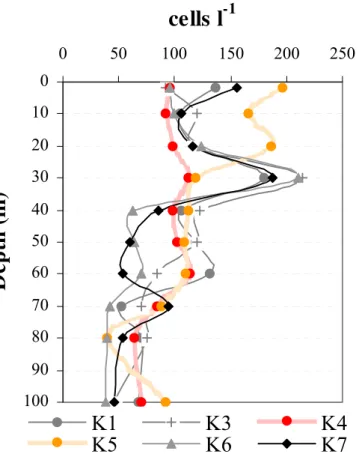
Ciliates
The ciliate community included members of the orders Choreotrichida (Strobilidium
5
spp, Lohmaniella spp), Tintinnida, Oligotrichida (Strombidium spp, Tontonia spp and
Laboeaspp). Cell numbers were dominated by small oligotrichs 20-30µm (35-75%).
From the vertical abundance profiles (Fig. 5, K1 and K3) it was clear that before the eclipse ciliates showed a non-random distribution and tended to accumulate at 30 m
depth, where they showed a distinct peak in cell numbers (up to 212 cells l−1). At this
10
depth, PAR was∼11% of its surface value (cast K2 in Fig. 6).
However, at 10:20 UTC (cast K4), one hour after the 1st contact and 30 min before totality, we observed a vertical homogenous spreading of the ciliates in the water
col-umn. At this time, surface PAR had already decreased by∼50%. It seemed like ciliates
responded to the rapid decrease in light intensity during the eclipse, adopting a
night-15
time behavior. At 11:20 UTC (cast K5), almost 30 min after totality, when surface PAR
was∼35% of its initial value before the eclipse, ciliates were found in greater numbers
within the first 20 m from the surface. Two hours after totality (cast K6 at 12:50 UTC), the notable peak at 30 m was re-established.
Ciliate diel cycles have been surprisingly little studied before. Jonsson (1989)
re-20
ported that ciliates often accumulate around the pycnocline, mainly due to the effect
of negative geotaxis. Chemokinetic and photokinetic responses have been shown to influence the vertical distributions in some ciliates in lake environments (Finlay et al., 1987). Interactions between sinking velocity, swimming velocity, tumbling rate and shape or density asymmetry of the cell have also been suggested to explain the
ver-25
ACPD
8, 1291–1320, 2008March 2006 total solar eclipse effects
on ecosystems
G. Economou et al.
Title Page
Abstract Introduction
Conclusions References
Tables Figures
◭ ◮
◭ ◮
Back Close
Full Screen / Esc
Printer-friendly Version
Interactive Discussion
EGU
be governed by other factors, such as predation. Ciliates could move downwards in order to avoid predation pressure from zooplankton, accumulated near the surface lay-ers at night. Perez and Dolan (1995) found in a study at the Western Mediterranean sea, that chlorophyll containing ciliates were mainly concentrated at the chl-a maxi-mum depth, however heterotrophic ciliates often migrated from 20–30 m depth during
5
the day to the surface at night or in the early morning. Measurements by Stoecker et al. (1989) across Georges Bank (Northwest Atlantic), revealed that oligotrichous cili-ates with chloroplasts were usually located in the upper half of the euphotic zone during
the day, showing diel changes in their distribution pattern. For example,Laboea
stro-bila was concentrated near the surface just before sunrise and early in the morning,
10
but had a subsurface maximum at noon.
Mesozooplankton
The mesozooplankton assemblage was made up 39–74% by copepods, showing an
in-creasing relative abundance with depth. Copepodites ofClausocalanus,Paracalanus,
OithonaandCtenocalanusdominated the copepod assemblage (up to 40, 42, 19 and
15
15% respectively). Less important wereClausocalanus paululus,Ctenocalanus vanus,
Oithona plumifera and Oncea media (up to 8–10%). The non-copepod zooplankton
made a significant contribution to the total abundance represented, by 5 taxa: Appen-dicullaria, Doliolidae, Chaetognatha, Medusae and Pteropoda.
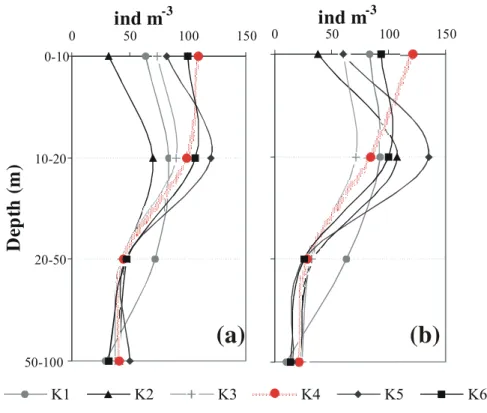
Figure 7 shows the results of copepod vertical distribution at the surface down to
20
100 m. Copepods exhibited the greatest density between 10–20 m depth. At K4
10:20 UTC when surface PAR was ∼50% (Fig. 6) of that before the eclipse,
cope-pods showed higher abundance close to the surface which can be explained by a
possible migrating behaviour. CalanusandClausocalanuscopepodites seemed to be
synchronized with the exogenous changes of light due to the eclipse. Individuals of
25
these species showed a vertical migratory movement towards the surface. Among
the other copepodites, Paracalanus mainly localized at 0-10m increased their
ACPD
8, 1291–1320, 2008March 2006 total solar eclipse effects
on ecosystems
G. Economou et al.
Title Page
Abstract Introduction
Conclusions References
Tables Figures
◭ ◮
◭ ◮
Back Close
Full Screen / Esc
Printer-friendly Version
Interactive Discussion
EGU
tows appeared in greater abundance in the 0–10 m layer, as well asOncea media
con-centration increased at the surface layers. The other copepodites, male and female
copepods displayed no significant differences in distribution and apparent response to
the eclipse.
Similarly, the other zooplankton taxa were distributed high in the water column (10–
5
20 m), whereas the fall of light intensity resulted in a migration upwards to the surface
It seems that appendicullaria(Oikopleura dioica), meduses and doliolids responded to
light changes and did move up in the water column towards the surface. Pteropods that maintained themselves mainly at 0-10m increased their abundance before totality, while chaetognaths did not respond to light changes during the eclipse.
10
Avoidance of light by zooplankton has been demonstrated by many studies with a re-marked preference for the surface layers during dawn and dusk (Conover et al., 1988;
Hays et al., 1974). Earlier reports forPseudocalanusandCalanusspecies (Runge and
Ingram, 1991; Hattori and Saito, 1997), showed that medium to large calanoids exhib-ited a normal diel vertical migration moving upward into the surface layer sometime
15
between 19:00 h and midnight. Calanus is a fast swimmer moving in short bursts of
about 15–66 m/h (Marshall and Orr 1955). In a study of the diurnal vertical movements of chaetognaths and appendicularia, Schmidt (1973) reported that these animal groups during daytime avoid the upper layers, although around sunset and sunrise they tend to accumulate above 25 m. Consistent with our results are Sherman and Honey (1972)
20
data, reporting that chaetognaths showed little change in vertical distribution during the eclipse. However the strong responses reported by Pepita (1955) for chaetognaths
and decapod larvae differed from our results, probably due to species composition of
the zooplankton.
4 Summary and conclusions
25
The solar eclipse of 29 March 2006 had very important effects on ecosystems, both
ACPD
8, 1291–1320, 2008March 2006 total solar eclipse effects
on ecosystems
G. Economou et al.
Title Page
Abstract Introduction
Conclusions References
Tables Figures
◭ ◮
◭ ◮
Back Close
Full Screen / Esc
Printer-friendly Version
Interactive Discussion
EGU
experiment.
The diurnal course of photosynthetic rate for the seven important field-grown cereal and leguminous crops studied here, indicated a dramatic drop during the total phase of the eclipse. The minimum values of observed photosynthetic rates varied among the
different species and ranged between 3.13 (faba beans) and 10.13µmol CO2m−2s−1
5
(bread wheat). Cereals were less influenced than legumes and in particular faba
beans, oats and grass pea were the most intensely affected. The latter may enable
their use as potential indices for future investigation of the effects of climate changes
on field crops.
The instantaneous changes observed in the diurnal cycle of stomatal conductance
10
(gs) for the examined species could not be attributed to solar eclipse. Thus, since solar
irradiance attenuation has not at the same time induced stomatal closure, thus not
blocking CO2uptake by plants, it is probably other endogenous factors that has been
responsible for the observed fall in photosynthetic rates. This should be taken under serious consideration for planning of future solar eclipse related experiments.
15
The solar eclipse induced effects on the marine environment were mainly driven
by the change of underwater irradiance. Model estimated photosynthetically active
radiation (PAR) just below the water surface was∼2000µmol phot m−2s−1 just before
the 1st contact. Temperature and salinity remained almost constant during the eclipse
event. Chl-a concentration varied from 0.14 to 0.19µg l−1. No significant changes in
20
chl-a vertical distribution were observed during the eclipse event.
The behavior of marine populations has been investigated, separately for micro-zooplankton (ciliates) and meso-micro-zooplankton. Ciliates, tending to accumulate at 30 m depth, responded to the rapid decrease in light intensity during the eclipse and adopt-ing night-time behaviour showed a vertical homogenous spreadadopt-ing in the water column.
25
At this time, surface PAR had already decreased by∼50%. From the
mesozooplank-ton assemblage,Calanus andClausocalanus copepodites having been synchronized
with the exogenous changes, showed a vertical migratory movement towards the
ACPD
8, 1291–1320, 2008March 2006 total solar eclipse effects
on ecosystems
G. Economou et al.
Title Page
Abstract Introduction
Conclusions References
Tables Figures
◭ ◮
◭ ◮
Back Close
Full Screen / Esc
Printer-friendly Version
Interactive Discussion
EGU
mediaincreased their abundance in the surface layer before totality. The other
cope-podites, male and female copepods displayed no significant differences in distribution
and apparent response to the eclipse. Similarly, the other zooplankton taxa such as
appendicullaria(Oikopleura dioica), meduses and doliolids responded to light changes
moving up towards the surface.
5
Overall, given the biodiversity of the Greek territory we seized the opportunity of the March 2006 Total Solar Eclipse to investigate the sensitivity of various species in
the biosphere. The different responses ascertained between various species both in
field crops and marine zoo-plankton, provide an early alert that future climate changes influencing the amount of radiation that reaches the earth’s surface, may disturb the
10
stability of the ecosystems, with direct and indirect impacts on crop productivity and in some cases on food chain it self.
Acknowledgements. We would like to thank the crew of the oceanographic R/V AEGAIO for their contribution.
References
15
Backus, R. H., Clark Jun, R. C., and Wing, A. S.: Behaviour of certain marine organisms during the solar eclipse of 20 July 1963, Nature, 205, 989–991, 1965.
Banse, K.: On the vertical distribution of zooplankton in the sea, Prog. Oceanogr., 2, 53–125, 1964.
Blumthaler, M., Bais, A., Webb, A., Kazadzis, S., Kift, R., Kouremeti, N., Schallhart, B.,
20
and Kazantzidis, A.: Variations of solar radiation at the Earth’s surface during the total solar eclipse of 29 March 2006, in: Remote Sensing of Clouds and the Atmosphere XI, edited by: Slusser, J. R., Sch ¨afer, K., and Comeron, A., Proceedings of the SPIE, 6362, doi:10.1117/12.689630, 2006.
Bright, T., Ferrari, F., and Martin, D.: Effects of a total solar eclipse on the vertical distribution of
25
certain oceanic zooplankters, Limnol. Oceanogr., 17(2), 296–301, 1972.
ACPD
8, 1291–1320, 2008March 2006 total solar eclipse effects
on ecosystems
G. Economou et al.
Title Page
Abstract Introduction
Conclusions References
Tables Figures
◭ ◮
◭ ◮
Back Close
Full Screen / Esc
Printer-friendly Version
Interactive Discussion
EGU
Never trust a copepod-some observations on their behaviour in the Canadian Arctic, Bull. Mar. Sci., 43, 650–662, 1988.
Cox, C. and Munk, W.: Statistics of the sea surface derived from sun glitter, J. Mar. Res., 13, 198–227, 1954.
Deen, J. L. and Bruner, M. H.: The effect of the 1932 eclipse upon the width of stomatal
5
openings in gray birch, Ecology, 14, 76–77, 1933.
Fernandez, W., Hidalgo, H., Coronel, G., and Morales, E.: Changes in meteorological variables in Coronel Oviedo, Paraguay, during the total solar eclipse of 3 November 1994, Earth Moon Planets, 74, 49–59, 1996.
Franceschini, G. A., Bright, T. J., Caruthers, J. W., El-Sayed, S. Z., and Vastano, A. C.: Effects
10
of the total solar eclipse, 7 March (1970) on migration of marine organisms in the Gulf of Mexico, Science, 226, 1155–1156, 1970.
Gerasopoulos, E., Zerefos, C. S., Tsagouri, I., Founda, D., Amiridis, V., Bais, A. F., Belehaki, A., Christou, N., Economou, G., Kanakidou, M., Karamanos, A., Petrakis, M., and Zanis, P.: The Total Solar Eclipse of March 2006: overview, Atmos. Chem. Phys. Discuss., 7, 17 663–
15
17 704, 2007.
Giroud, C. and Balvay, G.: The solar eclipse and the migration of some planktonic crustacea in Lake Geneva, Arch. Sci., 52, 199–208, 1999.
Gordon, H. R. and Morel, A.: Remote Assessment of Ocean Color for Interpretation of Satellite Visible Imagery, a Review; Lecture Notes on Coastal and Estuarine Studies, Springer Verlag,
20
New York, Vol. 4, 1–114, 1983.
H ¨aberle, K. H., Reiter, l., Patzner, K., Heyne, C., and Matyssek, R.: Switching the light off: A break in photosynthesis and sap flow of forest trees under total solar eclipse, Meteorologis-che Zeitschrift, 10(3), 201–206, 2001.
Hattori, H. and Saito, H.: Diel changes in vertical distribution and feeding activity of copepods
25
in ice-covered Resolute Passage, Canadian Arctic, in spring 1992, J. Marine Syst., 11, 205– 219, 1997.
Hays, G. C., Proctor, C. A., John, A. W. G., and Warner, A. J.: Interspecific differences in the diel vertical migration of marine copepods: The implication of size, color, and morphology, Limnol. Oceanogr., 39, 1621–1629, 1994.
30
Hawes, S. K.: Quantum fluorescence efficiencies of marine fulvic and humic acids. Master’s Thesis, Dept. of Marine Sc. Univ. of South Florida, St. Petersburg, FL., 1992.
ACPD
8, 1291–1320, 2008March 2006 total solar eclipse effects
on ecosystems
G. Economou et al.
Title Page
Abstract Introduction
Conclusions References
Tables Figures
◭ ◮
◭ ◮
Back Close
Full Screen / Esc
Printer-friendly Version
Interactive Discussion
EGU
total solar eclipse at Pinta Island, Galapagos, J. Fish Biol., 53, 683–686, 1998.
Jonsson, P. R.: Vertical distribution of planktonic ciliates – an experimental analysis of swim-ming behaviour, Mar. Ecol.-Prog. Ser., 52, 39–53, 1989.
Kampa, E.,M.: Observations of a sonic-scattering layer during the total solar eclipse, 30 June 1973, Deep-Sea Res., 22, 417–423, 1975.
5
Kazadzis, S., Bais, A., Blumthaler, M., Webb, A., Kouremeti, N., Kift, R., Schallhart, B., and Kazantzidis, A.: Effects of total solar eclipse of 29 March 2006 on surface radiation, Atmos. Chem. Phys., 7(22), 5775–5783, 2007.
Kumar, A., Phulera, R. P., Sood, O. P.: Effect of solar eclipse on germination of Dahlbergia sissco and Toona ciliata seed, Indian Forester, 110, 1184–1191, 1984.
10
Kuppers, M., Giersch, C., Schneider, H., and Kirschbaum, M. U. F.: Leaf gas exchange in light- and sun-fecks: response patterns and simulations, in: Trees contributions to modern tree physiology, edited by: Rennenberg, H., Eschrich, W.,. Ziegler, H., Backhuys Publishers, Leiden, The Netherlands, 77–96, 1997.
Ladefoged, K.: Transpiration of forest trees in closed stands, Physiol. Plantarum, 16, 378–414,
15
1963.
Marshall, S. M. and Orr, A. P.: The biology of a marine copepod,Calanus finmarchicus (Gun-nerus), Edinburgh and London: Oliver & Boyd, 188 pp., 1955.
Matyssek, R.: Carbon, water and nitrogen relations in evergreen and deciduous conifers, Tree Physiol., 2, 177–187, 1986.
20
Meidner, H. and Mansfield, T. A.: Physiology of Stomata, McGRAW- HILL Publishing Company Limited, Maidenhed- Berkshire- England, 1968.
Miller, E. C.: Plant Physiology, Mc Graw- Hill Book Company, Inc., New York and London, 1938. Mobley, C. D.: A numerical model for the computation of radiance distribution in natural waters
with wind-roughened surfaces, part II; user’s guide and code listing, NOAA Tech. Memo ERL
25
PMEL-81 (NTIS PB88-246871) (Pacific Marine Environmental Laboratory, Seattle, Wash.), 1988.
Mobley, C. D.: Light and Water: Radiative Transfer in Natural Waters, Academic Press, San Diego, Calif., 1994.
Mobley, C. D. and Sundman, L. K.: Hydrolight 4.1-Users Guide, Sequoia Scientific, Inc., 2000.
30
Morecroft, M., Oliver, H., Stokes, V., and Morison, J.: Sensing and mis-sensing the eclipse, Weather, 55, 174–176, 2000.
Oceanog-ACPD
8, 1291–1320, 2008March 2006 total solar eclipse effects
on ecosystems
G. Economou et al.
Title Page
Abstract Introduction
Conclusions References
Tables Figures
◭ ◮
◭ ◮
Back Close
Full Screen / Esc
Printer-friendly Version
Interactive Discussion
EGU
raphy, edited by: Jerlov, N. G. and Steeman, E. (Academic, London), 1–24, 1974.
Morel, A.: Light and marine photosynthesis: a spectral model with geochemical and climato-logical implications, Prog. Oceanog., 26, 263–306, 1991.
Pepita, T. S.: Observations on the behaviour of zooplankton during a solar eclipse [in Russian], Dokl. Akad. Nauk. SSSR+, 104, 323–325, 1955.
5
Perez, M. T., Dolan, J. R., Vidussi, F., and Fukai, E.: Diel vertical distribution of planktonic ciliates within the surface layer of the NW Mediterranean (May 1995), Deep-Sea Res. PT I, 47(3), 479–503, 2000.
POEM group.: General circulation of the Eastern Mediterranean, Earth-Sci. Rev., 32, 285–309, 1992.
10
Pope, R. M. and Fry, E. S.: Absorption spectrum (380–700 nm) of pure water, II. Integrating measurements, Appl. Optics, 36, 8710–8723, 1997.
Prieur, L. and Sathyendranath, S.: An optical classification of coastal and oceanic waters based on the specific spectral absorption curves of phytoplankton pigments, dissolved organic mat-ter, and other particulate materials, Limnol. Oceanogr., 26(4), 671–689, 1981.
15
Ringelberg, J.: Changes in light intensity and diel vertical migration: a comparison of marine and freshwater environments, Mar. Biol Assoc. UK, 75, 15–25, 1995.
Rochette, P., Pattey, E., Desjardins, R. L., Dwyer, L. M., Stewart, D. W., and Dub ´e, P. A.: Esti-mation of maize (Zea maysL.) canopy conductance by scaling up leaf stomatal conductance, Agr. Forest Meteorol., 54 (2–4), 241–261, 1991.
20
Runge, J. A. and Ingram, R. G.: Under ice feeding and diel migration by the planktonic cope-pods Calanus glacialis and Pseudocalanus minutus in relation to the ice algal production cycle in Southeastern Hudson Bay, Canada, Mar. Biol., 108(2), 217–225, 1991.
Sathaiah, V., Reddy, T. P., and Vaidyanath, K.: Cytological effects of solar eclipse in root meris-tems of plant sysmeris-tems, Cytologia, 49, 815–822, 1984.
25
Schreiber, U., Bilger, W., and Neubauer, C.: Chlorophyll fuorescence as a nonintrusive indicator for rapid assessment of in vitro photosynthesis, in: Ecophysiology of photosynthesis, edited by: Schulze, E. and Caldwell, D. M-M., Springer, Berlin, 49–70, 1995
Schmidt, H. E.: The vertical distribution and diurnal migration of some zooplankton in the Bay of Eilat (Red Sea), Helgoland. Wiss. Meer., 24, 333–340, 1973.
30
ACPD
8, 1291–1320, 2008March 2006 total solar eclipse effects
on ecosystems
G. Economou et al.
Title Page
Abstract Introduction
Conclusions References
Tables Figures
◭ ◮
◭ ◮
Back Close
Full Screen / Esc
Printer-friendly Version
Interactive Discussion
EGU
Sherman, K. and Honey, K. A.: Vertical movements of zooplankton during a solar eclipse, Nature, 227(5263), 1156–1158, 1970.
Singh, D. P., Kumar, A., Singh, P., Singh, V. P., Sheoran, I. S, and Singh, M.: Effect of so-lar eclipse on atmospheric environment, photosynthesis, evapotranspiration and water use efficiency of chickpea (Cicer arietinumL.) and wheat (Triticum aestivum L.), Crop Res., 5,
5
209–214, 1992.
Skud, B. E.: Responses of marine organisms during the solar eclipse of July 1963, Fish. B.-NOOA, 66(2), 259–271, 1967.
Smith, R. C. and Baker, K. S.: Optical properties of the clearest natural waters (200–800 nm), Appl. Optics, 20, 177–184, 1981.
10
Steppe, K., Lemeur, R., and Samson, R.: Sap flow dynamics of a beech tree during the solar eclipse of 11 August 1999, Agr. Forest Meteorol., 112(3–4), 139–149, 2002.
Stoecker, D. K., Taniguchi, A., and Michaels, A. E.: Abundance of autotrophic, mixotrophic and heterotrophic planktonic ciliates in shelf and slope waters, Mar. Ecol.-Prog. Ser., 50, 241–254, 1989.
15
Stramski, D., Boss, E., Bogucki, D., and Voss, K. J.: The role of seawater constituents in light backscattering in the ocean, Progr. Oceanogr., 61(1), 27–55, 2004.
Tont, S. A. and Wick, G. L.: Response of a deep scattering layer to 1972 total solar eclipse, Deep-Sea Res., 20(8), 769–771, 1973.
Tramer, E.J.: Bird behavior during a total solar eclipse, Wilson Bull., 112, 432–432, 2000.
20
Tzortziou, M., Herman, J., Gallegos, C., Neale, P., Subramaniam, A., Harding, L., and Ahmad, Z.: Bio-Optics of the Chesapeake Bay from Measurements and Radiative Transfer Closure, Estuar. Coast. Shelf S., 68, 348–362, 2006.
Utermohl, H.: Zur vervollkommnung der quantitativen phytoplankton methodik, Mitt. Int. Ver. fur Theor., Anderwandte Limnol., 9, 1–38, 1958.
25
Vecchione, M., Marles, R. S., and Donahoe, R.: Changes in chlorophyll-a concentrations in a shallow water column during a solar eclipse, Contrib. Mar. Sci., 29, 37–44, 1986.
ACPD
8, 1291–1320, 2008March 2006 total solar eclipse effects
on ecosystems
G. Economou et al.
Title Page
Abstract Introduction
Conclusions References
Tables Figures
◭ ◮
◭ ◮
Back Close
Full Screen / Esc
Printer-friendly Version
Interactive Discussion
EGU
Table 1.Micro-zooplankton and meso-zooplankton samplings before, during and after the total solar eclipse at Kastelorizo marine station (max depth 290 m).
Cast Time Zooplankton Measurements (UTC) Micro-
Meso-K1 7:52 + +
K2 9:00 +
K3 9:40 + +
K4 10:20 + +
K5 11:20 + +
K6 12:50 + +
ACPD
8, 1291–1320, 2008March 2006 total solar eclipse effects
on ecosystems
G. Economou et al.
Title Page
Abstract Introduction
Conclusions References
Tables Figures
◭ ◮
◭ ◮
Back Close
Full Screen / Esc
Printer-friendly Version
Interactive Discussion
EGU
Table 2. Maximum photosynthetic rates observed before the beginning of the eclipse and minimum photosynthetic rates near totality, for the examined species. The minimum/maximum ratios are also shown.
Species Photosynthetic ratesµmol CO2m−2s−1
Max before Min at totality Min/Max
Triticum durum 26.70 7.08 0.2651
Triticum aestivum 22.47 10.13 0.4508
Avena sativa 27.59 5.41 0.1961
Hordeum vulgare 27.26 8.89 0.3261
Lathyrus sativus 21.66 4.61 0.2128
Pisum sativum 28.52 9.87 0.3461
ACPD
8, 1291–1320, 2008March 2006 total solar eclipse effects
on ecosystems
G. Economou et al.
Title Page
Abstract Introduction
Conclusions References
Tables Figures
◭ ◮
◭ ◮
Back Close
Full Screen / Esc
Printer-friendly Version
Interactive Discussion
EGU
Table 3. Diurnal changes in stomatal conductance as least means (mmol g H2O m−2s−1), of four cereals and three leguminous species during the 29 March 2006 eclipse, at AUA exper-imental field. Values followed by the same letter are not statistically significant at the 95% significance level.
Time Crop field species
(UTC) Hard wheat Bread wheat Oat Barley Lathurus Pisum Faba beans
6:00 1.14 a 1.87 a 0.94 a 0.47 ab 2.1 a 1.58 a 0.9 a
7:00 0.66 b 0.8 bc 0.49 c 0.51 a 1.09 b 1.41 a 0.46 b
8:00 0.5 c 0.4 d 0.64 b 0.5 ab 0.52 cd 0.71 b 0.35 cd
9:00 0.31 de 1.08 b 0.35 d 0.33 c 0.42 cd 0.22 c 0.3 de
10:00 0.29 e 0.35 d 0.17 g 0.28 cd 0.27 d 0.41 bc 0.16 f
10:30 0.38 de 0.55 cd 0.25 efg 0.33 c 0.36 cd 0.38 c 0.34 cd
12:00 0.42 cd 0.41 d 0.29 def 0.43 b 0.62 c 0.3 c 0.22 ef
13:00 0.43 cd 0.3 d 0.2 fg 0.25 de 0.32 cd 0.2 c 0.35 cd
14:00 0.33 de 0.24 d 0.33 de 0.34 c 0.31 cd 0.25 c 0.24 ef
15:00 0.3 e 0.22 d 0.36 d 0.49 ab – – – – 0.4 bc
ACPD
8, 1291–1320, 2008March 2006 total solar eclipse effects
on ecosystems
G. Economou et al.
Title Page Abstract Introduction Conclusions References Tables Figures ◭ ◮ ◭ ◮ Back Close
Full Screen / Esc
Printer-friendly Version
Interactive Discussion
EGU
0 5 0 6 0 7 0 8 0 9 1 0 1 1 1 2 1 3 1 4 1 5 1 6 1 7 - 1 0 0
0 1 0 0 2 0 0 3 0 0 4 0 0 5 0 0 6 0 0 7 0 0 8 0 0 9 0 0 1 0 0 0 1 1 0 0
0 5 0 6 0 7 0 8 0 9 1 0 1 1 1 2 1 3 1 4 1 5 1 6 1 7
G lo bal Ho r ( W /m 2)
T i m e ( U T C )
G l . H o r a ) T i m e ( U T C )
0 5 0 6 0 7 0 8 0 9 1 0 1 1 1 2 1 3 1 4 1 5 1 6 1 7 1 4 1 6 1 8 2 0 2 2 T Temperat ur e ( oC)
T i m e ( U T C )
b )
0 5 0 6 0 7 0 8 0 9 1 0 1 1 1 2 1 3 1 4 1 5 1 6 1 7 5 0
6 0 7 0 8 0 9 0 1 0 0
R H
RH (
%
)
T i m e ( U T C )
c )
0 5 0 6 0 7 0 8 0 9 1 0 1 1 1 2 1 3 1 4 1 5 1 6 1 7 1 0 1 0
1 0 1 2 1 0 1 4 1 0 1 6
P r e s s
Pr es sur e (m bar )
T i m e ( U T C )
d )
Fig. 1. The diurnal course of meteorological parameters(a)Global Horizontal Irradiance,(b)
ACPD
8, 1291–1320, 2008March 2006 total solar eclipse effects
on ecosystems
G. Economou et al.
Title Page
Abstract Introduction
Conclusions References
Tables Figures
◭ ◮
◭ ◮
Back Close
Full Screen / Esc
Printer-friendly Version
Interactive Discussion
EGU μ
05 06 07 08 09 10 11 12 13 14 15 16 17 -10
0 10 20
30 max last
Legumes Field Crops LAS PIA VIF
b)
Time (UTC)
1st
05 06 07 08 09 10 11 12 13 14 15 16 17
0 5 10 15 20 25 30
Cereal Field Crops TRD TRA HOV AVS
Ph
oto
s
y
n
the
ti
c
Ac
ti
v
ity
(
μ
mo
l CO
2
m
-2 s -1 )
a)
Fig. 2.Diurnal changes in CO2assimilation rate (µmol CO2m−2
s−1
ACPD
8, 1291–1320, 2008March 2006 total solar eclipse effects
on ecosystems
G. Economou et al.
Title Page
Abstract Introduction
Conclusions References
Tables Figures
◭ ◮
◭ ◮
Back Close
Full Screen / Esc
Printer-friendly Version
Interactive Discussion
EGU
μ
12.0 12.5 13.0 13.5 14.0 14.5 15.0 15.5 16.0 0.0
0.2 0.4 0.6 0.8 1.0 1.2 1.4 1.6
0 500 1000 1500 2000 2500 Es
PAR (in
μ
mo
l pho
t
m
-2 s -1 )
Downw
e
lling Ir
radi
ance
(i
n W
m
-2 nm -1 )
Time (local time)
PAR(10m) PAR(30m)
K6 K5
K4 PAR(0m)
K2
09:00 10:00 11:00 12:00 13:00 Time (UTC)
Fig. 3.(Left axis) Change in measured downward surface irradiance (in W m−2
nm−1
) at 550 nm during the eclipse event (solid line). (Right axis) Change in model estimated photosynthetically active radiation (PAR, inµmol phot m−2
s−1
ACPD
8, 1291–1320, 2008March 2006 total solar eclipse effects
on ecosystems
G. Economou et al.
Title Page
Abstract Introduction
Conclusions References
Tables Figures
◭ ◮
◭ ◮
Back Close
Full Screen / Esc
Printer-friendly Version
Interactive Discussion
EGU
39 39.1 39.2 39.3 SALINITY
39 39.1 39.2 39 SALINITY
39 39.1 39.2 39. SALINITY
39 39.1 39.2 39.3 SALINITY
.3 3
16 16.2TEMPERATURE deg C16.4 16.6 16.8 17
200 160 120 80 40 0
PR
ES
S
U
R
E
(
dba
rs
)
0.15 0.16 0.17 0.18 0.19 0.2
CHL (mg/l)
K1
16 16.2TEMPERATURE deg C16.4 16.6 16.8 17
0.15 0.16 0.17 0.18 0.19 0.
CHL (mg
2
/l)
K4
16 16.2TEMPERATURE deg C16.4 16.6 16.8 1716 16.2TEMPERATURE deg C16.4 16.6 16.8 17
K5 K7
0.15 0.16 0.17 0.18 0.19 0.
CHL (mg
2 0.15 0.16 0.17 0.18 0.19 0.2
CHL (mg/l) /l)
ACPD
8, 1291–1320, 2008March 2006 total solar eclipse effects
on ecosystems
G. Economou et al.
Title Page
Abstract Introduction
Conclusions References
Tables Figures
◭ ◮
◭ ◮
Back Close
Full Screen / Esc
Printer-friendly Version
Interactive Discussion
EGU
0
10
20
30
40
50
60
70
80
90
100
0 50 100 150 200 250
cells l
-1De
p
th
(
m
)
K1
K3
K4
K5
K6
K7
Fig. 5.Vertical distribution (abundance l−1
ACPD
8, 1291–1320, 2008March 2006 total solar eclipse effects
on ecosystems
G. Economou et al.
Title Page
Abstract Introduction
Conclusions References
Tables Figures
◭ ◮
◭ ◮
Back Close
Full Screen / Esc
Printer-friendly Version
Interactive Discussion
EGU
100 90 80 70 60 50 40 30 20 10 0
0 500 1000 1500 2000
K2 K4 K5 K6
PAR
(
μmol phot m
-2s
-1)
D
e
pth (m)
ACPD
8, 1291–1320, 2008March 2006 total solar eclipse effects
on ecosystems
G. Economou et al.
Title Page
Abstract Introduction
Conclusions References
Tables Figures
◭ ◮
◭ ◮
Back Close
Full Screen / Esc
Printer-friendly Version
Interactive Discussion
EGU
K1 K2 K3 K4 K5 K6
0-10
10-20
20-50
50-100
0 50 100 150
ind m
-3D
ep
th
(m
)
0 50 100 150
ind m
-3(a) (b)
Fig. 7. Vertical distribution (abundance m−3