ACPD
7, 9235–9258, 2007Effects of total solar eclipse on surface
radiation
S. Kazadzis et al.
Title Page
Abstract Introduction
Conclusions References
Tables Figures
◭ ◮
◭ ◮
Back Close
Full Screen / Esc
Printer-friendly Version
Interactive Discussion
EGU Atmos. Chem. Phys. Discuss., 7, 9235–9258, 2007
www.atmos-chem-phys-discuss.net/7/9235/2007/ © Author(s) 2007. This work is licensed
under a Creative Commons License.
Atmospheric Chemistry and Physics Discussions
E
ff
ects of total solar eclipse of 29 March
2006 on surface radiation
S. Kazadzis1, A. Bais1, M. Blumthaler2, A. Webb3, N. Kouremeti1, R. Kift3, B. Schallhart1, and A. Kazantzidis2
1
Laboratory of Atmospheric Physics, Aristotle University of Thessaloniki, Greece
2
Division of Biomedical Physics, Innsbruck Medical University, Austria
3
School of Earth Atmospheric and Environmental Sciences, University of Manchester, UK
Received: 1 June 2007 – Accepted: 19 June 2007 – Published: 29 June 2007
ACPD
7, 9235–9258, 2007Effects of total solar eclipse on surface
radiation
S. Kazadzis et al.
Title Page
Abstract Introduction
Conclusions References
Tables Figures
◭ ◮
◭ ◮
Back Close
Full Screen / Esc
Printer-friendly Version
Interactive Discussion
EGU
Abstract
Solar irradiance spectral measurements were performed during a total solar eclipse. The spectral effect of the limb darkening to the global, direct irradiance and actinic flux measurements was investigated. This effect leads to wavelength dependent changes in the measured solar spectra showing a much more pronounced decrease in the
ra-5
diation at the lower wavelengths. Radiative transfer model results were used for the computation of a correction for the total ozone measurements due to the limb darken-ing. This correction was found too small to explain the large decrease in total ozone column derived from the standard Brewer measurements, which is an artifact in the measured irradiance due to the increasing contribution of diffuse radiation against the
10
decreasing direct irradiance caused by the eclipse. Calculations of the Extraterrestrial spectrum and the effective sun’s temperatures, as measured from ground based direct irradiance measurements, showed an artificial change in the calculations of both quan-tities due to the fact that radiation coming from the visible part of the sun during the eclipse phases differs from the back body radiation described by the Planck’s law.
15
1 Introduction
On 29th March, 2006 a total solar eclipse was visible along a narrow corridor which traversed half the Earth, starting in Brazil, extending across the Atlantic, through North Africa, and central Asia and ending in northern Mongolia. The umbra traversed the Mediterranean passing directly over the Greek island of Kastelorizo (36.150◦N,
20
29.596◦E).
The spectral behaviour of solar radiation reaching the earth’s surface during the course of a solar eclipse can be studied either with ground based (GB) measurements or with the use of radiative transfer model (RTM) calculations to measure or simulate different radiation quantities. During an eclipse, as the disk of the moon moves across
25
ACPD
7, 9235–9258, 2007Effects of total solar eclipse on surface
radiation
S. Kazadzis et al.
Title Page
Abstract Introduction
Conclusions References
Tables Figures
◭ ◮
◭ ◮
Back Close
Full Screen / Esc
Printer-friendly Version
Interactive Discussion
EGU (LD) becomes relevant and needs to be taken into account. Measurements of radiative
quantities (Beletsky et al., 1998; Jerlov et al., 1954) and model calculations (K ¨opke et al., 2001) have been performed during various eclipse events.
There are only a few studies (Fernandez et al., 1993; Mikhalev et al., 1999) that present the eclipse-induced changes in the spectral solar UV irradiance at the earth’s
5
surface, and even fewer measurements exist of solar LD observations of the extrater-restrial (ET) spectrum at UV wavelengths (Greve and Neckel, 1996; K ¨opke et al., 2001). Several earlier studies have examined possible effects of a solar eclipse on the ozone column (Bojkov, 1968; Chakrabarty et al., 1997; Jerlov et al., 1954; Svensson, 1958; Zerefos et al., 2001). Ozone observations with Brewer and Dobson instruments have
10
shown a decrease in ozone during the maximum phase of the eclipse. Other studies, however, in which other instruments were used for the determination of total ozone, have shown different results as to the sign and the magnitude of total ozone changes.
In this study we investigate the effect of the solar eclipse on measurements of several radiation quantities (global irradiance (GI), direct irradiance (DI) and actinic flux (AF))
15
and total column ozone, conducted in a two-day campaign at Kastelorizo. In addition, RTM System for Transfer of Atmospheric Radiation (STAR) calculations of the ET solar spectrum proposed by K ¨opke et al. (2001) were used in order to investigate temporal and spectral variability of UV irradiance during the solar eclipse of 29th March 2006.
2 Campaign information, instruments and modeling tools
20
2.1 Site description and eclipse details
The campaign took place at the island of Kastelorizo, Greece, during the 28 and 29 (eclipse day) March 2006, with the participation of three groups: Innsbruck Medical University, division of biomedical physics, Austria (UI), Aristotle University, Physics De-partment, Thessaloniki, Greece (AUTH) and School of Earth Atmospheric and
En-25
ACPD
7, 9235–9258, 2007Effects of total solar eclipse on surface
radiation
S. Kazadzis et al.
Title Page
Abstract Introduction
Conclusions References
Tables Figures
◭ ◮
◭ ◮
Back Close
Full Screen / Esc
Printer-friendly Version
Interactive Discussion
EGU deployed in a field on the north side of the island. Hills obstructed the horizon towards
the south and east up to an elevation of about 20◦, and a
ffected the measurements of global irradiance but caused no obstruction to viewing the sun during the eclipse, as well as for several hours before and after.
The timing of the different phases of the eclipse for the specific location is given in
5
Table 1. In all figures, vertical lines mark the beginning, maximum (totality) and the end of the eclipse.
The weather on 28 March was clear with cloudless skies and excellent visibility. On 29 March cirrus clouds started to form after the beginning of the eclipse. Occasionally, the cirrus clouds obscured the sun, especially after the time of the totality, affecting
10
mainly the measurements of the DI. A few minutes before totality, cumulus clouds started developing, and continued growing as the eclipse progressed. However, on several occasions it was still possible to see the sun and measure the DI.
2.2 Instrumentation
Various instruments were deployed at Kastelorizo during this two-day campaign. A
15
double monochromator spectroradiometer (Bentham DTM 300), operating in the spec-tral range 290–400 nm in steps of 0.5 nm, was used to measure simultaneously GI, AF and in addition DI. The FWHM for the GI and AF measurements was 0.95 nm, while for the DI it was 0.55 nm. The scanning time for a full spectrum was about 3 min. A sec-ond double monochromator spectroradiometer (Brewer MK III) was used to measure
20
GI and DI in the wavelength region of 290–366 nm in steps of 0.5 nm and with spectral resolution of 0.55 nm (FWHM). For this study the operating software of the instrument was modified to allow the alternating measurement (every 30 s) of global and direct spectral irradiance at 6 wavelengths between 302 and 320 nm. The two instruments have been used in many UV monitoring campaigns measuring GI, DI and AF (Bais
25
ACPD
7, 9235–9258, 2007Effects of total solar eclipse on surface
radiation
S. Kazadzis et al.
Title Page
Abstract Introduction
Conclusions References
Tables Figures
◭ ◮
◭ ◮
Back Close
Full Screen / Esc
Printer-friendly Version
Interactive Discussion
EGU spectral irradiance traceable to the Physikalisch-Technische Bundesanstalt standards.
However, in this campaign the emphasis was given to the relative change of the radi-ation due to the eclipse, and therefore the absolute calibrradi-ation of the measurements was less important.
Two diode arrays (PDA) and a coupled charged device (CCD) spectrometers (all
5
single monochromators) were also used to record spectral measurements of GI, DI and AF. Their advantage is the simultaneous recording of the spectrum, which eliminates distortions from clouds or from the change in the ET irradiance during the eclipse. The CCD was used for measurements of the direct irradiance and the sky radiance in the spectral range of 280–1040 nm with a variable wavelength dependent FWHM (ranging
10
between 1.9 nm and 3.5 nm). Its usual sampling rate is one measurement every 2 s and the field of view is 1.2◦
. The instrument was mounted on a tracking system capable of following the sun. The first PDA instrument (Ocean Optics S2000) was used for measurements of the global irradiance in the spectral range of 290–850 nm with a FWHM of 1.3 nm, measuring one spectrum every 12 s. A second channel measured
15
zenith sky radiance. The second PDA (Metcon Inc.) was used for measurements of the actinic flux in the spectral range of 290–700 nm with a FWHM of 2.3 nm, measuring one spectrum every 8 s. A second channel measured DI in parallel with the Bentham.
In addition to the spectral measurements, measurements with broadband and filter radiometers were also available. A NILU-UV multi-filter radiometer measured GI at
20
5 narrow bands (∼10 nm FWHM) in the UVB (305, 312, and 320 nm), the UVA (340 and 380 nm), and the photosynthetically active radiation (PAR, 400–700 nm) with a fre-quency of 1 Hz. In addition, an erythemal detector, a UVA detector and a pyranometer operated continuously, recording 1 min averages.
Direct sun measurements with 2 handheld sun-photometers (Microtops) with filters
25
ACPD
7, 9235–9258, 2007Effects of total solar eclipse on surface
radiation
S. Kazadzis et al.
Title Page
Abstract Introduction
Conclusions References
Tables Figures
◭ ◮
◭ ◮
Back Close
Full Screen / Esc
Printer-friendly Version
Interactive Discussion
EGU camera was equipped with an additional adjustable polarization filter. Pictures were
taken every 10 min, with an increased frequency of one picture per min during the eclipse.
2.3 Modelling of the extraterrestrial irradiance spectrum during the eclipse
During an eclipse the spectral shape of solar irradiance outside the Earth’s atmosphere
5
is changing due to the LD effect. For the conditions of the total eclipse in Kastelorizo, this change of ET solar irradiance was calculated according to K ¨opke et al. (2001). The formulas used, taken from Waldmeier (1941) and Scheffler and Els ¨asser (1974), are based on the geometric considerations of the position of the moon relative to the sun during the eclipse combined with a description of the spectral radiance distribution
10
over the solar disk and its dependence on the relative distance from the centre.
3 Total ozone column
Surface UV-B radiation under cloud-free skies is primarily affected by atmospheric ozone and aerosols. Variation of these two parameters may partially mask the ef-fect of the eclipse on UV-B radiation. From the DI measurements that were conducted
15
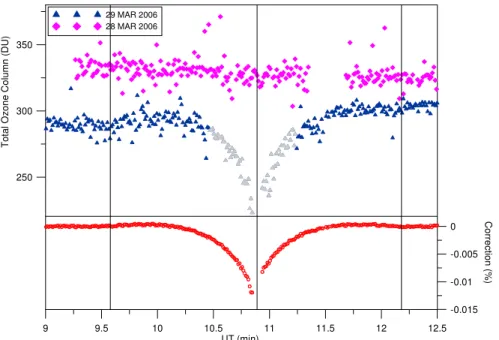
during the campaign with the Brewer MK III, the total ozone column has been calcu-lated. In general, total ozone was about 30–40 DU lower on the day of the eclipse than the day before. During the course of the eclipse, one can see a gradual decrease in total ozone, followed by a symmetric increase after totality (Fig. 1). This effect has been reported by others (Bojkov, 1968; Zerefos et al., 2001) and it was attributed partly to
20
the LD effect and partly to the increasing influence on DI of the diffuse radiance in the field of view of the instruments. In Zerefos et al. (2001) it was suggested that the LD effect is less than 1%. Here we confirm this finding by calculating a correction for total ozone based on the wavelength dependent change of ET irradiance during the eclipse derived by the model suggested in (K ¨opke et al., 2001). This correction is shown in the
ACPD
7, 9235–9258, 2007Effects of total solar eclipse on surface
radiation
S. Kazadzis et al.
Title Page
Abstract Introduction
Conclusions References
Tables Figures
◭ ◮
◭ ◮
Back Close
Full Screen / Esc
Printer-friendly Version
Interactive Discussion
EGU lower panel of Fig. 1, and was found to be much smaller (less than 0.01 %).
There-fore the most likely reason for the apparent reduction in total ozone values during the eclipse is “contamination” of DI measurements by the diffuse radiation. In Fig. 1 the measurements that correspond to sun coverage by the moon of more than 70% are marked with grey triangles and should be discarded. The 70% coverage corresponds
5
roughly to a reduction in direct irradiance measurements (taken under normal condi-tions) at airmass factors of more than 3, which are usually discarded in the standard Brewer total ozone measurements. For the period between 09:00 and 13:00 UT, the to-tal ozone column was changing on the day before the eclipse from about 335 DU down to about 325 DU, and on the day of the eclipse it was increasing from about 290 DU to
10
305 DU.
4 Spectral measurements of solar irradiance during the eclipse
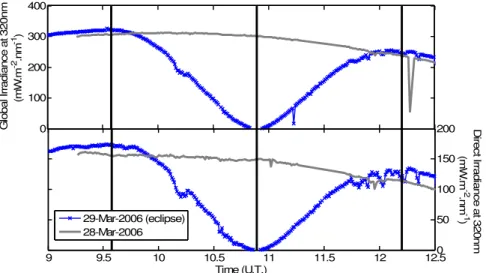
Measurements of GI and DI during the eclipse and for the previous day are shown in Fig. 2. The black vertical lines represent the start of the eclipse, totality and the end of the eclipse. Except for the reduction in both quantities due to the eclipse the main
15
change in the irradiance is due to changes in the solar zenith angle. Local noon was within a few minutes of the start of the eclipse and all irradiance changes afterwards are a combination of the eclipse effect in addition to the reduction of the irradiance due to increasing solar zenith angle.
With the use of DI spectroradiometric data the spectral aerosol optical depth could
20
ACPD
7, 9235–9258, 2007Effects of total solar eclipse on surface
radiation
S. Kazadzis et al.
Title Page
Abstract Introduction
Conclusions References
Tables Figures
◭ ◮
◭ ◮
Back Close
Full Screen / Esc
Printer-friendly Version
Interactive Discussion
EGU 4.1 Global irradiance and actinic flux
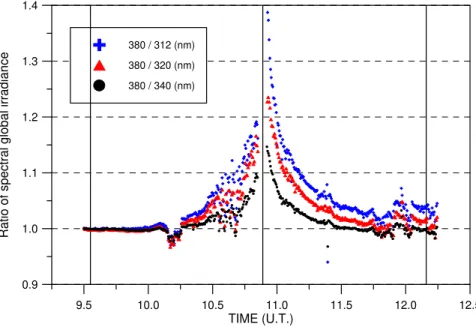
Measurements of global UV irradiance that were performed during the campaign with the NILU-UV multi-filter instrument have been used to study the spectral impact of the LD on the irradiance spectra. Ratios of GI measurements at 380 nm to the irradiances at 312, 320 and 340 nm are shown in Fig. 3. First, the data were corrected for the
5
effect of the changing solar zenith angle during the period of study by normalization with the measurements taken during the previous (cloudless) day at the same solar zenith angles. These ratios were normalized again with the mean ratio over a period of 5 min just before the start of the eclipse, to bring all ratios to the same scale and allow direct comparisons for all three wavelengths. During the 5 min period used for
10
the normalization the sky was free of clouds. If the attenuation of GI was spectrally independent and proportional to the geometrical sun coverage, the ratios would have been equal to unity throughout the period of the eclipse. Figure 3 shows that there is a spectral dependence which is more evident at the shorter wavelengths. The change in irradiance at 312, 320 and 340 nm relative to the irradiance at 380 nm, is respectively
15
about 20%, 15% and 10% for 99% sun coverage. For each channel, measurements of less than 10 times the dark current were eliminated from the analysis. In Fig. 3 the data that correspond to the totality and approximately 30 s before and after are not shown, because of their low signal to noise ratio.
Periods affected by clouds are visible in the dataset especially after the eclipse. In
20
addition, the change of the total ozone column during the eclipse (see Fig. 1) results in separation of the three curves after totality (mainly after 11:15 UT). This separation occurs because the ratios for 312 and 320 nm are normalized with values measured at a time of lower total ozone (∼90:30 UT). GI at 340 nm is not affected by ozone; hence
the ratio (380 nm/340 nm) is more symmetric around the totality.
25
ACPD
7, 9235–9258, 2007Effects of total solar eclipse on surface
radiation
S. Kazadzis et al.
Title Page
Abstract Introduction
Conclusions References
Tables Figures
◭ ◮
◭ ◮
Back Close
Full Screen / Esc
Printer-friendly Version
Interactive Discussion
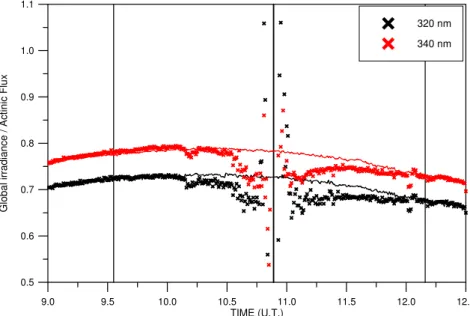
EGU The data represent 30 s averages. The data during the 3 min of the totality and for a
1 min before and after are not shown due to the large scatter introduced by the low signal to noise ratio of the PDA’s. Effects from thin cirrus clouds that have appeared occasionally during the eclipse resulted into decreases for both ratios. Generally the differences in the ratios with respect to the previous day are small (in the order of 5–
5
8%). As the eclipse progresses the ratio in the eclipse day becomes lower compared to the previous day, suggesting that GI is affected more by the eclipse than the AF. A possible reason might be the faster decrease in the direct irradiance compared to the diffuse irradiance during the eclipse which will have a more pronounced effect on GI than on AF. RTM calculations for the specific solar zenith angles, using the
mea-10
sured aerosol optical depth and total ozone at Kastelorizo, showed that at 340 nm the contribution of the DI is 40% for the GI and 30% for AF.
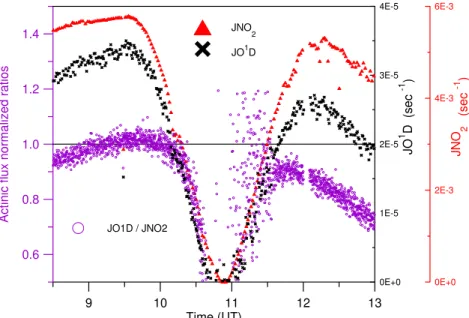
The effect of the LD can be seen also in the photolysis rates of JO1D and JNO2
retrieved from the AF measurements. The calculated photolysis frequencies are sen-sitive to different wavelength bands (JO1D around 307 nm and JNO2 around 380 nm,
15
depending on the solar zenith angle). Thus, the LD effect on the calculated J’s leads to a faster decrease of the JO1D photolysis frequency than the one of JNO2. Both frequencies and their ratio are shown in Fig. 5.
Figure 5. Variation of JO1D (triangles) and JNO2(crosses) photolysis frequencies,
normalized with their values at the time of the first contact. The ratio JO1D/JNO2 is
20
also shown in purple circles.
For Fig. 5 no normalization has been made to account for solar zenith angle change in order to demonstrate this solar zenith angle effect together with the LD effect on the JO1D/JNO2ratio.
4.2 Direct irradiance
25
ACPD
7, 9235–9258, 2007Effects of total solar eclipse on surface
radiation
S. Kazadzis et al.
Title Page
Abstract Introduction
Conclusions References
Tables Figures
◭ ◮
◭ ◮
Back Close
Full Screen / Esc
Printer-friendly Version
Interactive Discussion
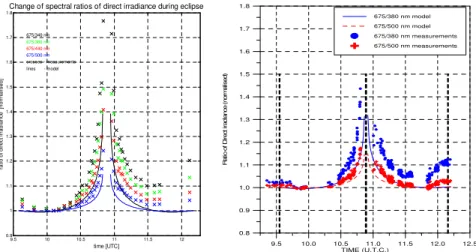
EGU The change in the spectral characteristics of the direct solar irradiance is
demon-strated by the ratio of the irradiance at 675 nm to the irradiance at 340 nm, 380 nm, 440 nm and 500 nm, which were measured by the Microtops sun photometers. These ratios were normalized to their values at around 10:00 UT, as we are interested mainly on relative changes. Figure 6 shows clearly the increase of these ratios during the
5
course of the eclipse towards the totality (and the decrease after totality). A similar pattern is seen also in the ratios 675/340 nm and 675/500 nm which were derived from model calculations. Evidently, when the moon covers the sun the irradiance at shorter wavelengths is reduced more compared to longer wavelengths. However, the detail of the variation of the measured values deviates systematically from the model
calcu-10
lation, in the first phase of the eclipse as well as in the final phase. The measured variation is stronger than the calculated one. An effect that could explain part of the differences shown in figure 6 is the contribution of the diffuse irradiance (entering in the field of view of the instruments) which increases as the eclipse percentage increase. This effect can not be taken into account from the model calculations presented here.
15
The larger spread of the data in the period when the moon is leaving the sun might indicate that the aerosol amount was not constant during this time period in addition to the cirrus clouds spectral effects. Using normalization, at about 11.7 UT, the right part of the plot shows the same systematic variation of the measured values as the left part. These results for the spectral variation of the DI are very well confirmed by analyses of
20
DI measurements with the CCD spectrometer, which show exactly the same behavior (see right panel of Fig. 6). However, the weather conditions during the eclipse were not perfect, as some thin clouds were in front of the sun for a few short periods, which could explain some of the obviously lower measured data.
5 Extraterrestrial flux and solar effective temperature calculations
25
re-ACPD
7, 9235–9258, 2007Effects of total solar eclipse on surface
radiation
S. Kazadzis et al.
Title Page
Abstract Introduction
Conclusions References
Tables Figures
◭ ◮
◭ ◮
Back Close
Full Screen / Esc
Printer-friendly Version
Interactive Discussion
EGU gions of the sun (corresponding to different temperatures – Limb Darkening effect), and
hence its spectrum differs from that of the black body radiation that is usually consid-ered. Being a mixture of black body spectra of different temperatures the spectrum at the top of the atmosphere during the different phases of the eclipse can be corre-sponded to a unique effective temperature. On the contrary if an effective temperature
5
were to be derived from this spectrum, it would have been wavelength dependent. In the following we estimate the ET solar spectrum which varies during the course of the eclipse and we determine the corresponding effective temperature of the partly visible sun from the equivalent to the each ET spectrum blackbody radiation using Plank’s law. Using the Atlas 3 ET solar spectrum (Brueckner et al, 1996) and the irradiance
mea-10
surements at the surface, the atmospheric transmission was calculated before the start of the eclipse. The ET spectrum was convolved with the slit function of each instrument and the spectral transmittance was calculated as the ratio of the measured spectral DI before the start of the eclipse (adjusted to vertical incidence) to the convolved ET solar spectrum. The derived transmittance, that is assumed constant during the
pe-15
riod of the eclipse, was used to calculate new ET spectra from the measured direct irradiance at the surface during the course of the eclipse. Spectra of DI were mea-sured by means of the scanning spectroradiometer (Bentham DTM 300), and the CCD spectrometer, while measurements at single wavelengths were provided also by the 2 handheld Microtops sun-photometers. Zerefos et al., 2001 calculated using the same
20
methodology the pre-eclipse ET spectrum and the ET at the eclipse maximum (88%) at Thessaloniki, Greece for the eclipse of 11 August 1999. In addition, they calculated the effective temperature derived by each wavelength in the spectral range 305-365 nm. Here, we have extended the spectral range to 600 nm and we have calculated the ET spectrum change and the corresponding effective temperature for all measurement
25
points (times) during the eclipse. The analysis shown hereafter is restricted to for the first part of the eclipse only, as after the totality more cirrus clouds appeared on the sky causing changes in the atmospheric transmission.
ACPD
7, 9235–9258, 2007Effects of total solar eclipse on surface
radiation
S. Kazadzis et al.
Title Page
Abstract Introduction
Conclusions References
Tables Figures
◭ ◮
◭ ◮
Back Close
Full Screen / Esc
Printer-friendly Version
Interactive Discussion
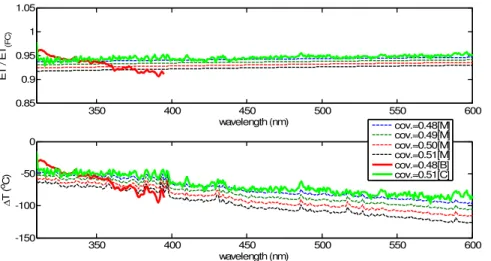
EGU coverage to the ET flux before the start of the eclipse is shown. Red and green lines
represent measurements with the Bentham spectroradiometer (for 48% sun coverage) and the CCD spectrometer (for 51% sun coverage) respectively. The dashed lines rep-resent model calculations for different fractions of sun coverage from 48% to 51%, in steps of 1%. The lower plot of Fig. 7 shows the difference of the sun effective
tem-5
perature calculated at the specific time of the eclipse from the temperature calculated before the start of the eclipse. This has been investigated in order to show the spectral deviations, due to the LD effect, of the calculated ET’s from the ones calculated with the use of the Planck’s law. Without the LD effect the ratios calculated in the upper plot would be equal to one and the temperature differences would be zero for all
wave-10
lengths. In this case, the LD effect creates a temperature difference that varies with wavelength. It should be mentioned that the CCD measures a spectrum in less than 20 s while the Bentham spectroradiometer measurement lasts for about 3 min, which in conjunction to the changing conditions due to the eclipse leads to differences in the measurements of the two instruments. This can explain part of the observed diff
er-15
ences in the calculated ET spectra derived from the direct irradiance measurements by the two instruments, as shown in the upper panel of Fig. 7.
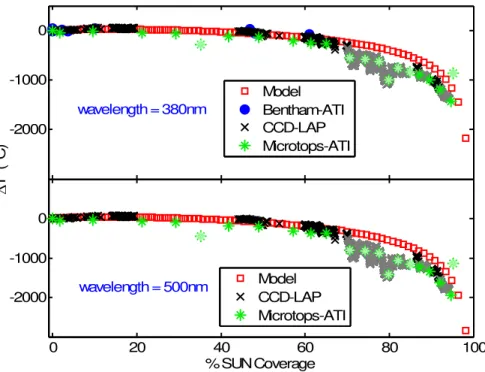
An interesting effect can be seen when we calculated the same ET flux ratios and temperature differences for the first minutes of the eclipse. For 10% sun coverage both instruments and the model calculations show an increase in the calculated ET flux of
20
up to 5% and also a temperature increase (up to 40◦
). This happens because in the beginning of the eclipse only the outer part of the solar disk is covered. The outer part has a lower temperature so the mean temperature of the sun at this moment is dominated by the temperature of the central part of the solar disk. This leads to the calculation of a higher ET than the one calculated before the start of the eclipse.
25
af-ACPD
7, 9235–9258, 2007Effects of total solar eclipse on surface
radiation
S. Kazadzis et al.
Title Page
Abstract Introduction
Conclusions References
Tables Figures
◭ ◮
◭ ◮
Back Close
Full Screen / Esc
Printer-friendly Version
Interactive Discussion
EGU fected by cirrus clouds. As a result of this change in atmospheric transmission the
calculated ET flux is lower than the one expected under cloudless skies, and thus the calculated effective temperatures are lower than those predicted by the model. The results from all instruments show similar behavior. Larger deviations are observed for longer wavelengths and an acceleration of the rate of this decrease is observed in the
5
last minutes before totality.
6 Conclusions
Spectral measurements of the solar irradiance were performed at Kastelorizo, Greece during a total solar eclipse. The results were compared with changes in the extrater-restrial solar flux predicted by the STAR radiative transfer model (K ¨opke et al., 2001).
10
The model results allow the computation of a correction for the total ozone measure-ments due to the limb darkening effect during the eclipse. This correction is far too small to explain the large decrease in total ozone column derived from the standard Brewer measurements. It is suggested that this decrease in total ozone is an artifact in the measured irradiance due to the increasing contribution of diffuse radiation against
15
the decreasing direct irradiance caused by the eclipse.
Global, direct irradiance and actinic flux measurements showed that all quantities are spectrally affected by the limb darkening during the eclipse. The effect leads to wavelength dependent changes in the measured solar spectra showing a much more pronounced decrease in the radiation at the lower wavelengths as the percentage of
20
the sun coverage is increased for all the above quantities.
The comparison of model results and measurements showed that previous model calculations underestimate this spectral limb darkening effect especially close to the totality of the solar eclipse. This result was confirmed by measurements from two different instruments.
25
ACPD
7, 9235–9258, 2007Effects of total solar eclipse on surface
radiation
S. Kazadzis et al.
Title Page
Abstract Introduction
Conclusions References
Tables Figures
◭ ◮
◭ ◮
Back Close
Full Screen / Esc
Printer-friendly Version
Interactive Discussion
EGU quantities. The limb darkening effect induces spectral changes in the ET spectrum
measured from remote sensing techniques. The derived ET spectrum is a mixture of black body radiation spectra originating from parts of the solar disk with different temperatures. Thus, fitting a Plank function on these data, in order to derive the corre-sponding black body temperature of the Sun, leads to false estimates.
5
References
Bais, A. F., Gardiner, B. G., Slaper, H., Blumthaler, M., Bernhard, G., McKenzie, R.; Webb, A. R., Seckmeyer, G., Kjeldstad, B., Koskela, T., Kirsch, P. J., Gr ¨obner, J., Kerr, J. B., Kazadzis, S., Leszcznski, K., Wardle, D., Josefsson, W., Brogniez, C., Gillotay, D., Reinen, H., Weihs, P., Svenoe, T., Eriksen, P., Kuik, F., and Redondas A.: SUSPEN intercomparison of ultraviolet
10
spectroradiometers, J. Geophys. Res.-Atmos., 106(D12), 12 509–12 525, 2001.
Beletsky, A. B., Mikhalev, A. V., and Chernigovskaya, M. A.: Spectral measurements of the solar nearground UV radiation during the solar eclipse on March 9, 1997, Atmos. Oceanic Opt., 11, 301–306, 1998.
Bojkov, R. D.: The ozone variations during the solar eclipse of May 20 1966, Tellus, 20, 417–
15
421, 1968.
Brueckner, L., Floyd, E., Lund, P. A., Prinz, D. K., and VanHoosier, M. E.: Solar Ultraviolet Spectral Irradiance Observations for the UARS/SUSIM Experiment, G.E., Metrologia, 32, 661–665, 1996.
Chakrabarty, D. K., Shah, N. C., and Pandya, K. V.: Fluctuation in ozone column over
Ahmed-20
abad during the solar eclipse of 24 October 1995, Geophys. Res. Lett., 24(23), 3001, doi:10.1029/97GL03016, 1997.
Fernandez, W., Castro, V., Wright, J., Hidalgo, H., and Saenz, A.: Changes in solar irradiance and atmospheric turbidity in Costa Rica during the total solar eclipse of July 11, 1991, Earth, Moon, Planets, 63(2), 119, 1993.
25
Greve, A., and Neckel, H.: On the consistency of solar limb darkening observations at UV wavelengths (2000–3300 A?), Astronomy and Astrophysics Supplement Series, 120(1), 35– 39, 1996.
Jerlov, N., Olsson, H., and Schuepp, W.: Measurements of solar radiation at Loevanger in Sweden during the total eclipse 1945, Tellus, 6, 44–45, 1954.
ACPD
7, 9235–9258, 2007Effects of total solar eclipse on surface
radiation
S. Kazadzis et al.
Title Page
Abstract Introduction
Conclusions References
Tables Figures
◭ ◮
◭ ◮
Back Close
Full Screen / Esc
Printer-friendly Version
Interactive Discussion
EGU
K ¨opke, P., Reuder, J., and Schween, J.: Spectral variation of the solar radiation during an eclipse, Meteorol Z, 10(3), 179–186, 2001.
Kylling, A., Webb, A. R., Gobbi, G. P., et al.: Spectral actinic flux in the lower troposphere: mea-surement and 1-D simulations for cloudless, broken cloud and overcast situations, Atmos. Chem. Phys., 5, 1975–1997, 2005,
5
http://www.atmos-chem-phys.net/5/1975/2005/.
Mikhalev, A. V., Chernigovskaya, M. A., Beletsky, A. B., Kazimirovsky, E. S., and Pirog, O. M.: Variations of the ground-measured solar ultraviolet radiation during the solar eclipse on March 9, 1997, Adv. Space Res., 24(5), 657–660, 1999.
Scheffler, H. and Els ¨asser, H.: Physik der Sterne und der Sonne, 535 pp., Bibliographisches
10
Institut Z ¨urich, Zurich, Switzerland, 1974.
Svensson, B.: Observations on the amount of ozone by Dobson spectrophotometer during the solar eclipse of June 30, 1954, Arkives Geofysikae, 2, 573–594, 1958.
Waldmeier, M.: Ergebnisse und Probleme der Sonnenforschung, Probleme der kosmischen Physik, 264 pp., Akad Verlagsges Becker & Erler, Leipzig, Germany, 1941.
15
Webb, A. R., Bais, A. F., Blumthaler, M., Gobbi, G. P., Kylling, A., Schmitt, R., Thiel, S., Barnaba, F., T.,, W. Junkermann, Kazantzidis, A., Kelly, P., Kift, R., Liberti, G. L., Misslbeck, M., Schall-hart, B., Schreder, J., and Topaloglou, C.: Measuring spectral actinic flux and irradiance: Experimental results from the Actinic Flux Determination from Measurements of Irradiance (ADMIRA) project, J. Atmos. Ocean. Tech., 19(7), 1049–1062, 2002.
20
ACPD
7, 9235–9258, 2007Effects of total solar eclipse on surface
radiation
S. Kazadzis et al.
Title Page
Abstract Introduction
Conclusions References
Tables Figures
◭ ◮
◭ ◮
Back Close
Full Screen / Esc
Printer-friendly Version
Interactive Discussion
EGU
Table 1.Data of the eclipse timing at Kastelorizo.
Status of the eclipse Time (UT)
Beginning of eclipse 09:34:46
Beginning of totality 10:51:56
Maximum 10:53:28
End of totality 10:55:00
ACPD
7, 9235–9258, 2007Effects of total solar eclipse on surface
radiation
S. Kazadzis et al.
Title Page
Abstract Introduction
Conclusions References
Tables Figures
◭ ◮
◭ ◮
Back Close
Full Screen / Esc
Printer-friendly Version
Interactive Discussion
EGU
9 9.5 10 10.5 11 11.5 12 12.5
UT (min) 250
300 350
T
o
ta
l O
z
on
e
C
o
lum
n
(
D
U)
-0.015 -0.01 -0.005
0 Co
rr
e
c
tion
(%)
29 MAR 2006 28 MAR 2006
Fig. 1. (Top) Total column ozone measured by a Brewer spectroradiometer on 28 and 29
March 2006. (Bottom): Calculated correction in total ozone due to the limb darkening effect.
ACPD
7, 9235–9258, 2007Effects of total solar eclipse on surface
radiation
S. Kazadzis et al.
Title Page
Abstract Introduction
Conclusions References
Tables Figures
◭ ◮
◭ ◮
Back Close
Full Screen / Esc
Printer-friendly Version
Interactive Discussion
EGU 0
100 200 300 400
G
loba
l I
rradi
an
c
e at
320n
m
(m
W
.m
-2.n
m
-1)
9 9.5 10 10.5 11 11.5 12 12.50
50 100 150 200
Time (U.T.)
D
ire
c
t I
rrad
ia
nc
e
at
320
nm
(m
W
.m
-2
.n
m
-1
)
29-Mar-2006 (eclipse) 28-Mar-2006
ACPD
7, 9235–9258, 2007Effects of total solar eclipse on surface
radiation
S. Kazadzis et al.
Title Page
Abstract Introduction
Conclusions References
Tables Figures
◭ ◮
◭ ◮
Back Close
Full Screen / Esc
Printer-friendly Version
Interactive Discussion
EGU
9.5 10.0 10.5 11.0 11.5 12.0 12.5
TIME (U.T.)
0.9 1.0 1.1 1.2 1.3 1.4
R
a
tio of spectral gl
ob
al
irradi
an
ce
380 / 312 (nm)
380 / 320 (nm)
380 / 340 (nm)
ACPD
7, 9235–9258, 2007Effects of total solar eclipse on surface
radiation
S. Kazadzis et al.
Title Page
Abstract Introduction
Conclusions References
Tables Figures
◭ ◮
◭ ◮
Back Close
Full Screen / Esc
Printer-friendly Version
Interactive Discussion
EGU
9.0 9.5 10.0 10.5 11.0 11.5 12.0 12.5
TIME (U.T.)
0.5 0.6 0.7 0.8 0.9 1.0 1.1
Gl
o
b
al
i
rr
a
d
ian
c
e
/
Ac
ti
ni
c
F
lux
320 nm
340 nm
ACPD
7, 9235–9258, 2007Effects of total solar eclipse on surface
radiation
S. Kazadzis et al.
Title Page
Abstract Introduction
Conclusions References
Tables Figures
◭ ◮
◭ ◮
Back Close
Full Screen / Esc
Printer-friendly Version
Interactive Discussion
EGU
9 10 11 12 13
Time (UT)
0.6 0.8 1.0 1.2 1.4
A
c
ti
n
ic
fl
u
x
n
o
rm
al
iz
ed
r
a
ti
o
s
JO1D / JNO2
0E+0 1E-5 2E-5 3E-5 4E-5
JO
1 D (
s
e
c
-1 )
0E+0 2E-3 4E-3 6E-3
JNO
2
(se
c
-1 )
JNO
2
JO1D
Fig. 5. Variation of JO1D (triangles) and JNO2 (crosses) photolysis frequencies, normalized
with their values at the time of the first contact. The ratio JO1D/JNO2is also shown in purple
circles. For Fig. 5 no normalization has been made to account for solar zenith angle change
in order to demonstrate this solar zenith angle effect together with the LD effect on the JO1D/
ACPD
7, 9235–9258, 2007Effects of total solar eclipse on surface
radiation
S. Kazadzis et al.
Title Page Abstract Introduction Conclusions References Tables Figures ◭ ◮ ◭ ◮ Back Close
Full Screen / Esc
Printer-friendly Version
Interactive Discussion
EGU 9.5 10.0 10.5 11.0 11.5 12.0 12.5
TIME (U.T.C.) 0.8 0.9 1.0 1.1 1.2 1.3 1.4 1.5 1.6 1.7 1.8 R at io of D ir ec t i radi an c e ( n or m a lis e d)
675/380 nm model 675/500 nm model 675/380 nm measurements 675/500 nm measurements
9.5 10 10.5 11 11.5 12
0.9 1 1.1 1.2 1.3 1.4 1.5 1.6 1.7 1.8 675/340 nm 675/380 nm 675/440 nm 675/500 nm
crosses - measurements lines - model
time [UTC] rat io of di rec t i rr a di anc
e [
nor
m
al
is
ed]
Change of spectral ratios of direct irradiance during eclipse
ACPD
7, 9235–9258, 2007Effects of total solar eclipse on surface
radiation
S. Kazadzis et al.
Title Page
Abstract Introduction
Conclusions References
Tables Figures
◭ ◮
◭ ◮
Back Close
Full Screen / Esc
Printer-friendly Version
Interactive Discussion
EGU
350 400 450 500 550 600
0.85 0.9 0.95 1 1.05
wavelength (nm)
ET
/
ET
(F
C
)
350 400 450 500 550 600
-150 -100 -50 0
wavelength (nm)
Δ
T (
oC)
cov.=0.48[M] cov.=0.49[M] cov.=0.50[M] cov.=0.51[M] cov.=0.48[B] cov.=0.51[C]
Fig. 7. (Top) ratios of calculated ET spectra at 50% sun coverage to an ET spectrum before the start of the eclipse as derived by the Bentham measurements (red line), the CCD
measure-ments (green line) and by model calculations (dashed lines). (Bottom) Differences in effective
ACPD
7, 9235–9258, 2007Effects of total solar eclipse on surface
radiation
S. Kazadzis et al.
Title Page
Abstract Introduction
Conclusions References
Tables Figures
◭ ◮
◭ ◮
Back Close
Full Screen / Esc
Printer-friendly Version
Interactive Discussion
EGU
-2000 -1000 0
wavelength = 380nm
0 20 40 60 80 100
-2000 -1000 0
% SUN Coverage
Δ
T (
o C)
wavelength = 500nm Model CCD-LAP Microtops-ATI
Model Bentham-ATI CCD-LAP Microtops-ATI
Figure 8