Evidence for Positive Selection within the
PgiC1
Locus in the Grass
Festuca ovina
Yuan Li*, Björn Canbäck, Tomas Johansson, Anders Tunlid, Honor C. Prentice
Department of Biology, Lund University, Lund, Sweden
Abstract
The dimeric metabolic enzyme phosphoglucose isomerase (PGI, EC 5.3.1.9) plays an es-sential role in energy production. In the grassFestuca ovina, field surveys of enzyme varia-tion suggest that genetic variavaria-tion at cytosolic PGI (PGIC) may be adaptively important. In the present study, we investigated the molecular basis of the potential adaptive significance of PGIC inF.ovinaby analyzing cDNA sequence variation within thePgiC1gene. Two, complementary, types of selection test both identified PGIC1 codon (amino acid) sites 200 and 173 as candidate targets of positive selection. Both candidate sites involve charge-changing amino acid polymorphisms. On the homology-modeledF.ovinaPGIC1 3-D pro-tein structure, the two candidate sites are located on the edge of either the inter-monomer boundary or the inter-domain cleft; examination of the homology-modeled PGIC1 structure suggests that the amino acid changes at the two candidate sites are likely to influence the inter-monomer interaction or the domain-domain packing. Biochemical studies in humans have shown that mutations at several amino acid sites that are located close to the candi-date sites inF.ovina, at the inter-monomer boundary or the inter-domain cleft, can signifi-cantly change the stability and/or kinetic properties of the PGI enzyme. Molecular
evolutionary studies in a wide range of other organisms suggest that PGI amino acid sites with similar locations to those of the candidate sites inF.ovinamay be the targets of positive/balancing selection. Candidate sites 200 and 173 are the only sites that appear to discriminate between the two most common PGIC enzyme electromorphs inF.ovina: earli-er studies suggest that these electromorphs are implicated in local adaptation to diffearli-erent grassland microhabitats. Our results suggest that PGIC1 sites 200 and 173 are under posi-tive selection inF.ovina.
Introduction
The identification of the key genes and then the key mutations that underlie fitness variation is one of the central tasks in evolutionary biology [1]. Candidate genes that may be involved in fitness differences in natural populations of non-model species can often be proposed on the basis of information from earlier studies on model organisms [1]. One such candidate is the gene that codes for the dimeric enzyme phosphoglucose isomerase (PGI) (EC 5.3.1.9) [1]. PGI OPEN ACCESS
Citation:Li Y, Canbäck B, Johansson T, Tunlid A, Prentice HC (2015) Evidence for Positive Selection within thePgiC1Locus in the GrassFestuca ovina. PLoS ONE 10(5): e0125831. doi:10.1371/journal. pone.0125831
Academic Editor:Diego F. Gomez-Casati, National University of Rosario, ARGENTINA
Received:December 19, 2014
Accepted:March 25, 2015
Published:May 6, 2015
Copyright:© 2015 Li et al. This is an open access article distributed under the terms of theCreative Commons Attribution License, which permits unrestricted use, distribution, and reproduction in any medium, provided the original author and source are credited.
Data Availability Statement:All DNA sequences are available from the GenBank database (accessions KF487737-KF487766).
Funding:The study was supported by grant 621-2008-5617 (to H.C.P. and A.T.) from the Swedish Research Council (http://www.vr.se). The funders had no role in study design, data collection and analysis, decision to publish, or preparation of the manuscript.
catalyzes the reversible isomerization between glucose-6-phosphate and fructose-6-phosphate, in the glycolytic pathway [2]. Variation in PGI activity is expected to affect the activity of the glycolytic pathway, which plays a central role in the production of energy and is therefore likely to be implicated in organisms’adaptive responses to their environment.
High levels of variation in PGI enzyme electrophoretic mobility have been frequently re-ported, and significant correlations between PGI enzyme electromorphs and environmental variables, such as temperature, have been found in a wide range of organisms (reviewed in [3], [4]). Biochemical analyses in a number of species have demonstrated functional differences be-tween PGI electromorphs (e.g. [5], [6]) that are consistent with the PGI electromorph-environ-ment correlations in these species, suggesting that PGI itself may be the target of natural selection (e.g. [7], [8]).
Molecular evolutionary studies of the gene coding for PGI in both plants (e.g. [9], [10]) and animals (e.g. [11], [12]) often reveal a non-neutral pattern of DNA polymorphism, which is usually interpreted in terms of positive and/or balancing selection on PGI. Most of these stud-ies propose particular charge-changing amino acid sites as the potential targets of selection (e.g. [13]). The potentially selected amino acid sites are usually enzyme electromorph-distinc-tive (e.g. [14]). Two studies [11], [15] involving homology-modeled 3-D PGI dimeric protein structure have shown that the potentially selected sites are located in the interface between the two monomers.
The majority of in-depth studies of the adaptive significance of PGI in natural populations have been carried out on animals [4], [16]. However, a possible adaptive role for PGI has also been proposed for a number of plant species, including the grassFestuca ovinaL., which is the focus of the present study. Prentice et al. [17], [18] investigated PGI enzyme electromorph vari-ation within populvari-ations ofF.ovinain the steppe-like“alvar”grasslands on the Baltic island of Öland (Sweden). These grasslands are notable for their complex mosaic of different abiotic (edaphic) conditions, which is repeated in sites throughout the 26 000 ha area of alvar habitat in the southern part of the island. Using this naturally replicated study system, Prentice et al. [17] showed that, despite the fact that the species is wind-pollinated and outcrossing, with high levels of gene flow, enzyme electromorph frequencies at cytosolic PGI (PGIC) in samples ofF. ovinawere significantly related to local microhabitat variation—suggesting local adaptation. The fact that electromorph frequencies at PGIC changed, as predicted, after a nine-year experi-mental manipulation of the alvar habitat conditions [18], provided additional support for an adaptive role for PGIC variation inF.ovina[18].
In diploid [19] SwedishF.ovina, PGIC is coded for by two loci [20]: thePgiC1locus is pres-ent in allF.ovinaindividuals whereas the functional version of thePgiC2locus, which has been acquired from the genusPoa[21], [22], occurs in low frequencies in some populations [23]. The two most common PGIC enzyme electromorphs (EMs 1 & 2), are predominantly coded for byPgiC1(unpublished data), and show significant associations with fine-scale environmen-tal variables in the Öland grasslands [17], [18].
The present study further explores the possible adaptive significance of the PGIC variation
inF.ovinaby examining the cDNA sequences of thePgiC1gene. We used two,
important; and(3)that the selected charge-changing polymorphisms will differentiate between the PGIC enzyme electromorphs that have earlier been shown to exhibit significant frequency differences between different microhabitats.
Results
PgiC1cDNA, from 15F.ovinaindividuals sampled from different microhabitats on the Baltic island of Öland (Sweden) (Table 1), was PCR-amplified, cloned and sequenced (in both for-ward and reverse directions). In total, we identified 30PgiC1cDNA sequences (GenBank ac-cession numbers: KF487737-KF487766) from the 15 analyzed individuals: these sequences belong to 22 haplotypes (Hap1-22;S1 File,S1 Table). In the analyzed material, a particular PgiC1haplotype may occur in several individuals, but the twoPgiC1sequences from the same (diploid, [19]) individual always belong to two different haplotypes (S1 Table).
With the exception of Hap22, all identifiedPgiC1sequences cover 1 633 bp (nucleotide po-sitions 19 to1 651) out of the 1 701 bpF.ovinafull-lengthPgiC1cDNA sequence (as character-ized by Vallenback, Ghatnekar and Bengtsson [22]), and translate into a polypeptide of 544 amino acid residues. An insertion of 113 bp between exon1 and exon2 was found in Hap22. This insertion is almost identical (1-bp difference) to intron 1 in the publishedPgiC1gene se-quence with GenBank acc. no. HQ616103 [22]. Hence this insertion is likely to reflect incom-plete splicing of thePgiC1precursor mRNA. Hap 22 was only present in individual 10 and, when the inserted intron sequence was removed, its sequence was identical to that of Hap10. Subsequent analyses were based on the 29 identifiedPgiC1sequences (excluding Hap22).
A high level of nucleotide variation was detected within thePgiC1gene. Alignment of the 29 PgiC1cDNA sequences revealed 89 mutations at 88 polymorphic sites. Twenty six of the poly-morphic sites were singleton sites. Sixty seven of the mutations were synonymous and 22 were nonsynonymous. Three variants, all of which were synonymous, were found at nucleotide
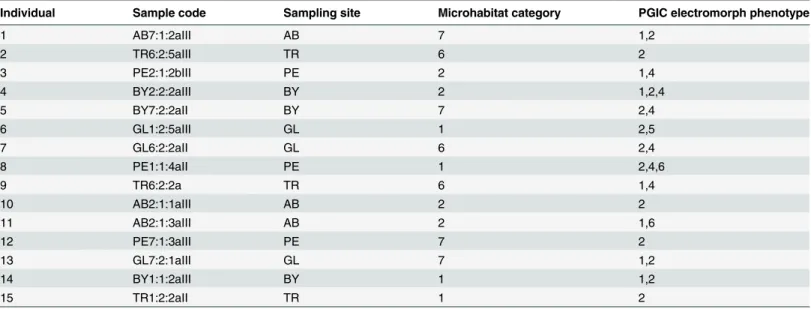
Table 1. Festuca ovinaindividuals analyzed.
Individual Sample code Sampling site Microhabitat category PGIC electromorph phenotype
1 AB7:1:2aIII AB 7 1,2
2 TR6:2:5aIII TR 6 2
3 PE2:1:2bIII PE 2 1,4
4 BY2:2:2aIII BY 2 1,2,4
5 BY7:2:2aII BY 7 2,4
6 GL1:2:5aIII GL 1 2,5
7 GL6:2:2aII GL 6 2,4
8 PE1:1:4aII PE 1 2,4,6
9 TR6:2:2a TR 6 1,4
10 AB2:1:1aIII AB 2 2
11 AB2:1:3aIII AB 2 1,6
12 PE7:1:3aIII PE 7 2
13 GL7:2:1aIII GL 7 1,2
14 BY1:1:2aIII BY 1 1,2
15 TR1:2:2aII TR 1 2
NOTES.—Sample code is the collecting code for each individual. Sampling sites are located in the alvar grasslands of Öland, Sweden, from south to
north: Albrunna (AB) 56° 190N/16° 250E, Penåsa (PE) 56° 260N/16° 270E, Gösslunda (GL) 56° 290N/16° 300E, Bårby alvar (BY) 56° 310N/16° 290E and
Torrör (TR) 56° 340N/16° 340E. Microhabitat categories are 1 (low pH, moist), 2 (low pH, dry), 6 (high pH, dry) and 7 (high pH, moist). PGIC electromorph
phenotypes were scored as in Prentice et al. [17], [18].
position 282. The total nucleotide diversity (π, [25]) was 0.01211, and Watterson’s estimator of
the population mutation rate,θW[26] per site was 0.01372.
Candidate targets of positive selection
Two complementary types of approach, one with a phylogenetic basis (HyPhy [27], [28] and PAML [29]) and one with a population genetics basis (omegaMap [30]), were used to test for positive selection atPgiC1. Together, these analyses suggest that codon (amino acid) sites 200 and 173 represent good candidate targets of positive selection.
A signal of positive selection was found for the non-recombinant cDNA sequence fragment spanning nucleotide positions 562–855, using the two nested tests (M1a + M2a and M7 + M8) in PAML. The“selection”models (M2a/M8) fit the data significantly better than the“neutral” models (M1a/M7) (Table 2), and the superior performance of the selection models in fitting the data was attributable to one codon site (200) that was a strong candidate for positive selec-tion (Table 2). The candidateship of site 200 as a target of positive selection was also supported by omegaMap (Table 2) (the posterior probability of positive selection on site 200 is 1), and by the Random Effects Likelihood (REL) method in HyPhy (Table 2). In addition, the REL meth-od also suggested positive selection on cmeth-odon site 173 (Table 2), as did omegaMap and selection models M2a and M8 in PAML (Table 2). However, in omegaMap, the posterior probability for positive selection on site 173 is only 0.66, and in PAML the selection model and the neutral model gave similar results for the non-recombinantPgiC1cDNA sequence segment spanning nucleotide positions 196–561 (Table 2), where codon site173 is located.
The amino acid polymorphisms at both candidate sites 173 and 200 involve a charge change (Table 3). At site 173, two amino acid residues were detected in the 15 studiedF.ovina individ-uals: one residue (Glu) has a negatively charged side chain, whereas the side chain of the other residue (Gln) is polar and uncharged. At site 200, one (Asp) of the three detected residues also
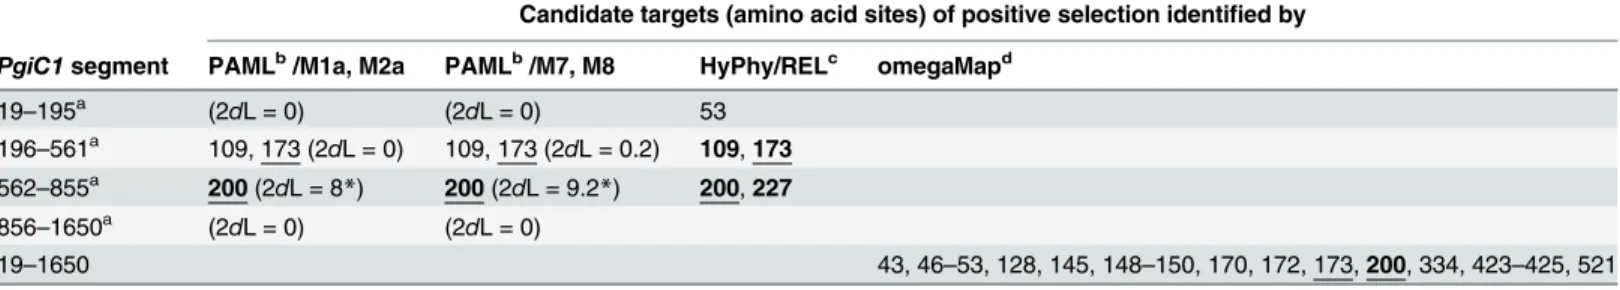
Table 2. Tests for positive selection usingω-ratio tests: candidate amino acid sites identified by all theω-ratio tests are underlined.
Candidate targets (amino acid sites) of positive selection identified by
PgiC1segment PAMLb/M1a, M2a PAMLb/M7, M8 HyPhy/RELc omegaMapd
19–195a (2dL = 0) (2dL = 0) 53
196–561a 109, 173 (2dL = 0) 109, 173 (2dL = 0.2) 109,173
562–855a 200(2dL = 8*) 200(2dL = 9.2*) 200,227
856–1650a (2dL = 0) (2dL = 0)
19–1650 43, 46–53, 128, 145, 148–150, 170, 172, 173,200, 334, 423–425, 521
aAll the PAML and HyPhy analyses were run on four non-recombinantPgiC1segments that are delimited on the basis of the three recombinant
breakpoints (nucleotide positions 195, 561 and 855) identified by GARD.
bWithin the PAML package, two nested tests, each including one neutral (M1a/M7) and one selection model (M2a/M8), were used to test for selection.
Within each of the two nested tests, 2dL is the likelihood-ratio statistic used to test whether the selection modelfits the data significantly better than the neutral model (df = 2).
Candidate targets of positive selection identified in M2a, M8 are those with posterior probabilities>50% in Bayes Empirical Bayes analyses. Sites with
posterior probabilities>99% are indicated in bold text. *: 0.01<p<0.05.
cThe model REL within the Hyphy package was used to test for selection. Candidates targets of positive selection are those with Bayes factors>50,
candidates with Bayes factors larger than 500 are shown in bold text.
dCandidate targets of positive selection identi
fied in omegaMap are those with posterior probabilities>50%. Sites with posterior probabilities>99% are
shown in bold text.
Table 3. Amino acid polymorphism among the 29 translated PGIC1 amino acid sequences fromF.ovina.
2 3 5 6 7 8 9 14 18 19 20 22
Hap pI Ind Ind EM
43 47 48 49 53 64 109 128 145 149 150 170 173 200 227 334 423 425 452 474 521
Consensus A G I Y A K H Q P V V T E D I G T S S F Q
Hap1 6.89 1 1,2 - - - N - - - E D - - - T - L
-Hap1 6.89 9 1,4 - - - N - - - E D - - - T - L
-Hap13 6.89 3 1,4 - - - - S - N - - - E D - - -
-Hap14 6.89 3 1,4 - - - - S - N - - - E D L - - -
-Hap8 6.89 6 2,5 - - - N - - - E D - - -
-Hap3 6.93 9 1,4 - - - R - - - E D - - -
-Hap17 6.93 11 1,6 - - - E D - - -
-Hap20 6.93 13 1,2 - - - E D - - -
-Hap21 6.93 14 1,2 - - - E D - - -
-Hap5 6.96 4 1,2,4 - - V H S - - - E D - - A - - -
-Hap4 7.05 8 2,4,6 - S - - - - N - - - E N L - - - G -
-Hap16 7.05 11 1,6 - - - N - - - E N - - -
-Hap9 7.07 6 2,5 - - - - S - - - Q D - - A - - -
-Hap6 7.07 7 2,4 - - - Q D - - A - - -
-Hap6 7.07 15 2 - - - Q D - - A - - -
-Hap15 7.07 10 2 - - - Q D - A - - - -
-Hap15 7.07 15 2 - - - Q D - A - - - -
-Hap19 7.07 12 2 - - V H S - N - - - Q D - - -
-Hap7 7.07 7 2,4 - - - E G - - -
-Hap7 7.07 13 1,2 - - - E G - - -
-Hap2 7.07 1 1,2 - - - Q - - - E G - - -
-Hap2 7.07 8 2,4,6 - - - Q - - - E G - - -
-Hap2 7.07 4 1,2,4 - - - Q - - - E G - - -
-Hap2 7.07 2 2 - - - Q - - - E G - - -
-Hap2 7.07 14 1,2 - - - Q - - - E G - - -
-Hap10 7.07 5 2,4 - - - I A E D - - - R
Hap18 7.07 12 2 - - - E N - - -
-Hap12 7.11 2 2 V - - - H - - - - E N - - -
-Hap11 7.21 5 2,4 - - - N - - I - - Q G - - -
-NOTES.—The exon number is shown in thefirst row of the table header. The vertically arranged numbers in the second row of the table header indicate
the location of each polymorphic amino acid site. Thefirst row beneath the table header is the consensus sequence, where each amino acid represents the most frequent residue in the alignment at each position. Each of the subsequent rows represents a single predicted amino acid sequence; for each sequence (apart from the consensus sequence), Hap = haplotype, pI = isoelectric point (predicted from the translated haplotype sequence using Protein calculator v3.3http://www.scripps.edu/~cdputnam/protcalc.html), Ind = theF.ovinaindividual from which the sequence was derived, Ind EM = the PGIC enzyme electromorph phenotype (coded for by thePgiC1andPgiC2loci) of the individual. Apart from the consensus sequence, all the sequences are listed in ascending order of predicted pI values. Dashes (-) within a sequence indicate that the amino acid residue at a polymorphic site is the same as in the consensus sequence. The negatively charged residues at the selected polymorphic amino acid sites 173 and 200 are shown in bold italics. In the column Ind EM, bold italics indicate: EM 1 in the sequences with negatively charged residues at both sites 173 and 200; EM 2 in sequences with negatively charged residue at either sites 173 or 200, but not at both sites.
has a negatively charged side chain, while the other two residues have either an aliphatic (Gly) or an uncharged polar side chain (Asn).
The possible functional importance of the candidate targets for selection
To examine the possible functional importance of the two selection-candidate amino acid sites in PGIC1, we homology-modeled the dimeric protein structure of the translated amino acid se-quence ofPgiC1. The homology-modeled PGIC1 protein structure forF.ovinain the present study is closely similar to the structure reported in earlier studies of PGI (e.g. [31]), with only 0.45 Å root-mean-square deviations for the backbone atoms from the template Toxoplasma 3ujh.pdb structure. Within the functional, dimeric PGI unit (seeFig 1A), each of the two monomers contains two main regions (the“small”and“large”domains [32], [33], correspond-ing, respectively, to amino acid sites 114–290 and 317–509 inF.ovinaPGIC1) (Fig 1B). The ac-tive site, where the substrate binds and the isomerization reaction takes place, is partially located in the slight cleft between the large and small domains in each monomer [34] (Fig 1B).
On the basis of the locations of the candidate sites in the homology-modeled PGIC1 3-D structure, it can be predicted that amino acid changes at the sites are likely to influence the inter-monomer interaction or the packing of the two domains within each monomer.
Site 200 is located on the edge of the inter-monomer boundary (Fig 1A), and is close to two basic residues (Fig 1C): Lys199 is located on the same monomer as site 200, whereas Lys179 is located on the other monomer. The presence of the acidic residue Asp (as opposed to the non-charged Asn and Gly,Table 3) at candidate site 200 is expected to result in inter-monomer charge-charge interactions with the basic residues Lys199 and Lys179 that may be important for the stability of the PGIC1 dimeric complex. The electrostatic attraction between Asp200 and Lys179 is likely to confer dimeric stability by compensating for the repulsion between Lys179 and Lys199.
The location of site 173 is on the edge of the slight cleft between the two domains within each PGIC1 monomer (Fig 1B): the site is situated within the small domain, close to Lys297 (Fig1Dand1E) which is found on the interconnecting polypeptide between the two domains of a PGIC1 monomer. The polymorphism at site 173 involves Gln and Glu (Table 3). Whereas a hydrogen bond between Gln173 and Lys297 (Fig 1D) is predicted by the DeepView-Swiss-PdbViewer, no such bond is predicted with Glu173 (Fig 1E), although an electrostatic attractive interaction may occur between Glu173 and Lys297. Both the alternative residues at site 173 in-teract with Lys297 and differences in the strength of their predicted inin-teractions with Lys297 may have important consequences for domain-domain packing.
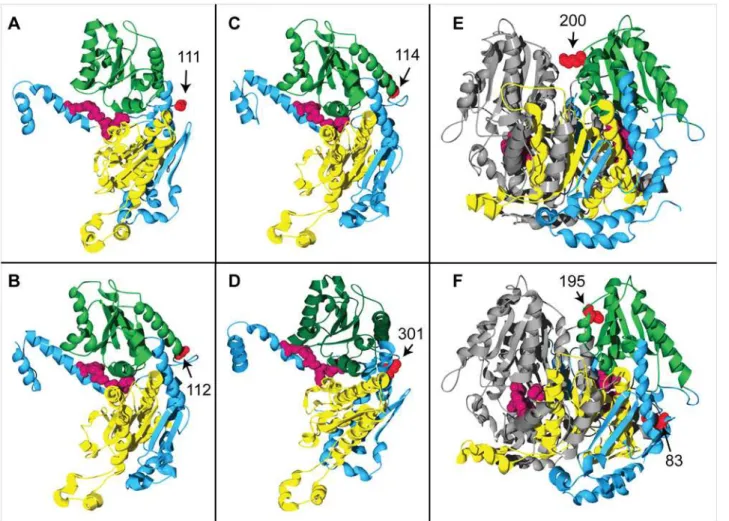
For comparative purposes, the 3-D protein structural locations of the PGI amino acid sites that have been proposed as candidate targets of positive/balancing selection in previous molec-ular evolutionary studies of thePgigene are summarized inTable 4. More than a third (5 out of 12) of the proposed selected sites have locations that are similar to those of the candidate sites inF.ovina(Table 4,Fig 2). Four human PGI amino acid sites, mutations at which have been shown, by biochemical studies, to significantly change the stability and/or kinetics of the PGI enzyme [36], [37], also have locations that are similar to those of the candidate sites identi-fied in the present study (Table 4,Fig 2).
Relationships between the candidate targets of positive selection and
enzyme electromorphs
Fig 1. Homology-modeled 3-D structure ofF.ovinaPGIC1 and the candidate targets of positive selection.(A) A PGIC1 dimer, with the two monomers shown in green and yellow, respectively. The candidate sites 200 and 173 (space-filled, orange) are mapped onto one of the monomers. Site 200 is located on the edge of the inter-monomer boundary. Shown in the active sites are the four most conserved PGI residues (equivalent to Lys516, Glu360, His391 and Arg274 inF.ovina) [35] (space-filled, magenta). (B) A PGIC1 monomer showing that the candidate site 173 (space-filled, orange) is located on the edge of the cleft between the small (green) and large (yellow) domains. The active site is partially located within the cleft. The two domains are interconnected by a single polypeptide (Domain connection: dark blue). (C)-(E) Local structures showing that the charge changes at the candidate sites may affect the inter-monomer interaction or the domain-domain packing. (C) Shows all the residues occurring within a distance of 6Åfrom the candidate site 200 (space-filled,
orange). The acidic Asp200 is adjacent to two basic residues: Lys199 (space-filled, green) is located in the same monomer (monomer I, green) as Asp200; Lys179 (space-filled, yellow) is in the opposite monomer (monomer II, yellow). (D) & (E) Show all the residues occurring within a distance of 6Åfrom the candidate site 173 (space-filled, orange) which is located on the small domain (green). Site 173 is close to Lys297 (space-filled, dark blue) which is located on the domain connection (dark blue). When the amino acid variant at the candidate site 173 is Gln, a hydrogen bond (magenta dotted line, panel (D)) is predicted between Gln173 and Lys297 by the DeepView/Swiss-PdbViewer.
polypeptides. Firstly, because only 96% of the full-lengthPgiC1cDNA is covered by each se-quence and, secondly, because of the complication that electromorph phenotypes include en-zyme products that may also be coded for by the second locus (PgiC2) that codes for PGIC inF. ovina[20]. However, when we examine the combination of charged/uncharged amino acid resi-dues at the two PGIC1 candidate sites within each translated amino acid sequence, and the PGIC EMs present in the individual to which each sequence belongs, there is a correspondence be-tween the residue combinations at the candidate sites and the PGIC EMs (Table 3).
The translated PGIC1 amino acid sequences with acidic amino acid residues at both sites 173 and 200 are mostly found in individuals with PGIC enzyme electromorph EM 1 (Table 3). For example, amino acid sequences translated from Hap1, which have the acidic Glu at site 173 and the acidic Asp at site 200, are found in individuals 1 (EM phenotype = 1,2) and 9 (EM phe-notype = 1,4): these two individuals only share EM 1 (Table 3). Amino acid sequences translat-ed from other haplotypes, which have an acidic residue at either site 173 or 200, but not at both sites, are more often found in individuals containing EM 2 (Table 3). For example, haplotypes Hap2, Hap6, Hap12, Hap15, Hap18 and Hap19 must code for EM 2, because one or two of
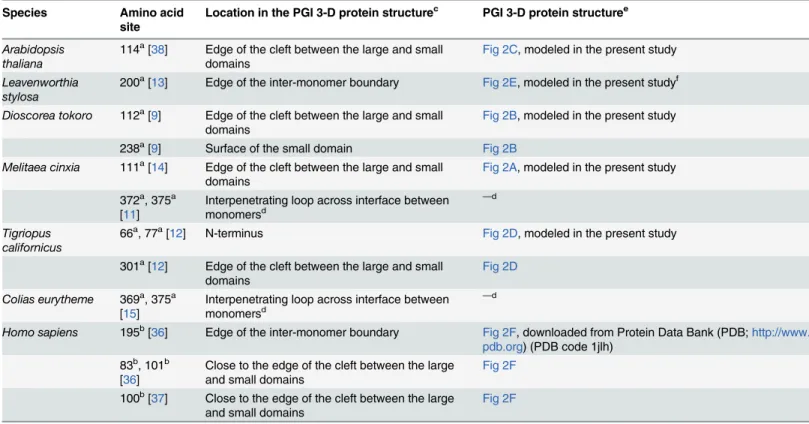
Table 4. 3-D structural locations of PGI amino acid sites in a range of organisms.
Species Amino acid site
Location in the PGI 3-D protein structurec PGI 3-D protein structuree
Arabidopsis thaliana
114a[38] Edge of the cleft between the large and small
domains
Fig 2C, modeled in the present study
Leavenworthia stylosa
200a[13] Edge of the inter-monomer boundary Fig 2E, modeled in the present studyf
Dioscorea tokoro 112a[9] Edge of the cleft between the large and small
domains
Fig 2B, modeled in the present study
238a[9] Surface of the small domain Fig 2B
Melitaea cinxia 111a[14] Edge of the cleft between the large and small
domains Fig 2A, modeled in the present study
372a, 375a
[11] Interpenetrating loop across interface betweenmonomersd —d
Tigriopus californicus
66a, 77a[12] N-terminus Fig 2D, modeled in the present study
301a[12] Edge of the cleft between the large and small
domains Fig 2D
Colias eurytheme 369a, 375a
[15] Interpenetrating loop across interface betweenmonomersd —d
Homo sapiens 195b[36] Edge of the inter-monomer boundary Fig 2F, downloaded from Protein Data Bank (PDB;http://www.
pdb.org) (PDB code 1jlh) 83b, 101b
[36] Close to the edge of the cleft between the largeand small domains Fig 2F 100b[37] Close to the edge of the cleft between the large
and small domains Fig 2F
aAmino acid sites that have been proposed as being potential targets of selection.
bFour functionally important human PGI amino acid sites that share similar locations to the two candidate targets of positive selection inF.ovinaare also
included in the table [36], [37].
cThe location of the amino acid site was identified in the present study, but seed
dThe locations of the amino acid sites 372 and 375 inM.cinxiaand of the sites 369 and 375 inC.eurythemewere identi
fied in earlier studies [11], [15].
ePGI 3-D protein structures that have been used, in the present study, for identifying the locations of the amino acid sites listed in the second column. fBecause the majority of the PGI amino acid sequence is not available forL.stylosa, the homology-modeled PGI 3-D structure from the relatedL.crassa
was used as a proxy (seeMaterial and Methods).
these six haplotypes occurred in each of the individuals 2, 10, 12 and 15, which are homozy-gotes for EM 2.
Discussion
Earlier studies ofF.ovinasuggest that PGIC enzyme variation may be involved in the species’ adaptive response to diverse microhabitats [17], [18]. The present study ofPgiC1cDNA se-quences inF.ovinaused two, complementary, types of approach to test for positive selection on PGIC1. Both approaches identified PGIC1 amino acid sites 200 and 173 as candidate targets of positive selection. The polymorphism at both sites 173 and 200 involves charge changes. On the homology-modeled PGIC1 protein structure, the two candidate sites are located on the edge of either the inter-monomer boundary or the inter-domain cleft. Investigation of local ho-mology-modeled PGIC1 structure showed that the charge changes at the candidate sites are likely to influence the inter-monomer interaction or the domain-domain folding. Furthermore,
Fig 2. 3-D structural locations of PGI amino acid sites in a range of organisms.In panels (A)-(E), the amino acid sites shown in red are those that have been proposed as the potential targets of positive/balancing selection in (A)Melitaea cinxia(site 111 [14]), (B)Dioscorea tokoro(site 112 [9]), (C)Arabidopsis thaliana(site 114 [38]), (D)Tigriopus californicus(site 301 [12]) and (E)Leavenworthia stylosa(site 200 [13]): the sites are located on the edge of either the inter-monomer boundary or the inter-domain cleft. In panel (F), amino acid sites shown in red are those at which mutation has been shown to significantly alter the activity of PGI inHomo sapiens[36] (for the sake of simplicity, only two of the four sites listed inTable 4are shown here: site 83 is located close to the edge of the inter-domain cleft, while site 195 is located on the edge of the inter-monomer boundary). The four most conserved residues in the active site [35] are indicated in dark magenta in all the panels. The small and large domains, in the PGI monomers in panels (A)-(D) and in one of the two PGI monomers in panels (E) and (F), are shown in dark green and yellow, respectively; the remaining monomer in each of panels E and F is shown in grey.
the two candidate target sites for positive selection are the only sites that appear to be diagnos-tic for the two most common PGIC enzyme electromorphs inF.ovina, which have earlier been shown to have significant allele frequency differences in different grassland microhabitats. Our results provide support for the suggestion that PGIC1 amino acid sites 200 and 173 inF.ovina are under positive selection.
Locations of the candidate selected sites in the homology-modeled
PGIC1 3-D protein structure
The two amino acid sites that are identified as candidate targets of positive selection in the present study are not randomly distributed within the PGIC1 protein structure. 3-D protein structure homology modeling in the present study shows that the locations of the two candi-date sites inF.ovinaPGIC1 are similar to those of PGI amino acid sites that have either been shown to significantly affect the enzyme activity of PGI or been proposed to be the potential targets of positive/balancing selection in other organisms (e.g. [13], [38]).
The structural location of the candidate site 200. The candidate site 200 inF.ovinais lo-cated on the edge of the inter-monomer boundary of the PGI dimer. Crystallographic structure analyses show that interactions between the monomers at the inter-monomer boundary are the main forces responsible for the tight association of the two monomers [32], and biochemi-cal analyses show that a mutation at the human PGI amino acid site 195 causes a 39-fold reduc-tion in the thermal stability of PGI [36]. The human PGI amino acid site 195 has a location adjacent to that of the candidate site 200 inF.ovina, on the inter-monomer boundary (Figs1A
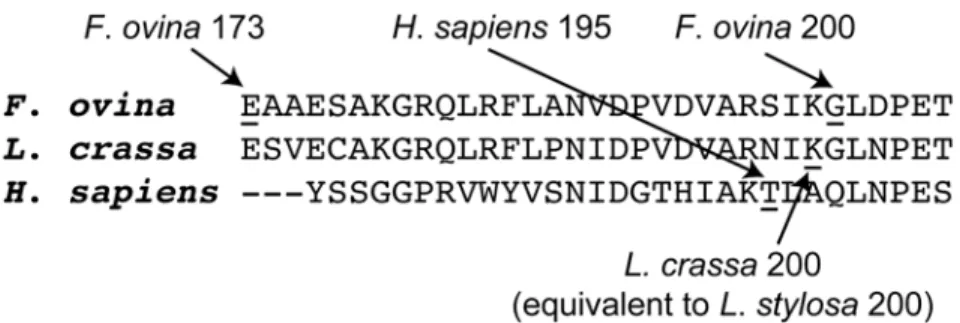
and2F). The PGI amino acid site 200 inLeavenworthia stylosa, which has been proposed as a target of balancing selection [13], also has a closely similar location to that of the candidate site 200 inF.ovina(Figs1Aand2E). The similarity between the 3-D structural locations of PGI sites 200 inF.ovina, 195 in humans and 200 inL.stylosais also reflected in the multispecies alignment of PGI amino acid sequences in the present study: PGI sites 195 in humans and 200 inL.stylosaare two, or less than two, amino acid residues away from the candidate site 200 in F.ovina(Fig 3).
The structural location of the candidate site 173. The candidate site 173 inF.ovinais lo-cated on the edge of the inter-domain cleft within each PGI monomer. The PGI active site is partially located within the inter-domain cleft [34], and mutations at three human PGI amino
Fig 3. Multi-species PGI amino acid sequence alignment around theF.ovinacandidate targets of positive selection.The multi-species alignment shows that theF.ovinaPGIC1 candidate site 200 is close to (potentially) functionally important sites in other species. TheF.ovinaPGIC1 site 200 is next to theL.stysola PGI site 200 that has been proposed as a candidate target of balancing selection [13], and is just two amino acid residues away from the human PGI site 195, a mutation at which has been shown to significantly reduce the enzyme stability of PGI [36]. The alignment includes PGI amino acid sequences fromF.ovina(Hap 2),L. crassa(GenBank protein id/gb: AF054455 [39]) andHomo sapiens(PDB code/pdb: 1jlh [40]). Because the majority of the PGI amino acid sequence is not available forL.stylosa, a sequence from the relatedL.crassa was used instead.
acid sites (83, 100, 101) that are located near to theF.ovinacandidate site 173 (Figs1Band2F,
Table 4) have been shown to be functionally important in that they lead to significant changes in the thermal stability and/or kinetic properties of human PGI [36], [37]. PGI amino acid sites 114 inArabidopsis thaliana, 111 inMelitaea cinxiaand 112 inDioscorea tokoro, which have been proposed as potential targets of selection [9], [14], [38], also have similar locations to that of the candidate site 173 inF.ovina(Figs1B,2A,2Band2C).
Charge changes at the candidate sites and relationships between the
charge changes and enzyme electromorphs
Earlier studies of enzyme variation in replicated natural populations ofF.ovina, showed that the two most common PGIC electromorphs (EMs 1 and 2) had significantly different frequen-cies in different grassland microhabitats [17], [18], suggesting that these electromorphs may be involved in local adaptation within the fine-scale habitat mosaic. In the present study, both amino acid sites that are identified as candidate targets of positive selection involve charge-changing polymorphisms, and these two sites are the only sites that appear to be diagnostic for EMs 1 and 2.
Significant correlations between PGI EMs and environmental factors have also been re-ported in a wide range of other organisms (see the references in [3], [41]). Results from studies of DNA polymorphism in a number of species suggest that there is balancing or positive selec-tion on PGI, and particular amino acid sites have been proposed as possible targets of selecselec-tion (Table 4). These proposed targets of selection typically involve charge changes and distinguish between PGI EMs, as in the present study.
The potential adaptive significance of the charge-changing amino acid polymorphisms that underlie the variation in PGI EMs has been extensively studied in the butterfly,Melitaea cinxia (e.g. [42], [43]). For example, a study by Saastamoinen and Hanski [44] of the single-nucleotide polymorphisms at the codons of the charge-changing amino acid sites (111 and 372) that iden-tify the common PGI electromorph, EM F, inM.cinxia[14] showed that individuals with ge-notypes corresponding to EM F had a higher body-surface temperature at low ambient temperatures—allowing them to start flying earlier in the morning than other genotypes. The EM F-genotype females are, therefore, able to start oviposition earlier in the afternoon and pro-duce larger clutch sizes than other genotypes.
In the present study, a combination of evidence from different sources provides support for the suggestion that the PGIC1 amino acid sites 173 and 200, which characterize the PGIC EMs 1 and 2, are under positive selection. Further studies are needed to investigate the potential adaptive significance of the polymorphism at PGIC1 sites 200 and 173 inF.ovina.
Material and Methods
Plant material
sampling sites are protected and permission was not required for the collection of the plant material.
RNA extraction, cDNA synthesis, PCR amplification, cloning and
sequencing
Total RNA was extracted from the leaves of each of the 15F.ovinaindividuals using the RNeasy Plant Mini Kit (Qiagen). cDNA was generated from the RNA preparations using the AffinityScript Multiple Temperature cDNA synthesis kit (Agilent Technologies). Ninety six percent of the full-lengthPgiC1cDNA was PCR-amplified using Phusion Hot Start II High-Fidelity DNA Polymerase (Finnzymes) and the primer pair shown inS2 Table. This amplifi-cation predominantly detected thePgiC1locus but occasionally picked upPgiC2. Sequences ofPgiC1were distinguished from those ofPgiC2using a phylogenetic analysis, including pre-viously publishedPgiC1andPgiC2reference sequences (seeS1 Figfor details). The PCR reac-tion was carried out in a total volume of 50μl, including 15μl cDNA and the standard
amounts of 5 × Phusion HF Buffer and other reagents. The PCR cycling started with an initial denaturing step at 98°C for 30 s followed by 26 cycles of a denaturing step at 98°C for 10 s, an annealing step at 67°C for 15 s and an extension step at 72°C for 45 s, and ended with a final extension step at 72°C for 10 min. The PCR product was purified with the QIAquick PCR Pu-rification Kit (Qiagen), and ligated into pCR-XL-TOPO vectors and transformed into One Shot TOP10 Chemically CompetentEscherichia colicells using the TOPO XL PCR Cloning Kit (Invitrogen). Six to 12 clones from each of the 15F.ovinaindividuals were sequenced in both forward and reverse directions (seeS2 Tablefor primers). The sequencing reactions were performed using the BigDye Terminator v. 1.1 (Applied Biosystems) and analyzed on an ABI 3130xlGenetic Analyzer (Applied Biosystems). Nucleotide sequences were assembled and aligned using Sequencer v. 4.7 (Gene Codes Corporation) and MEGA v. 4.0 [46]. The nu-cleotide diversity (π) and Watterson’s estimator of the population mutation rate (θW) were
calculated using DnaSP v. 5.10.01 [47].
Tests for positive selection
We used two, complementary, approaches to estimate thedN/dS ratio (ω) (dN=
nonsynon-ymous nucleotide substitution rate;dS= synonymous substitution rate) for identifying posi-tively selected (ω>1) codon (amino acid) sites withinPgiC1cDNA sequences. The first
(software packages PAML (version 4.5) [29] and HyPhy [27], [28]) is a phylogenetic approach. The second approach (program omegaMap [30]) has a population genetic basis (“population genetic approach”).
Theω-ratio test was originally developed for the analysis of highly divergent interspecific
se-quences [48], [49], where between-sequence differences represent substitutions that have been fixed along independent lineages [50]. Kryazhimskiy and Plotkin [51] and Mugal, Wolf and Kaj [50] show that theω-ratio test may cause bias when analyzing closely related (e.g.
conspe-cific) sequences, where the differences between sequences may represent transient polymor-phisms as well as fixed substitutions [50]. In the present study, we attempt to minimize the interference of transient polymorphisms on theω-ratio based selection tests onF.ovina PgiC1,
by combining the phylogenetic and population genetic approaches.
The phylogenetic approach uses only non-identical sequences within a non-recombinant PgiC1segment: given the assumption of the PAMLω-ratio tests that mutation rate is low [52],
the mutation rate is high inF.ovina PgiC1, a highω-ratio for a single codon might reflect a
transient polymorphism that is created by the repeated occurrence of new deleterious nonsy-nonymous mutations that will, with time, be removed by purifying selection.
The population genetic approach complements the phylogenetic approach and has the ad-vantage that it estimates the mutation and recombination rates of the sample and takes these estimates into account when calculating theω-ratio [30]. However, because the population
ge-netic approach uses random sequence samples from a population, a highω-ratio estimated for
a single codon using this approach might reflect the over-representation of a single nonsynon-ymous mutation that occurs as multiple duplicated copies in the sampled sequences.
In the present study, in order to minimize the possible effect of transient polymorphisms on the selection test withinF.ovina PgiC1, we chose to use a conservative strategy. Only sites iden-tified by both the phylogenetic and population genetic approaches were accepted as candidate targets of positive selection.
The phylogenetic approach. The phylogenetic approach to theω-ratio test uses
codon-based models as implemented in the PAML and HyPhy software packages. The models in HyPhy allow for variation in both the nonsynonymous and synonymous substitution rate among sites, whereas those in PAML only allow for variation in the nonsynonymous substitu-tion rate [53]. All theω-ratio tests in both PAML and HyPhy rely on a prior phylogenetic tree.
The phylogenetic trees used in PAML were constructed using PhyML v. 3.0 [54] and in HyPhy using the neighbor-joining algorithm [55] as implemented in the DATAMONKEY web server [27]. A high rate of recombination may interfere with the construction of phylogenetic trees [56] and thus distort the attempts to detect positive selection using phylogeny-basedω-ratio
tests [57], [58]. To deal with this problem, we first identified the putative recombination break-points using the GARD recombination-detection algorithm [59] (available at the DATAMON-KEY online server). GARD was run under the best-fitting model of nucleotide substitution, with general discrete substitution rate distribution and two rate classes [60]. We then built the phylogenetic trees and carried out theω-ratio tests on the non-identical sequences [61], [62]
within each of the non-recombinantPgiC1cDNA sequence segments that were defined on the basis of the recombination breakpoints identified by GARD. In PAML, two nested site models (M1a and M2a; M7 and M8), as implemented in the CODEML program, were used to test for positive selection. In each nested test, the neutral model (M1a/M7) has the restrictionω1, while the selection model (M2a/M8) adds one more site class withω>1. A likelihood-ratio
test (LRT) was used to test whether the neutral or the selection model better fitted the data in each nested pair (indicating the absence or presence of positive selection onPgiC1). Amino acid sites under positive selection were identified using the Bayes Empirical Bayes approach [63]. The REL method in HyPhy was further used to test for positive selection at individual amino acid sites.
The population genetic approach. The program omegaMap used in the population ge-netic approach uses a Bayesian population gege-netics approximation to the coalescent with re-combination [30]. We ran omegaMap twice on the 29PgiC1sequences, each time with 1 000 000 Markov-chain Monte Carlo iterations and thinning every 100 iterations. The first 110 000 iterations were discarded as“burn-ins”. Equal equilibrium frequencies were assumed for all co-dons, andωand the recombination rate was allowed to vary from codon to codon. A prior run
was used to decide the starting values of the model parameters (ω, the recombination rate, the
Protein structure modeling
Homology modeling of the dimeric protein structure of the translated amino acid sequence of PgiC1was carried out using the SWISS-MODEL workshop [64]. A PGI crystal structure from Toxoplasma gondii(Protein Data Bank (PDB) [65] code 3ujh, 2.10 Å), whose amino acid se-quence showed the highest sese-quence identity (55–56%) to that ofF.ovinaPGIC1 sequences, was used as a template structure. The deduced Hap2 amino acid sequence (the most common haplotype in the sampledF.ovinaindividuals) was used to model the dimeric PGIC1 protein structure. The ProSA-web server [66] was used to evaluate the overall quality of the modeled PGIC1 dimer by comparing the z-score [67], [68] calculated for the PGIC1 dimer with the z-scores for all the experimental protein structures deposited in PDB. The z-score of -10.16 for the homology-modeled PGIC1 protein structure (which has 544 amino acid residues) falls within the range of z-scores for X-ray determined structures in PDB that have a similar number of residues (S2 Fig), indicating that the quality of the modeled PGIC1 structure is satisfactory. The root-mean-square deviations for the backbone atoms between the homology-modeledF. ovinaPGIC1 protein structure and the template 3ujh.pdb structure was estimated with Deep-View/Swiss-PdbViewer v. 4.04 [69], [70].
The polymorphic PGIC1 amino acid sites that were identified as candidate targets of positive selection in the present study were mapped onto the modeled PGIC1 3-D protein structure using DeepView/Swiss-PdbViewer. In order to further investigate the potential functional importance of these polymorphic candidate sites, we used the MUTATE tool in DeepView/Swiss-PdbViewer to predict the local structural changes in the PGIC1 protein that result from the amino acid changes at the candidate sites. For example, the polymorphism at candidate site 173 involves amino acid residues Glu and Gln and, when the MUTATE tool was used to“mutate”the residue Glu173 to Gln173 in the modeled PGIC1 structure, the predicted structural changes after the “mutation”were used to assess the potential functional importance of site 173.
For comparative purposes, the PGI amino acid sites that have been proposed as being under positive/balancing selection in a range of other organisms are summarized inTable 4. The pro-posed selected sites listed inTable 4were also mapped onto the PGI 3-D protein structure using DeepView/Swiss-PdbViewer. Human PGI amino acid sites, at which mutations have been shown to significantly affect the activity of the PGI enzyme [36], [37], were also mapped onto the PGI 3-D protein structure in the present study, but only those sites with similar loca-tions to the candidate sites identified in the present study are shown inTable 4.
The same homology-modeling approach that was used to model 3-D protein structures forF.ovinaPGIC1 in the present study was used to identify the locations of the proposed se-lected amino acid sites inL.stylosa,D.tokoro,A.thaliana,M.cinxiaandTigriopus californi-cus(seeTable 4). No experimental PGI 3-D protein structures are available for these five species and not all the proposed selected amino acid sites listed for these species inTable 4
structures. The PDB codes for the template structures are 3ujh forL.crassa,D.tokoroandA. thaliana, and 1gzd forM.cinxiaandT.californicus.
Supporting Information
S1 Fig. Maximum likelihood tree of the 36PgiCexpressed sequence variants (S1 Table) from
F.ovina.Sequence variants Nos.1-22 (S1 Table) are identified by the codes for the corresponding haplotypes (Hap1—Hap22;S1 Table); the remaining sequence variants are identified by num-bers (Nos. 23–36). The ML tree was inferred using PhyML software [54]: indels were not consid-ered. Only bootstrap values larger than 50 are shown. Four earlier publishedF.ovina PgiC1 sequences and oneF.ovina PgiC2sequence, as well as onePgiCsequence from each ofBromus sterilis,Poa palustrisandF.altissima(GenBank acc. nos., in order, are DQ225734, DQ225732, DQ22735 and DQ225731, HQ616105, DQ225730, HQ616102, DQ225740) were also included in the analysis.B.steriliswas used as an outgroup. All the 36 sequence variants group together with the fourF.ovina PgiC1sequences (indicated by arrows) into one well-supported cluster with a bootstrap value of 100 (indicated by bold, italic text), while theF.ovina PgiC2(indicated by a star) forms a separate, well-supported cluster with thePgiCsequence fromP.palustris. All the 36 sequence variants thus represent thePgiC1locus rather thanPgiC2.
(TIF)
S2 Fig. Plot of ProSA-web z-scores showing the overall quality of the six homology-mod-eled PGI 3-D protein structures.The black dots shows the z-scores [67], [68] for the PGI protein structures (Figs1and2) that were homology modeled, in the present study, for (A)F. ovina, (B)Melitaea cinxia, (C)Dioscorea tokoro, (D)Arabidopsis thaliana, (E)Leavenworthia crassaand (F)Tigriopus californicus. In each panel, the dark blue and light blue dots show, respectively, the z-scores for all protein structures determined by nuclear magnetic resonance spectroscopy and X-ray analysis and deposited in Protein Data Bank (PDB) [65]. The z-scores for the six homology-modeled PGI structures in the present study fall within the ranges of those for X-ray determined protein structures in PDB that have equivalent numbers of residues.
(TIF)
S1 File. Identification of PgiC1 cDNA sequence variants (haplotypes).
(DOCX)
S1 Table. The distribution of the 36 sequence variants identified among 113 sequenced clones, originating from the 15 studiedF.ovinaindividuals.
(DOCX)
S2 Table. Primers used for PCR amplification and sequencing ofPgiC1cDNA derived fromF.ovinaindividuals.
(DOCX)
Acknowledgments
Author Contributions
Conceived and designed the experiments: HCP AT YL. Performed the experiments: YL TJ. An-alyzed the data: YL BC. Wrote the paper: YL HCP AT BC TJ.
References
1. Ellegren H, Sheldon BC. Genetic basis of fitness differences in natural populations. Nature. 2008; 452: 169–175. doi:10.1038/nature06737PMID:18337813
2. Gillespie JH. The causes of molecular evolution. New York: Oxford University Press; 1991.
3. Riddoch BJ. The adaptive significance of electrophoretic mobility in phosphoglucose isomerase (PGI). Biol J Linn Soc Lond. 1993; 50: 1–17.
4. Wheat CW. Phosphoglucose isomerase (Pgi) performance and fitness effects among Arthropods and its potential role as an adaptive marker in conservation genetics. Conserv Genet. 2010; 11: 387–397.
5. Watt WB. Adaptation at specific loci. I. Natural selection on phosphoglucose isomerase of Colias butter-flies: biochemical and population aspects. Genetics. 1977; 87: 177–194. PMID:914029
6. Dahlhoff EP, Rank NE. Functional and physiological consequences of genetic variation at phosphoglu-cose isomerase: Heat shock protein expression is related to enzyme genotype in a montane beetle. Proc Natl Acad Sci USA. 2000; 97: 10056–10061. PMID:10944188
7. Dahlhoff EP, Fearnley SL, Bruce DA, Gibbs AG, Stoneking R, McMillan DM, et al. Effects of tempera-ture on physiology and reproductive success of a montane leaf beetle: implications for persistence of native populations enduring climate change. Physiol Biochem Zool. 2008; 81: 718–732. doi:10.1086/
590165PMID:18956974
8. Watt WB, Cassin RC, Swan MS. Adaptation at specific loci. III. Field behavior and survivorship differ-ences among Colias PGI genotypes are predictable fromin vitrobiochemistry. Genetics. 1983; 103: 725–739. PMID:17246122
9. Terauchi R, Terachi T, Miyashita NT. DNA polymorphism at thePgilocus of a wild yam,Dioscorea tokoro. Genetics. 1997; 147: 1899–1914. PMID:9409845
10. Li Z, Zou J, Mao K, Lin K, Li H, Liu J, et al. Population genetic evidence for complex evolutionary histo-ries of four high altitude juniper species in the Qinghai-Tibetan plateau. Evolution. 2012; 66: 831–845.
doi:10.1111/j.1558-5646.2011.01466.xPMID:22380443
11. Wheat CW, Hagg CR, Marden JH, Hanski I, Frilander MJ. Nucleotide polymorphism at a gene (Pgi) under balancing selection in a butterfly metapopulation. Mol Biol Evol. 2010; 27: 267–281. doi:10.
1093/molbev/msp227PMID:19793833
12. Schoville SD, Flowers JM, Burton RS. Diversifying selection underlies the origin of allozyme polymor-phism at the phosphoglucose isomerase locus inTigriopus californicus. PLoS One. 2012; 7: e40035. doi:10.1371/journal.pone.0040035PMID:22768211
13. Filatov DA, Charlesworth D. DNA polymorphism, haplotype structure and balancing selection in the LeavenworthiaPgiClocus. Genetics. 1999; 153: 1423–1434. PMID:10545470
14. Orsini L, Wheat CW, Haag CR, Kvist J, Frilander MJ, Hanski I. Fitness differences associated withPgi SNP genotypes in the Glanville fritillary butterfly (Melitaea cinxia). J Evol Biol. 2009; 22: 367–375. doi:
10.1111/j.1420-9101.2008.01653.xPMID:19032494
15. Wheat CW, Watt WB, Pollock DD, Schulte PM. From DNA to fitness differences: sequences and struc-tures of adaptive variants of Colias phosphoglucose isomerase (PGI). Mol Biol Evol. 2006; 23: 499–512. PMID:16292000
16. Watt WB. Mechanistic studies of butterfly adaptations. In: Boggs C. L., Watt W. B. and Ehrlich P. R., ed-itors. Butterflies: Ecology and evolution taking flight. Chicago: The University of Chicago Press; 2003. pp. 319–352.
17. Prentice HC, Lönn M, Lefkovitch LP, Runyeon H. Associations between allele frequencies inFestuca ovinaand habitat variation in the alvar grasslands on the Baltic island of Öland. J Ecol. 1995; 83: 391–402.
18. Prentice HC, Lönn M, Lager H, Rosén E, van der Maarel E. Changes in allozyme frequencies in Fes-tuca ovinapopulations after a 9-year nutrient/water experiment. J Ecol. 2000; 88: 331–347.
19. Turesson G. Studien überFestuca ovinaL. II. Chromosomenzahl und viviparie. Hereditas. 1930; 13: 177–184.
21. Vallenback P, Jaarola M, Ghatnekar L, Bengtsson BO. Origin and timing of the horizontal transfer of a PgiCgene fromPoatoFestuca ovina. Mol Phylogenet Evol. 2008; 46: 890–896. doi:10.1016/j.ympev.
2007.11.031PMID:18226929
22. Vallenback P, Ghatnekar L, Bengtsson BO. Structure of the natural transgenePgiC2in the common grassFestuca ovina. PLoS One. 2010; 5: e13529. doi:10.1371/journal.pone.0013529PMID: 20976007
23. Vallenback P, Bengtsson BO, Ghatnekar L. Geographic and molecular variation in a natural plant trans-gene. Genetica. 2010; 138: 355–362. PMID:20128113
24. Richardson BJ, Baverstock PR, Adams M. Allozyme electrophoresis: a handbook for animal systemat-ics and population studies. New York: Academic Press; 1986.
25. Nei M. Molecular evolutionary genetics. New York: Columbia University Press; 1987.
26. Watterson GA. On the number of segregating sites in genetical models without recombination. Theor Popul Biol. 1975; 7: 256–276. PMID:1145509
27. Kosakovsky-Pond SL, Frost SDW. Datamonkey: rapid detection of selective pressure on individual sites of codon alignments. Bioinformatics. 2005; 21: 2531–2533. PMID:15713735
28. Kosakovsky-Pond SL, Muse SV. HyPhy: hypothesis testing using phylogenies. Bioinformatics. 2005; 21: 676–679. PMID:15509596
29. Yang Z. PAML 4: Phylogenetic analysis by maximum likelihood. Mol Biol Evol. 2007; 24: 1586–1591.
PMID:17483113
30. Wilson DJ, McVean G. Estimating diversifying selection and functional constraint in the presence of re-combination. Genetics. 2006; 172: 1411–1425. PMID:16387887
31. Read J, Pearce J, Li X, Muirhead H, Chirgwin J, Davies C. The crystal structure of human phosphoglu-cose isomerase at 1.6Åresolution: implications for catalytic mechanism, cytokine activity and haemoly-tic anaemia. J Mol Biol. 2001; 309: 447–463. PMID:11371164
32. Shaw PJ, Muirhead H. Crystallographic structure analysis of glucose 6-phosphate isomerase at 3.5Å
resolution. J Mol Biol. 1977; 109: 475–485. PMID:833853
33. Wang B, Watt WB, Aakre C, Hawthorne N. Emergence of complex haplotypes from microevolutionary variation in sequence and structure of Colias phosphoglucose isomerase. J Mol Evol. 2009; 68: 433–447. doi:10.1007/s00239-009-9237-2PMID:19424742
34. Shaw PJ, Muirhead H. The active site of glucose phosphate isomerase. FEBS Lett. 1976; 65: 50–55.
PMID:945194
35. Jeffery CJ, Hardré R, Salmon L. Crystal structure of rabbit phosphoglucose isomerase complexed with 5-phospho-D-arabinonate identifies the role of Glu357 in catalysis. Biochemistry. 2001; 40:
1560–1566. PMID:11327814
36. Lin HY, Kao YH, Chen ST, Meng M. Effects of inherited mutations on catalytic activity and structural sta-bility of human glucose-6-phosphate isomerase expressed inEscherichia coli. BBA Proteins and prote-omics. 2009; 1794: 315–323. doi:10.1016/j.bbapap.2008.11.004PMID:19064002
37. Somarowthu S, Brodkin HR, D'Aquino JA, Ringe D, Ondrechen MJ, Beuning PJ. A tale of two isomer-ases: compact versus extended active sites in ketosteroid isomerase and phosphoglucose isomerase. Biochemistry. 2011; 50: 9283–9295. doi:10.1021/bi201089vPMID:21970785
38. Kawabe A, Yamane K, Miyashita NT. DNA polymorphism at the cytosolic phosphoglucose isomerase (PgiC) locus of the wild plantArabidopsis thaliana. Genetics. 2000; 156: 1339–1347. PMID:11063706
39. Liu F, Charlesworth D, Kreitman M. The effect of mating system differences on nucleotide diversity at the phosphoglucose isomerase locus in the plant genus Leavenworthia. Genetics. 1999; 151: 343–357. PMID:9872972
40. Cordeiro AT, Godoi PHC, Silva CHTP, Garratt RC, Oliva G, Thiemann OH. Crystal structure of human phosphoglucose isomerase and analysis of the initial catalytic steps. Biochim Biophys Acta. 2003; 1645: 117–122. PMID:12573240
41. Watt WB. Specific gene studies of evolutionary mechanisms in an age of genome-wide surveying. Ann N Y Acad Sci. 2013; 1289: 1–17. doi:10.1111/nyas.12139PMID:23679204
42. Niitepõld K, Smith AD, Osborne JL, Reynolds DR, Carreck NL, Martin AP, et al. Flight metabolic rate
andPgigenotype influence butterfly dispersal rate in the field. Ecology. 2009; 90: 2223–2232. PMID:
19739384
43. Kallioniemi E, Hanski I. Interactive effects ofPgigenotype and temperature on larval growth and surviv-al in the Glanville fritillary butterfly. Funct Ecol. 2011; 25: 1032–1039.
45. Bengtsson K, Prentice HC, Rosén E, Moberg R, Sjögren E. The dry alvar grasslands of Öland: ecologi-cal amplitudes of plant species in relation to vegetation composition. Acta Phytogeogr Suec. 1988; 76: 21–46.
46. Tamura K, Dudley J, Nei M, Kumar S. MEGA4: molecular evolutionary genetics analysis (MEGA) soft-ware version 4.0. Mol Biol Evol. 2007; 24: 1596–1599. PMID:17488738
47. Librado P, Rozas J. DnaSP v5: a software for comprehensive analysis of DNA polymorphism data. Bio-informatics. 2009; 25: 1451–1452. doi:10.1093/bioinformatics/btp187PMID:19346325
48. Kimura M. Preponderance of synonymous changes as evidence for the neutral theory of molecular evo-lution. Nature. 1977; 267: 275–276. PMID:865622
49. Goldman N, Yang Z. A codon-based model of nucleotide substitution for protein-coding DNA se-quences. Mol Biol Evol. 1994; 11: 725–736. PMID:7968486
50. Mugal CF, Wolf JB, Kaj I. Why time matters: Codon evolution and the temporal dynamics of dN/dS. Mol Biol Evol. 2014; 31: 212–231. doi:10.1093/molbev/mst192PMID:24129904
51. Kryazhimskiy S, Plotkin JB. The population genetics of dN/dS. PLoS Genet. 2008; 4: e1000304. doi: 10.1371/journal.pgen.1000304PMID:19081788
52. Nielsen R, Yang Z. Estimating the distribution of selection coefficients from phylogenetic data with ap-plications to mitochondrial and viral DNA. Mol Biol Evol. 2003; 20: 1231–1239. PMID:12777508
53. Kosakovsky-Pond SL, Muse SV. Site-to-site variation of synonymous substitution rates. Mol Biol Evol. 2005; 22: 2375–2385. PMID:16107593
54. Guindon S, Gascuel O. A simple, fast, and accurate algorithm to estimate large phylogenies by maxi-mum likelihood. Syst Biol. 2003; 52: 696–704. PMID:14530136
55. Saitou N, Nei M. The neighbor-joining method: a new method for reconstructing phylogenetic trees. Mol Biol Evol. 1987; 4: 406–425. PMID:3447015
56. Posada D, Crandall KA. The effect of recombination on the accuracy of phylogeny estimation. J Mol Evol. 2002; 54: 396–402. PMID:11847565
57. Shriner D, Nickle DC, Jensen MA, Mullins JI. Potential impact of recombination on sitewise approaches for detecting positive natural selection. Genet Res. 2003; 81: 115–121. PMID:12872913
58. Anisimova M, Nielsen R, Yang Z. Effect of recombination on the accuracy of the likelihood method for detecting positive selection at amino acid sites. Genetics. 2003; 164: 1229–1236. PMID:12871927
59. Kosakovsky-Pond SL, Posada D, Gravenor MB, Woelk CH, Frost SDW. GARD: a genetic algorithm for recombination detection. Bioinformatics. 2006; 22: 3096–3098. PMID:17110367
60. Kosakovsky-Pond SL, Frost SDW. A simple hierarchical approach to modeling distributions of substitu-tion rates. Mol Biol Evol. 2005; 22: 223–234. PMID:15483327
61. Nielsen R, Yang Z. Likelihood models for detecting positively selected amino acid sites and applica-tions to the HIV-1 envelope gene. Genetics. 1998; 148: 929–936. PMID:9539414
62. Kosakovsky-Pond SL, Frost SDW. Not so different after all: a comparison of methods for detecting amino acid sites under selection. Mol Biol Evol. 2005; 22: 1208–1222. PMID:15703242
63. Yang Z, Wong WSW, Nielsen R. Bayes empirical Bayes inference of amino acid sites under positive se-lection. Mol Biol Evol. 2005; 22: 1107–1118. PMID:15689528
64. Arnold K, Bordoli L, Kopp J, Schwede T. The SWISS-MODEL workspace: a web-based environment for protein structure homology modelling. Bioinformatics. 2006; 22: 195–201. PMID:16301204
65. Berman HM, Westbrook J, Feng Z, Gilliland G, Bhat T, Weissig H, et al. The protein data bank. Nucleic Acids Res. 2000; 28: 235–242. PMID:10592235
66. Wiederstein M, Sippl MJ. ProSA-web: interactive web service for the recognition of errors in three-di-mensional structures of proteins. Nucleic Acids Res. 2007; 35: W407–W410. PMID:17517781
67. Sippl MJ. Recognition of errors in three-dimensional structures of proteins. Proteins Struct Funct Genet. 1993; 17: 355–362. PMID:8108378
68. Sippl MJ. Knowledge-based potentials for proteins. Curr Opin Struct Biol. 1995; 5: 229–235. PMID:
7648326
69. Guex N, Peitsch MC. SWISS MODEL and the Swiss Pdb Viewer: an environment for comparative pro-tein modeling. Electrophoresis. 1997; 18: 2714–2723. PMID:9504803