A Mass Spectrometry-Based Assay for
Improved Quantitative Measurements of
Efflux Pump Inhibition
Adam R. Brown1, Keivan A. Ettefagh1, Daniel Todd1, Patrick S. Cole1, Joseph M. Egan1, Daniel H. Foil1, Tyler N. Graf1, Bryan D. Schindler2, Glenn W. Kaatz2, Nadja B. Cech1*
1Department of Chemistry/Biochemistry, The University of North Carolina Greensboro, Greensboro, North Carolina, United States of America,2Division of Infectious Disease, John Dingell Department of Veteran Affairs Medical Center and Department of Internal Medicine, Wayne State University School of Medicine, Detroit, Michigan, United States of America
Abstract
Bacterial efflux pumps are active transport proteins responsible for resistance to selected biocides and antibiotics. It has been shown that production of efflux pumps is up-regulated in a number of highly pathogenic bacteria, including methicillin resistantStaphylococcus aureus. Thus, the identification of new bacterial efflux pump inhibitors is a topic of great in-terest. Existing assays to evaluate efflux pump inhibitory activity rely on fluorescence by an efflux pump substrate. When employing these assays to evaluate efflux pump inhibitory ac-tivity of plant extracts and some purified compounds, we observed severe optical interfer-ence that gave rise to false negative results. To circumvent this problem, a new mass spectrometry-based method was developed for the quantitative measurement of bacterial efflux pump inhibition. The assay was employed to evaluate efflux pump inhibitory activity of a crude extract of the botanicalHydrastis Canadensis, and to compare the efflux pump in-hibitory activity of several pure flavonoids. The flavonoid quercetin, which appeared to be completely inactive with a fluorescence-based method, showed an IC50value of 75μg/mL with the new method. The other flavonoids evaluated (apigenin, kaempferol, rhamnetin, luteolin, myricetin), were also active, with IC50values ranging from 19μg/mL to 75μg/mL. The assay described herein could be useful in future screening efforts to identify efflux pump inhibitors, particularly in situations where optical interference precludes the applica-tion of methods that rely on fluorescence.
Introduction
Bacterial efflux pumps are active transport proteins that function to extrude toxic compounds, including antimicrobial drugs, from the cell. These pumps serve to protect bacteria from dam-age by toxins, and can play a role in the development of resistance to antimicrobials [1–5]. For example, it has been shown that production of efflux pumps is up-regulated in drug resistant
OPEN ACCESS
Citation:Brown AR, Ettefagh KA, Todd D, Cole PS, Egan JM, Foil DH, et al. (2015) A Mass
Spectrometry-Based Assay for Improved Quantitative Measurements of Efflux Pump Inhibition. PLoS ONE 10(5): e0124814. doi:10.1371/journal.pone.0124814
Academic Editor:Hendrik W. van Veen, University of Cambridge, UNITED KINGDOM
Received:November 11, 2014
Accepted:March 17, 2015
Published:May 11, 2015
Copyright:© 2015 Brown et al. This is an open access article distributed under the terms of the Creative Commons Attribution License, which permits unrestricted use, distribution, and reproduction in any medium, provided the original author and source are credited.
Data Availability Statement:All relevant data are within the paper and its Supporting Information files.
Funding:This research was supported by Grant Number 1 R01 AT006860 from the National Center for Complementary and Alternative Medicine (NCCAM), a component of the National Institutes of Health (NIH).
strains of many bacteria, including methicillin resistantStaphylococcus aureus[6–10]. Com-pounds that inhibit bacterial efflux pumps are of interest because of their potential to increase antimicrobial effectiveness [11]. Thus, our laboratory has been engaged in experiments to find new efflux pump inhibitors (EPIs) from natural product sources.
Current methods for evaluating efflux pump inhibitory activity rely on an efflux pump sub-strate that fluoresces only when it is located inside a cell (due to intercalation with DNA) [12]. The majority of existing protocols operate by pre-loading cells with the efflux pump substrate ethidium bromide, which gives them a high initial fluorescent intensity. The extent of efflux pump inhibition is then measured by comparing the rate of decrease in fluorescence intensity over time in the presence of varying amounts of the putative EPI [4,9,13–18]. Related experi-ments utilizing measureexperi-ments based on the intracellular accumulation of fluorescent substrates have also been reported [9,19]. For accumulation experiments, fluorescence increases over time as the substrate diffuses into cells.
Ethidium bromide is attractive as an indicator of efflux pump inhibition because of exten-sive literature precedent and also because it has been established to be active via intracellular action, with literature precedent stretching back to the 1950s [12,20,21]. However, the existing methods for testing efflux pump inhibition with ethidium bromide gave false results in our study due to matrix quenching effects (the suppression of fluorescence by various components of the mixture) in crude extracts and even with some pure compounds. We endeavored to cir-cumvent these quenching effects by developing a new mass spectrometry-based efflux pump inhibition assay. There is extensive literature support for the efflux pump inhibitory activity of flavonoids and related compounds [9–11,16,22–29]; thus, we sought to validate the new assay by comparing efflux pump inhibitory activity of a series of pure flavonoids. In addition, to test the validity of the new assay in a more crude sample matrix, we compared the efflux pump in-hibitory activity of an extract from the botanical goldenseal (Hydrastis canadensis), which is known to contain EPIs [10,16], using both fluorescence and mass spectrometry-based ap-proaches for data collection.
Materials and Methods
Preparation of plant material
The goldenseal leaf and petiole material used was cultivated in a woodland setting in Hender-sonville, North Carolina, (N 35°24.2770', W 082°20.9930', 702.4 m elevation) and was made available by William Burch; this population has been utilized in previously published work [10,16] and is represented by a voucher (NCU583414) curated in the University of North Caro-lina at Chapel Hill herbarium. The goldenseal extract was prepared using previously described methods [10,30]. Dried plant material was macerated for at least 24 hr, and the methanol ex-tract was subsequently separated from the plant material. This exex-tract was dried in a rotary evaporator to reduce the volume of methanol, and partitioned against an equal volume of hex-ane. The resulting mixture was stirred for at least one hr and the layers were collected separate-ly using a separatory funnel. The methanol partition was added to water and chloroform in a ratio of 1:5:4, stirred for at least 1 hr, then separated. The chloroform partition from this step was evaporated and used as the starting material for all experiments described herein, and will be referred to as“goldenseal extract”from this point forward.
96 well plate ethidium bromide accumulation assay
format. Activity was tested usingStaphylococcus aureusstrain NCTC 8325–4 [31]. The final assay composition was 10% DMSO, 50% Muller-Hinton broth, 40% water (by volume), an esti-mated 1.6–1.8x10⁸CFU/mLS.aureus, 1.25μg/mL ethidium bromide, and a range of analyte
concentrations. Data collection, and hence bacterial exposure to these conditions, was limited to 30 min. The alkaloid piperine was used as a positive control, as it is well established in the lit-erature to be an EPI [25,32,33]. Each analyte concentration was tested in triplicate, and the pos-itive control (a piperine dilution series ranging from 4.7μg/mL to 300μg/mL prepared via
2-fold dilution) was included on each plate. Fluorescence was measured using a BioTek Syner-gyH1 microplate reader (BioTek, Winooski, VT) with an excitation wavelength of 520 nm and emission wavelength of 600 nm at 1 min intervals for a total of 30 min. All experiments were performed in triplicate and error bars reported as standard deviation.
Use of mass spectrometry to measure ethidium bromide accumulation
To enable mass spectrometric measurements of ethidium bromide accumulation, the experi-mental parameters were identical to those described in the previous section, except that the method of data collection was modified. The prepared samples were incubated at room tem-perature in a EMD Millipore MultiScreen fritted-bottom 96-well filter plate (pore size 0.22μm,
EMD Millipore, Darmstadt, Germany). At the conclusion of the 30 min incubation period, these were filtered simultaneously under vacuum into a receiving 96 well plate. All solutions were stored at 4°C prior to analysis.
Ethidium bromide in the bacterial supernatant was analyzed using high performance liquid chromatography (HPLC) electrospray ionization-mass spectrometry (ESI-MS). Liquid chro-matography separations were achieved using a ThermoFinnigan Surveyer HPLC system (Thermo Finnigan, San Jose, CA). The autosampler was temperature controlled at 8°C, and the column (Agilent Prevail C18, 3μm packing, 50 x 2.1 mm) was heated to 40°C. Sample injection
volume was 5μL and a flow rate of 0.2 mL/min was employed. Samples were eluted using
bina-ry gradients consisting of acetonitrile acidified with 1% acetic acid and deionized water (CH3CN:H2O) as follows:—0 min, 0:100; 1.5 min, 0:100; 2 min, 95:5; 10 min, 95:5; 10.5 min, 0:100; 18 min, 0:100. Mass spectrometry analyses were conducted with an LCQ DECA XP Plus ion trap mass spectrometer with electrospray ionization source (Thermo Fisher Scientific) using the following conditions: capillary temperature, 250°C; sheath gas flow, 10 (arbitrary units); no auxiliary gas; source voltage 4.5 kV; capillary voltage, 42 V; tube lens offset, -25 V. The instrument was operated in the positive ion mode with two scan events. The first was full scan, followed by the data-dependent CID fragmentation (50% collision energy) ofm/z314.20 (the [M]+ion of ethidium). The selected ion chromatogram was plotted for the main product ionm/z286, and its peak area was determined. All experiments were performed in triplicate and error bars set to standard deviation.
Mass spectrometry data were analyzed to determine an IC50value for each test compound. The IC50of piperine was defined as the midpoint between the peak area for vehicle control and that of the 300ppm piperine sample, similar to an approach employed previously [34]. Once determined for piperine, the same peak area was used as a set point for determining IC50values of the test compounds on the same plate.
Bacterial growth inhibition
MICs were determined according to Clinical Laboratory Standards Institute guidelines [35]. Solutions were prepared in 96 well plates with a final well volume of 250μL, 2% DMSO in
one inoculated with a bacterial concentration of 5x10⁵CFU/mL, the other containing only ana-lyte and vehicle. All plates were incubated for 18 hr at 37°C, after which turbidity at 600nm (OD600) was measured with a BioTek Synergy H1 microplate reader. To correct for back-ground due to absorbance of the analyte compounds, the mean OD600for each treatment with-out addition of bacteria was subtracted from the mean OD600of treated wells. MIC was determined as the concentration where there was no statistically significant difference between the mean absorbance of the treated wells and that of the negative control (vehicle in broth).
Results and Discussion
Assay development and comparison of efflux pump inhibition assay
methods
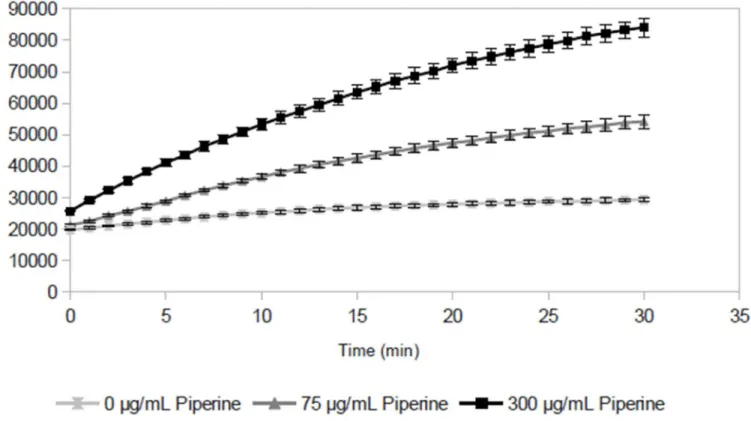
The first goal of our experiments was to determine the applicability of a fluorescence-based ac-cumulation assay to measure the efflux pump inhibitory activity of various flavonoids. Towards this goal, we first validated the assay using a known efflux pump substrate (ethidium bromide) and a known EPI (piperine). As expected, whenS.aureusis exposed to ethidium bromide, fluo-rescence increases over time (Fig 1). This increase is due to intracellular accumulation of ethid-ium, which fluoresces at 600 nm when it is intercalated with DNA [16]. Ethidium bromide is a substrate of NorA, a major chromosomally-encodedStaphylococcus aureusefflux pump [3,5]. Thus, the intracellular accumulation of ethidium bromide byS.aureusis counteracted by the
Fig 1. Change in absolute fluorescent intensity over time forStaphylococcus aureusexposed to ethidium bromide in the efflux pump inhibitor piperine.Fluorescence increases over time due to intracellular accumulation of ethidium bromide. The increase is more pronounced in the presence of piperine, which enhances intracellular accumulation of ethidium bromide by blocking efflux. Data points represent the mean of 3 samples, error bars represent standard deviation.
action of NorA (and other efflux pumps). As evidence of this, the addition of piperine, a known NorA inhibitor, caused a more pronounced increase in fluorescence over time than was observed for the cells in the absence of the inhibitor (Fig 1).
Plotting the time-dependent accumulation assay data (Fig 1) at only a single time point (30 min) allows them to be represented as a dose-response curve (Fig 2A), with mean fluores-cent intensity at one confluores-centration on the y-axis, and test compound confluores-centration on the x-axis. These curves demonstrate that ethidium bromide efflux is inhibited in the presence of pip-erine, and that this inhibition is dose-dependent (Fig 2A).
After the positive control was validated with the above methodology, the same approach was used to measure efflux inhibitory activity of several purified flavonoids. Flavonoids were chosen as test compounds because they are ubiquitous in plants, and by extension in plants that are used for food and for medicine [36,37]; and because numerous reports indicate that many flavonoids possess EPI activity [9–11,16,22–29]. Consistent with this precedent, the vonoid apigenin displayed clear evidence of efflux pump inhibition (Fig 2A). However, the fla-vonoid quercetin appeared to be inactive. The unexpected negative result for quercetin led to the suspicion that optical matrix interference (quenching of ethidium bromide fluorescence) could interfere with accurate determinations of EPI activity of some compounds. To evaluate this possibility, a series of samples was prepared that included constant concentrations (150μg/mL) of piperine, along with varying concentrations of the suspected quenching agent
quercetin (Fig 2B). It is clear that as the concentration of quercetin increases in these solutions, the overall fluorescence of the mixture decreases, presumably due to quenching. Consistent with this observation, there are many reports of quenching in fluorescence-based assays, espe-cially when plant extracts are involved [38–42].
To circumvent the problem with optical matrix interference, a method was developed using liquid chromatography—mass spectrometry (LC-MS) to measure ethidium bromide concen-trations in the spent broth filtrate. The concentration-response relationship for the data gener-ated by the LC-MS method was expected to be the inverse of that genergener-ated by the
measurement of fluorescence—as the concentration of an inhibitor increases, it traps the ethid-ium inside the bacterial cells, and the concentration of ethidethid-ium in the spent broth filtrate (as measured by LC-MS) should decrease. The known EPI piperine was again used for assay vali-dation and it was observed that, as expected, the concentration of ethidium in the filtrate de-creased with increasing concentration of piperine (Fig 3A). These results were plotted in a dose-response curve, with peak area displayed on the y-axis and concentration on the x-axis (Fig 3B).
With the LC-MS assay, it is possible to quantify the extracellular levels of ethidiumwithout relying on fluorescence. Thus, if quercetin is in fact an active EPI and the negative results ob-served in the fluorescence based assay (Fig 2) are due to quenching, quercetin should have de-monstrable activity in the new LC-MS based assay. Consistent with this expectation, the LC-MS based method showed quercetin to be active as an EPI (Fig 3B). Once the confounding effect of quenching is removed, it is apparent that quercetin is similar in its EPI activity to pip-erine, and apigenin is the most active EPI of the three. Furthermore, the LC-MS method showed a more typical dose-response relationship for apigenin (Fig 3B) compared to the fluo-rescence-based assay (Fig 2A), suggesting that apigenin quenches ethidium fluorescence at concentrations38μg/mL.
luteolin, and myricetin.) (Table 1). Piperine demonstrated an IC50value in this assay between 75μg/mL and 150μg/mL, and CCCP was the most active of all compounds tested (IC50
4.7μg/mL,Table 1).
Finally, it was of interest to evaluate whether the mass spectrometry-based efflux assay would be applicable to samples with more complex matrices. Toward this goal, a botanical ex-tract prepared from goldenseal (Hydrastis canadensis) was evaluated for EPI activity using both the fluorescence-based and mass spectrometry-based ethidium bromide accumulation as-says. When assayed by the fluorescence-based method, the extract appeared inactive (no appar-ent IC50,Fig 5A), contradicting literature that indicatesH.canadensisextracts contain EPIs [10,16]. However, when the activity of the extract was evaluated with the mass spectrometry-based assay, an IC50value of 75μg/mL was observed (Fig 5B). These results demonstrate that
quenching can hamper the measurement of efflux pump inhibition for complex extracts using fluorescence, and that the interference can be overcome using the method developed herein. This finding is particularly important given that it may be useful in drug discovery efforts to screen complex extracts for the presence of EPIs.
Potential interference by growth effects
Many botanical compounds possess antimicrobial activity. Thus, it was important to evaluate whether growth effects might confound the measurements of efflux pump inhibition. Towards this goal, the flavonoids, controls, and the goldenseal extract were screened for inhibition of bacterial growth across a range of concentrations, from 4.7μg/mL to 150μg/mL. Only three
samples, the flavonoids luteolin and myricetin, and the known EPI CCCP, demonstrated mea-sureable MICs under these conditions (Table 1). To determine whether growth inhibition by these compounds was likely to confound data interpretation, the two inhibitory flavonoids (luteolin and myricetin) were incubated with test strains under the experimental conditions at twice their IC50values (Table 1).S.aureuscells were tested for loss of viability in the presence of these flavonoids (as well as in the presence of the flavonoid apigenin which does not inhibit Fig 2. Change in fluorescence due to ethidium accumulation byS.aureusin the presence of putative inhibitors.(A) Dose-response curves for the flavonoids apigenin and quercetin. (B) Fluorescence observed for 150μg/mL piperine in the presence of increasing concentrations of quercetin. Decrease in
fluorescence with increasing quercetin concentration in (B) can be attributed to fluorescence quenching by the flavonoid. Data points represent the mean of triplicate measurements (biological replicates), error bars represent standard deviation.
doi:10.1371/journal.pone.0124814.g002
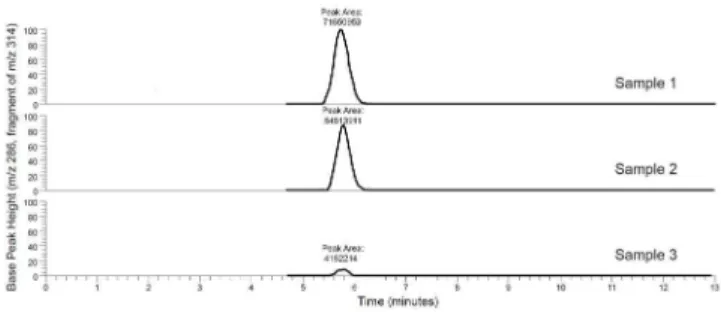
Fig 3. Representative selected chromatograms of filtered, spent broth showing a peak for the ethidium ion (MS-MS transition ofm/z314 to 286).Sample 1 is the negative control (S.aureuscultured for 30 min in Mueller Hinton broth with 1.25μg/mL ethidium bromide and 10% DMSO), samples 2 and 3 were
cultured under the same conditions as sample 1 with the addition of 75μg/mL and 300μg/mL piperine,
respectively. All three peaks are normalized to a signal intensity of 3.45 x 10⁶. As piperine is added, efflux pumps are blocked, trapping the ethidium inside the cells and decreasing the quantity of ethidium (as indicated by the area of the ethidium peak) in the spent broth.
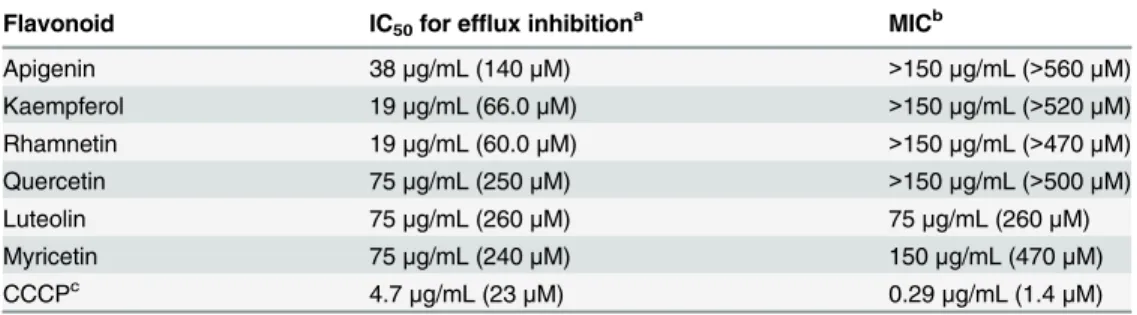
bacterial growth) by replicating the experimental conditions of bacterial, ethidium bromide, broth and DMSO content, and plating aliquots of the resulting culture onto supplemented Mueller-Hinton agar at 0, 15 and 30 min time points. No loss of viability was observed after a 30 min exposure to the experimental conditions, as determined by colony count enumeration (S1 Fig). Additionally, to further evaluate the potential for simple toxicity to confound evalua-tion of data in this assay, the commercial antibiotics gentamicin and nafcillin were subjected to Table 1. Efflux pump inhibitory activity and antimicrobial activity of flavonoids.
Flavonoid IC50for efflux inhibitiona MICb
Apigenin 38μg/mL (140μM) >150μg/mL (>560μM)
Kaempferol 19μg/mL (66.0μM) >150μg/mL (>520μM)
Rhamnetin 19μg/mL (60.0μM) >150μg/mL (>470μM)
Quercetin 75μg/mL (250μM) >150μg/mL (>500μM)
Luteolin 75μg/mL (260μM) 75μg/mL (260μM)
Myricetin 75μg/mL (240μM) 150μg/mL (470μM)
CCCPc 4.7
μg/mL (23μM) 0.29μg/mL (1.4μM)
a: Efflux pump inhibition was measured via LC-MS analysis of ethidium in spent,filtered culture supernatant after a 30 min incubation in triplicate wells.
b: Growth inhibition was measured by optical density at 600nm (in triplicate) after an 18 hr incubation. c: CCCP is an abbreviation for the compound carbonyl cyanide m-chloro-phenylhydrazone
doi:10.1371/journal.pone.0124814.t001
Fig 4. Efflux pump inhibitory activity of apigenin, piperine, and quercetin as indicated by LC-MS measurement of residual ethidium bromide in spent broth after a 30 min incubation.Relative peak area (expressed as a percentage) for ethidium is plotted as a function of concentration of the putative inhibitor. Data points represent the mean of 3 measurements (biological replicates), with error bars representing standard deviation.
Fig 5. Efflux pump inhibition inS.aureusby a goldenseal (Hydrastis canadensis) extract.(A) Data collected using the fluorescence-based ethidium accumulation assay for a range ofH.canadensisextract concentrations. (B) Data collected using the mass spectrometry-based ethidium accumulation assay. Incubation time was 30 min for both A and B, data represents mean of 3 samples, error bars represent standard deviation.
the mass spectrometry-based efflux pump inhibition assays, and no IC50was observed to the maximum concentration tested of 100μg/mL (S2 Fig). The highest tested concentration for the
antibiotics was well above their reported MICs againstStaphylococcus aureus(~0.5μg/mL
[43,44]). Collectively, these results suggest that growth inhibition does not confound the mea-surements of efflux pump inhibitory activity reported inTable 1.
Conclusions
In light of the health risks posed by the increased occurrence of antibiotic resistant bacterial strains, the need for reliable methods for their study is of high importance. The mass spectrom-etry-based method to quantitatively investigate efflux pump inhibition is just such a tool, and as such is expected to be of high value to the scientific community. Our study shows that mis-leading results (false negative in the case of assays that rely on ethidium bromide accumula-tion) can be obtained when screening crude extracts and even pure compounds with fluorescence-based efflux pump inhibition assays. The new method presented here circum-vents these problems. Additionally, the ubiquity of activity in the flavonoids tested in the vali-dation process of this assay reinforces the importance of this class of natural products in the reversal of efflux-pump mediated drug resistance.
Supporting Information
S1 Fig. Time series data evaluating the viability ofStaphylococcus aureuscultures exposed to experimental conditions.Conditions are as follows: 10% DMSO, 50% Muller-Hinton broth, 40% water (by volume), with 1.25μg/mL ethidium bromide, for a maximum of 30 min.
Test compounds include two flavonoids that inhibit the growth of this strain (luteolin and myricetin), and one that does not (apigenin) (Table 1). (EPS)
(TIF)
S2 Fig. Efflux pump inhibitory data generated via the mass spectrometry-based assay per-formed on the known antibiotic compounds gentamicin and nafcillin.Also shown is a con-trol dose-response curve performed on the positive concon-trol piperine.
(TIF)
Acknowledgments
We are grateful to Dr. Elizabeth Lacey and Dr. Nicholas H. Oberlies for insightful suggestions, and Carol Ann McCormick for help with preserving voucher specimens. This research was supported in part by Grant Number 1 R01 AT006860 from the National Center for Comple-mentary and Alternative Medicine (NCCAM), a component of the National Institutes of Health (NIH).
Author Contributions
Conceived and designed the experiments: ARB NBC GWK. Performed the experiments: ARB KAE PSC JME DHF BDS. Analyzed the data: ARB BDS GWK NBC. Contributed reagents/ma-terials/analysis tools: GWK NBC. Wrote the paper: ARB NBC. Provided critical advice for ex-perimental design: GWK KAE DT TNG.
References
2. Brenwald NP, Gill MJ, Wise R (1998) Prevalence of a putative efflux mechanism among fluoroquino-lone-resistant clinical isolates of Streptococcus pneumoniae. Antimicrob Agents Chemother. 42: 2032–2035. PMID:9687402
3. Bambeke FV, Balzi E, Tulkens PM (2000) Antibiotic Efflux Pumps. Biochem Pharmacol 60: 457–470. PMID:10874120
4. Tegos G, Stermitz FR, Lomovskaya O, Lewis K (2002) Multidrug Pump Inhibitors Uncover Remarkable Activity of Plant Antimicrobials. Antimicrob Agents Chemother 46: 3133–3141. PMID:12234835
5. Saidijam M, Benedetti G, Ren Q, Xu Z, Hoyle CJ, Palmer SL, et al. (2006) Microbial Drug Efflux Proteins of the Major Facilitator Superfamily. Curr Drug Targets 7: 793–811. PMID:16842212
6. Walsh C (2000) Molecular mechanisms that confer antibacterial drug resistance. Nature 406: 775– 781. PMID:10963607
7. Piddock LJV (2006) Multidrug-resistance efflux pumps—not just for resistance. Nat Rev Microbiol 4: 629–636. PMID:16845433
8. Piddock LJV (2006) Clinically relevant chromosomally encoded multidrug resistance efflux pumps in bacteria. Clin Microbiol Rev 19: 382–402. PMID:16614254
9. Stermitz FR, Lorenz P, Tawara JN, Zenewicz LA, Lewis K (2000) Synergy in a medicinal plant: Antimi-crobial action of berberine potentiated 5’-methoxyhydnocarpin, a multidrug pump inhibitor. Proc Natl Acad Sci 97: 1433–1437. PMID:10677479
10. Junio HA, Sy-Cordero AA, Ettefagh KA, Burns JT, Micko KT, Graf TN, et al. (2011) Synergy-directed fractionation of botanical medicines: a case study with goldenseal (Hydrastis canadensis). J Nat Prod 74: 1621–1629. doi:10.1021/np200336gPMID:21661731
11. Simões M, Bennett RN, Rosab EAS (2009) Understanding antimicrobial activities of phytochemicals against multidrug resistant bacteria and biofilms. Nat Prod Rep 26: 746–757. doi:10.1039/b821648g PMID:19471683
12. Olmsted J, Kearns DR (1977) Mechanism of ethidium bromide fluorescence enhancement on binding to nucleic acids. Biochemistry (Mosc) 16: 3647–3654.
13. Sabatini S, Kaatz GW, Rossolini GM, Brandini D, Fravolini A (2008) From Phenothiazine to 3-Phenyl-1,4-benzothiazine Derivatives as Inhibitors of the Staphylococcus aureus NorA Multidrug Efflux Pump. J Med Chem 51: 4321–4330. doi:10.1021/jm701623qPMID:18578473
14. Lechner D, Gibbons S, Bucar F (2008) Plant phenolic compounds as ethidium bromide efflux inhibitors in Mycobacterium smegmatis. J Antimicrob Chemother 62: 345–348. doi:10.1093/jac/dkn178PMID: 18430720
15. Pereda-Miranda R, Kaatz GW, Gibbons S (2006) Polyacylated oligosaccharides from medicinal mexi-can morning glory species as antibacterials and inhibitors of multidrug resistance in Staphylococcus au-reus. J Nat Prod 69: 406–409. PMID:16562846
16. Ettefagh KA, Burns JT, Junio HA, Kaatz GW, Cech NB (2011) Goldenseal (Hydrastis canadensis L.) extracts synergistically enhance the antibacterial activity of berberine via efflux pump inhibition. Planta Med 77: 835–840. doi:10.1055/s-0030-1250606PMID:21157683
17. Kaatz GW, Seo SM, O’Brien L, Wahiduzzaman M, Foster TJ (2000) Evidence for the existence of a multidrug efflux transporter distinct from NorA in Staphylococcus aureus. Antimicrob Agents Che-mother 44: 1404–1406. PMID:10770791
18. Schindler BD, Seo SM, Jacinto PL, Kumaraswami M, Birukou I, Brennan RG, et al. (2013) Functional Consequences of Substitution Mutations in MepR, a Repressor of the Staphylococcus aureus mepA Multidrug Efflux Pump Gene. J Bacteriol 195: 3651–3662. doi:10.1128/JB.00565-13PMID:23749979
19. Mahamoud A, Chevalier J, Davin-Regli A, Barbe J, Pagès JM (2006) Quinoline Derivatives as Promis-ing Inhibitors of Antibiotic Efflux Pump in Multidrug Resistant Enterobacter Aerogenes Isolates. Curr Drug Targets 7: 843–847. PMID:16842215
20. Newton BA (1957) The mode of action of phenanthridines: the effect of ethidiurn bromide on cell divi-sion and nucleic acid synthesis. J Gen Microbiol 17: 718–730. PMID:13491809
21. Waring MJ (1965) Complex formation between ethidium bromide and nucleic acids. J Mol Biol 13: 269–282. PMID:5859041
22. Gibbons S (2004) Anti-staphylococcal plant natural products. Nat Prod Rep 21: 263–277. PMID: 15042149
23. Stermitz FR, Scriven LN, Tegos G, Lewis K (2002) Two flavonols from Artemisa annua which potentiate the activity of berberine and norfloxacin against a resistant strain of Staphylococcus aureus. Planta Med 68: 114–1141.
25. Stavri M, Piddock LJV, Gibbons S (2007) Bacterial efflux pump inhibitors from natural sources. J Antimi-crob Chemother 59: 1247–1260. PMID:17145734
26. Guz NR, Stermitz FR, Johnson JB, Beeson TD, Willen S, Hsiang JF, et al. (2001) Flavonolignan and Flavone Inhibitors of a Staphylococcus aureus Multidrug Resistance Pump: Structure-Activity Relation-ships. J Med Chem 44: 261–268. PMID:11170636
27. Stermitz FR, Beeson TD, Mueller PJ, Hsiang JF, Lewis K (2001) Staphylococcus aureus MDR efflux pump inhibitors from a Berberis and a Mahonia (sensu strictu) species. Biochem Syst Ecol 29: 793– 798. PMID:11412952
28. Stermitz FR, Tawara-Matsuda J, Lorenz P, Mueller P, Zenewicz L, Lewis K, et al. (2000) 5‘ -Methoxy-hydnocarpD and pheophorbide A: Berberis species components that potentiate berberine growth in-hibition of resistant Staphylococcus aureus. J Nat Prod 63: 1146–1149. PMID:10978214
29. Hamilton-Miller JMT, Shah S (2000) Activity of the tea component epicatechin gallate and analogues against methicillin- resistant Staphylococcus aureus. J Antimicrob Chemother 46: 847–863. PMID: 11062213
30. Gu JQ, Graf TN, Lee D, Chai HB, Mi Q, Kardono LBS, et al. (2004) Cytotoxic and Antimicrobial Constit-uents of the Bark of Diospyros maritima Collected in Two Geographic Locations in Indonesia. J Nat Prod 67: 1156–1161. PMID:15270571
31. Novick R (1967) Properties of a cryptic high-frequency transducing phage in Staphylococcus aureus. Virology 33: 155–166. PMID:4227577
32. Khan IA, Mirza ZM, Kumar A, Verma V, Qazi GN (2006) Piperine, a Phytochemical Potentiator of Cipro-floxacin against Staphylococcus aureus. Antimicrob Agents Chemother 50: 810–812. PMID:
16436753
33. Nargotra A, Sharma S, Koul JL, Sangwan PL, Khan IA, Kumar A, et al. (2009) Quantitative structure ac-tivity relationship (QSAR) of piperine analogsfor bacterial NorA efflux pump inhibitors. Eur J Med Chem 44: 4128–4135. doi:10.1016/j.ejmech.2009.05.004PMID:19523722
34. Turner RJ, Charlton SJ (2005) Assessing the Minimum Number of Data Points Required for Accurate IC50 Determination. ASSAY Drug Dev Technol 3: 525–531. PMID:16305309
35. Wikler MA, Cockerill FR, Craig WA, Dudley MN, Eliopoulos GM, Hecht DW, et al. (2006) Methods for Dilution Antimicrobial Susceptibility Tests for Bacteria That Grow Aerobically; Approved standards— Seventh Edition M7-A7. Clin Labratory Stand Inst 26.
36. lwashina T (2000) The structure and distribution of the flavonoids in plants. J Plant Res 113: 287–299.
37. Hollman PCH, Katan MB (1999) Dietary flavonoids: Intake, health efects and bioavailability. Food Chem Toxicol 37: 937–942. PMID:10541448
38. Howitz KT, Bitterman KJ, Cohen HY, Lamming DW, Lavu S, Wood JG, et al. (2003) Small molecule ac-tivators of sirtuins extend Saccharomyces cerevisiae lifespan. Nature 426: 191–196.
39. Matsuura N, Aradate T, Sasaki C, Kojima H, Ohara M, Hasegawa J, et al. (2002) Screening System for the Maillard Reaction Inhibitor from Natural Product Extracts. J Health Sci 48: 520–526.
40. Baer GR, Meyers SP, Molin WT, Schrader LE (1982) A Simple and Sensitive DNA Assay for Plant Ex-tracts. Plant Physiol 70: 999–1003. PMID:16662658
41. Remans T, Schenk PM, Manners JM, Grof CPL, Elliott AR (1999) A Protocol for the Fluorometric Quan-tification of mGFP5-ER and sGFP(S65T) in Transgenic Plants. Plant Mol Biol Report 17: 385–395.
42. Hudson SA, Ecroyd H, Kee TW, Carver JA (2009) The thioflavin T fluorescence assay for amyloid fibril detection can be biased by the presence of exogenous compounds. FEBS J 276: 5960–5972. doi:10. 1111/j.1742-4658.2009.07307.xPMID:19754881
43. Mulazimoglu L, Drenning SD, Muder RR (1996) Vancomycin-Gentamicin Synergism Revisited: Effect of Gentamicin Susceptibility of Methicillin-Resistant Staphylococcus aureus. Antimicrob Agents Che-mother 40: 1534–1535. PMID:8726033