Crumb texture of spelt bread
Textúra striedky špaldového chleba
Joanna KORCZYK –SZABÓ*, Magdaléna LACKO –BARTOŠOVÁ
Slovak University of Agriculture, Department of Sustainable Agriculture and Herbology, Tr. A. Hlinku 2, 949 76 Nitra, Slovak Republic
*correspondence: [email protected]
Abstract
The bread quality is considerably dependent on the texture characteristic of bread crumb. Crumb texture is an important quality indicator, as consumer prefer different bread taste. Texture analysis is primarily concerned with the evaluation of
mechanical characteristics where a material is subjected to a controlled force from which a deformation curve of its response is generated. It is an objective physical examination of baked products and gives direct information on the product quality, oppositely to dough rheology tests what inform on the baking suitability of the flour, as raw material. This is why the texture analysis is one of the most helpful analytical methods of the product development. In the framework of our research during the years 2008 – 2009 were analyzed selected indicators for bread texture quality of five
Triticum spelta L. varieties – Altgold, Oberkulmer Rotkorn, Ostro, Rubiota and Franckenkorn grown in an ecological system. The bread texture quality was evaluated on texture analyzer TA.XT Plus (Stable Micro Systems, Surrey, UK), following the AACC (74-09) standard method and expressed as crumb firmness (N), stiffness (N.mm-1) and relative elasticity (%). Our research proved that all selected indicators were significantly influenced by the year of growing and variety. The most soft bread was achieved in Rubiota, whereas bread crumb samples from
Franckenkorn and Altgold were the most firm and stiff. Correlation analysis showed strong negative correlation between relative elasticity and bread crumb firmness as well as bread stiffness (-0.81++, -0.78++). The spelt grain can be a good source for making bread flour, but is closely dependent on choice of spelt variety. The spelt wheat bread crumb texture need further investigation as it can be a reliable quality parameter.
Keywords: crumb texture, firmness, relative elasticity, spelt bread, stiffness
Abstrakt
Textúra striedky chleba je jedna z dôležitejších charakteristík pri určovaní a
informácie o kvalite múky a je preto jednou znajdôležitejších analytických metód vývoja produktu. V rokoch 2008 - 2009 boli analyzovanévybrané ukazovatele textúry
špaldového chleba piatich odrôdTriticum spelta L. - Altgold, Oberkulmer Rotkorn, Ostro, Rubiota a Franckenkorn pestovaných v podmienkach ekologického
poľnohospodárstva. Textúra špaldového chleba (tvrdosť (N), tuhosť (N.mm-1)
a relatívna elasticitastriedky (%)bola hodnotená na analyzátore textúry TA.XT Plus (Stable Micro Systems, Surrey, VeľkáBritánia) podľa štandardnej metódy AACC (74 -09). Všetky vybrané ukazovatele boli preukazne ovplyvnenévonkajšími (počasie) ako aj vnútornými (odroda) faktormi. Najlepšia textúrna kvalita bola zaznamenaná
u odrody Rubiota, zatiaľčo najvyššia tvrdosť a tuhosť striedky bola zistená u odrody Altgold a Franckenkorn. Korelačná analýza potvrdila silnú negatívnu závislosť medzi relatívnou elasticitou a tvrdosťou atuhosťou striedky (-0.81++, -0.78++) Zrno Triticum spelta môže byť dobrým zdrojom pre výrobu múky, ale kvalita pekárskych výrobkov
závisí od výberu odrody. Je potrebný ďalší výskum pri hodnotení textúrnych vlastností špaldového chleba ako spoľahlivých parametrov kvality.
Kľúčové slová: relatívna elasticita, špaldový chlieb, textúra striedky, tvrdosť, tuhosť
Introduction
Textural attributes are key characteristics that consumers appreciate in pan bread. Crumb freshness is associated with its specific structure and, especially with the mechanical properties of the cell walls that form the air cells in bread (Ponte and Ovadia, 1996; Liu and Scanlon, 2003; Liu and Scanlon, 2004). An essential food consumed worldwide, bread-rapidly loses its desirable texture and flavour qualities associated with freshness. When stored at room temperature, most breads or bakery products with a spongy crumb undergo a progressive and often rapid deterioration of quality, commonly known as staling (Baik and Chinachoti, 2000; Kulp and Ponte, 1981), particularly in high-moisture samples. Many instrumental methods are used to measure mechanical properties of baked goods that are, up to a certain extent, related to sensory characteristics (Collar et al., 2005). Crumb hardness is often used as a measure of bread staling, which has been successfully determined using a texture analyser in a static compression mode (Baik and Chinachoti, 2000; Armero and Collar, 1998). Results obtained with traditional instruments are strongly
dependent on experimental conditions (Macák, 2006) and limited to empirical
correlations and thus, these tests do not provide fundamental rheological data. Fresh and aged bread crumb mechanical properties are often connected to sensory
(Kamman, 1970). In general, though, the term texture usually refers to sensory perceptions associated with the mechanical properties of foods. Bourne (1982) has indicated that, in the case of bread crumb evaluations, the term texture appears to be used exclusively to describe crumb uniformity and distribution of cell sizes. The term texture is also used in image analysis to indicate variegation in surface profile which leads to variation in intensity within the image (Davies, 2000). Variegation due to a distribution of surface heights is evidently the case for the cut surface of bread crumb (Pedreschi et al., 2000). Therefore, to avoid conflict with the term texture, the term physical texture will be used to refer to the mechanical properties of bread, and visual texture to describe crumb cellular structure. Crumb cellular structure (or its grain) is an important quality criterion used in commercial baking and research laboratories to judge bread quality alongside taste, crumb colour and crumb physical texture
(Kamman, 1970; Pyler, 1988; Zayas, 1993). Bread crumb visual texture accounts for approximately 20% of the weighting used in judging bread quality (Pyler, 1988). Regardless of the weight assigned to it, crumb grain is believed to have considerable importance in defining bread quality since the accuracy in scoring other quality
attributes in bread (e.g. loaf volume, loaf symmetry) depends on the underlying crumb grain characteristics (Scanlon and Zghal, 2001).
The bread crumb has a reasonably complex rheological structure. It is comprised at a macroscopic level of two phases a fluid and a solid. Bread as a solid is "soft" (Clark, 1991; Scanlon et al., 2000). Looking at the cross section of bread crumb, the solid phase is entirely connected, the air cells are isolated. The volume fraction of the phases and the character of their connection determine the structure and the
mechanical properties of the bread. Therefore there is need for rapid and simple test methods being suitable for practical applications (Meretei et al., 2003; Zheng, 2004). Texture analysis is an objective physical examination of baked products and gives direct information on the product quality, oppositely to dough rheology tests what inform on the baking suitability of the flour, as raw material. The use of spelt in bread production is possible: bread with addition of spelt flour is characteristic by excellent taste and it stay longer fresh and soft. Unfortunately literature does not provide a lot of data on the textural value of the spelt bread. The objective of this study was to determine the texture of spelt wheat bread (crumb firmness, stiffness and relative elasticity) of five Triticum spelta varieties grown in ecological systems.
Materials and Methods
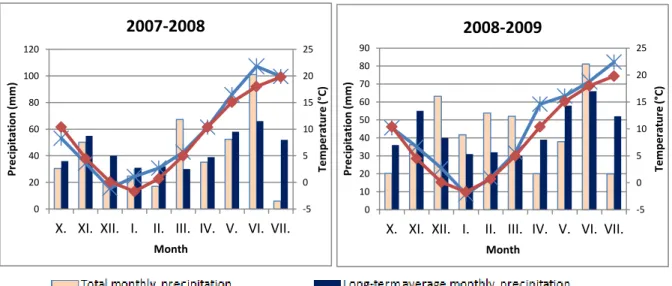
A field stationary experiments were carried out at the Research Experimental Station of the Slovak University of Agriculture in Dolná Malanta near Nitra. The long-term average annual temperature of the site is 9.8°C and 8.2°C during the vegetation period of Triticum spelta. The average annual rainfall is 540 mm, including 439 mm during the vegetation period of Triticum spelta (Figure 1). Spelt wheat varieties were cultivated in ecological farming system without fertilization and any chemical
treatment. The sowing/harvest data of growing spelta are as following: 10 October 2007/28 July 2008 and 14 October 2008/16 July 2009. The field trial was established into blocks (the average plot size was 30m2) in three repetitions. Five varieties of
originated from individual selection of Fuggers Babenhauser Zuchtw.) and Franckenkorn (originated from spelt cultivars (Rouquin x Altgold) x Altgold).
Figure 1. Detailed information on weather conditions during 2007-2008 and 2008-2009 growing seasons.
Obrázok 1. Podrobné informácie o poveternostných podmienkach v priebehu
vegetačného obdobia 2007-2008 a 2008-2009.
In the framework of our research during the years 2008 – 2009 was analyzed selected indicators for bread texture quality on texture analyzer TA.XT Plus (Stable Micro Systems, Surrey, UK), following the AACC (74-09) standard method and expressed as crumb firmness (N) – the maximum force needed to compress the bread crumb sample, stiffness (N.mm-1) – the linear part of the slope of the force/deformation curve and relative elasticity (%) – ratio between the remaining force measured 20 seconds after the maximum force was reached and the maximum force. Firmness is defined in this method as the force (Newtons) required to
compress the product by a pre-set distance (i.e. force taken at 25% compression of 25 mm). A 25% compression of 25 mm thick sample = 6.25 mm compression
distance at which point the compression force value (CFV) is taken. It´s conducting a „measure of force in compression” test with an AACC 36 mm cylinder probe with radius (P/36R). The analyser was set at a ‘return to start’ cycle, a pre-test speed of 1 mm·s-1, a test speed of 1.7 mm·s-1, a post-test speed 10.0 mm·s-1 and a distance of
6.25 mm. Relative elasticity was performed by two sequential compression events (compression depth 15%, probe speed 10 mm s−1, trigger force 0.05N) using a compression plate SMS P/100, 5-kg load cell and a 20-s gap between penetration band the force deformation curve was recorded. Crumb samples (40mm x 40mm x 30mm thick) were cut from the centre of each slice using a circular cutter and then placed between the parallel plates 24 hours after baking.They were evaluated in six replicates and the results presented are means of the six realized measurements. All data were statistically analysed by analysis of variance (ANOVA) and Fischer test. The least significant difference at the 5% probability level (P value<0.05) was calculated for each parameter.
-5 0 5 10 15 20 25 0 20 40 60 80 100 120
X. XI. XII. I. II. III. IV. V. VI. VII.
Tem pe rat ur e ( ° C) P re ci pi tat ion (m m ) Month 2007-2008 -5 0 5 10 15 20 25 0 10 20 30 40 50 60 70 80 90
X. XI. XII. I. II. III. IV. V. VI. VII.
Results and Discussion
Texture analysis is primarily concerned with the evaluation of mechanical characteristics where a material is subjected to a controlled force from which a deformation curve of its response is generated. These mechanical characteristics in food can be further sub-divided into primary and secondary sensory characteristics which have proven to be correlated to sensory perception. It is a common agreement that good quality bread should have a high porosity and fine, regular gas cell
structure in the crumb (Liu and Scanlon, 2003; Van Vliet, 1999; Lassoued et al., 2008). Good crumb quality is dependent on several rheological and physical
properties achieved by both small and large deformation measurements (Angioloni and Collar, 2009).
Bread crumb is a complex viscoelastic foam material and its texture is an important quality indicator, as consumers prefer different bread taste. Mostly breads with softer texture are required, it means that low maximum forces by compression of the crumb sample is in demand (Sipos et al., 2008).
Crumb texture is an important quality indicator, as consumer prefer different bread taste. Diverse request for the specific taste is mostly caused by cultural, traditional as well as individual habits (Różyło and Laskowski, 2011).
Bread crumb firmness is expressed as the maximum force needed to compress the bread crumb sample. The low maximum force indicates soft bread crumb texture. The average bread crumb firmness of five Triticum spelta varieties was 15.48 N. Statistical analysis confirmed significant differences among evaluated breads prepared from five spelt varieties. Rubiota bread had the softest crumb (Table 1). Contrary, the most firm bread crumb (more than 18 N) was found in Franckenkorn. Weather conditions during vegetative period significantly affected crumb firmness which was better in 2008 (11.29 N) as compared with 2009 (19.95 N), when 43.4% higher firmness was achieved.
Table 1. Texture analysis of spelt wheat bread, average values for 2008 – 2009 (ANOVA, LSD test, α=0.05)
Tabuľka 1. Štatistické vyhodnotenie analýzy textúry špaldoveho chleba za obdobie 2008 – 2009 (ANOVA, LSD test, α=0.05)
VARIETY
Crumb firmness (N)
Crumb stiffness (N.mm-1)
Relative elasticity (%)
Altgold 17.72 d 1.18 d 95.12 a
Oberkulmer Rotkorn 15.81 c 1.07 c 95.74 ab
Ostro 13.93 b 0.93 b 96.17 b
Rubiota 12.16 a 0.80 a 96.20 b
Franckenkorn 18.48 d 1.24 d 95.37 a
YEAR
2008 11.29 a 0.75 a 96.84 b
2009 19.95 b 1.34 b 94.61 a
AVERAGE 15.62 1.04 95.72
Ponte, Titcomb, and Cotton (1962), Short and Roberts (1971) showed that bread crumb firmness, determined by compression testing, varied across bread slices with the highest value in the centre. This finding was later confirmed by Hibberd and
Parker (1985) who studied factors causing variability in bread firming measurements.
Crumb stiffness is an important property of bread because of its close human
perception of freshness. Stiffness is described as the resistance to deformation. The higher is the resistance, the harder is the bread crumb. The average bread crumb stiffness was 1.04 N.mm-1 and ranged between 0.8 – 1.24 N.mm-1. The lowest crumb stiffness (less than 1.0 N.mm-1) was observed in Rubiota (Figure 2). Crumb stiffness was significantly higher in 2009 (1.34 N.mm-1) than in 2008 (0.75 N.mm-1).
Figure 2. Crumb firmness and stiffness of spelt wheat bread. Obrázok 2. Tvrdosť a pevnosť striedky špaldového chleba.
The influence of the variety as well as weather condition on the relative elasticity of bread crumb values was statistically significant (Figure 1). The lowest relative
elasticity was found in Franckenkorn and Altgold (Figure 3). The softer bread crumb with higher elasticity generally better satisfies consumer´s requirements. In this case there is a large deformation under the compression force. Furthermore, the elastic deformation within the whole deformation is also large when the loading is stopped. However, the plastic deformation in the bread crumb is relatively small. The ratio of elastic deformation to the maximal deformation is the creep-recovery coefficient, namely the elasticity (Nagy et al., 2007).As the relative elasticity express ratio between the remaining force measured 20 seconds after the maximum force was reached and the maximum force, we could conclude that the bread crumbs of those two varieties had the lowest elasticity. The highest relative elasticity was found in Rubiota (96.2%) (Table 1). In overall evaluation of bread crumb we could suppose that spelt bread crumb was resist to the compression. Better relative elasticity was found in 2008 than in 2009 (96.84% vs. 94.61%).
0 5 10 15 20 Altgold
Oberkulmer Rotkorn
Ostro Rubiota
Franckernkorn
Crumb firmness (N)
0 0,5 1 1,5 Altgold
Oberkulmer Rotkorn
Ostro Rubiota
Franckernkorn
Figure 3. Relative elasticity of spelt bread crumb.
Obrázok 3. Relatívna elasticita striedky špaldového chleba.
High correlation coefficient (1.00++) confirmed the dependence among bread crumb firmness and stiffness (Table 2).The higher was the firmness, the higher was also the resistance to deformation. Correlation analysis showed strong negative correlation between relative elasticity and bread crumb firmness as well as bread stiffness (0.81++, -0.78++).
Table 2. Correlation analysis of spelt wheat bread crumb texture Tabuľka 2. Korelačná analýza textúry striedky špaldového chleba
Bread firmness (N)
Bread stiffness (N.mm-1)
Relative elasticity (%)
Bread firmness 1.00 1.00++ -0.81++
Bread stiffness 1.00 -0.78++
Relative elasticity 1.00
Texture analysis is an objective physical examination of baked products and gives direct information on the product quality, oppositely to dough rheology tests what inform on the baking suitability of the flour, as raw material (Carson and Sun, 2001). This is why the texture analysis is one of the most helpful analytical methods of the product development, as it is suitable to quantify the effects of flour blends and
additives on physical properties of crust and crumb of the breads. It is also suitable to examine the effects of storing on different sensory properties of these products and hence it is suitable to analyze the results of different recipes in product development (Sipos et al., 2008).
Conclusions
Our research proved that all selected indicators of crumb bread texture were significantly influenced by the year of growing and variety.Favourable air
temperatures and more favourable distributions precipitations in 2008 reflected into 94,5
95 95,5 96 96,5 Altgold
Oberkulmer Rotkorn
Ostro Rubiota
Franckernkorn
the better baking quality and texture of spelt wheat bread when compared with 2009 (significantly higher value of relative elasticity and lower values of bread firmness and stiffness). The used firmness test method was found to be suitable for the evaluation of the bakery products texture. The most soft bread was measured in Rubiota,
whereas bread crumb samples from Franckenkorn and Altgold were the most firm and stiff. The highest firmness and stiffness of Franckenkorn is probably due to more compact crumb structure than in other varieties. Relative elasticity confirmed that the lowest firmness and stiffness was found in Rubiota bread. The spelt grain can be a good source for making bread flour, but it is closely related to the choice of spelt variety. The spelt wheat bread crumb texture need further investigation as it can be a reliable quality parameter.
The bread quality is considerably dependent on the texture characteristic of bread crumb. The test method provide a reliable evaluation procedure of bread crumb texture quality for research purposes and the bakeries, as well. Texture analysis is suitable analytical method for evaluation of bakery products.
Evaluation of the mechanical properties of bread crumb is important not only for quality assurance in the bakeries, but also for assessing the effects of changes in dough ingredients and processing condition and also for describing the changes in bread crumb during storage.
Acknowledgement
The research presented in this paper was supported by the project VEGA No 1/0513/12 "Research of agroecosystems to reduce climate change, ecological food production and improve nutrition and health parameters of human" and ITEBIO "Support and innovations of a special and organic products technologies for human healthy nutrition" ITMS: 26 220 220 115, implemented under Operational Programme Research and Development.
References
Angioloni, A., Collar, C. (2009) Bread crumb quality assessment: a plural physical approach. European Food Research and Technology, 229, 21-30.
Armero, E., Collar, C. (1998) Crumb firming kinetics of wheat breads with anti-staling additives. Journal of Cereal Science, 28, 165-174.
Baik, M.Y., Chinachoti, P. (2000) Moisture redistribution and phase transitions during bread staling. Cereal Chemistry, 77(4), 484-488.
Barrett, A.H., Cardello, A.V., Lesher, L.L., Taub, I.A. (1994) Cellularity, mechanical failure and textural perception of corn meal extrudates. Journal of Texture Studies, 25, 77-95.
Bollaín, C., Angioloni, A., Collar, C. (2005) Bread staling assessment of enzymes supplemented pan breads by dynamic and static deformation measurement.
European Food Research and Technology, 220, 83-89.
Bourne, M.C. (1982) Food texture and viscosity: concept and measurement. New York: Academic Press, 1-23.
Clark, A.H. (1991) Structural and mechanical properties of biopolymer gels. E. Dickinson (Ed.), Food polymers, gels and colloids, Cambridge: Royal Society of Chemistry, 322-338.
Collar, C., Bollaín, C., Angioloni, A. (2005) Significance of microbial transglutaminase on the sensory, mechanical and crumb grain pattern of enzyme supplemented fresh pan breads. Journal of Food Engineeiring, 70, 479-488.
Davies, E.R. (2000) Image processing for the food industry. Singapore: World Scientific, 77-86.
Hayman, D., Hoseney, R.C., Faubion, J.M. (1998). Bread crumb grain development during baking. Cereal Chemistry, 75, 577-580.
Hibberd, G.E., Parker, N.S. (1985) Measurements of the compression properties of bread crumb. Journal of Texture Studies, 16, 97-110.
Chen, P., Whitney, L.F., Peleg, M. (1994) Some tensile characteristics of bread crumb. Journal of Texture Studies, 25, 299-310.
Kamman, P.W. (1970) Factors affecting the grain and texture of white bread. Bakers Digest, 44(2), 34-38.
Kulp, K., Ponte, J.G. (1981) Staling of white pan bread: fundamental causes. Critical Reviews Food Science and Nutrition, 15, 1-48.
Lassoued, N., Delarue, J., Launay, B., Michon, C. (2008) Baked product texture: correlations between instrumental and sensory characterization using Flash Profile.
Journal of Cereal Science, 48(1), 133-143.
Liu, Z., Scanlon, M.G. (2003) Predicting mechanical properties of bread crumb. Trans Inst Chem Eng C, 81, 224–238.
Liu, Z., Scanlon, M.G. (2004) Revisiting crumb texture evaluation methods: tension, compression, and indentation. Cereal Foods World, 49(2), 76-82.
Mandala, I., Karabela, D., Kostaropoulos, A. (2007) Physical properties of breads containing hydrocolloids stored at low temperature. I. Effect of chilling. Food Hydrocolloids, 21, 1397-1406.
Macák, M. (2006)Agroenvironmentálne indikátory hodnotenia udržateľnosti poľnohospodárstva. Nitra: Slovenská poľnohospodárska univerzita, Ochrana biodiversity, 35,118. ISBN 80-8069-651-9.
Meretei, A., Fekete, A., Gallasz, G. (2003) Hardness and elasticity of bread crumb. ASAE Annual International Meeting, Las Vegas, Nevada, USA, 036048, 27-30. Nagy, M., Meretei, A., Fekete, A. (2007) Bread type characterization by rheological and mechanical properties. Annual International Meeting of ASABE, Minneapolis.
Technical Papers, 11 (076018), 10.
Pedreschi, F., Aquilera, J. M., Brown, C. A. (2000) Characterization of food surfaces using scale-sensitive fractal analysis. Journal of Food Process Engineering, 23, 127-143.
Ponte, J.G. Jr., Titcomb, S.T., Cotton, R.H. (1962) Flour as a factor in bread firming.
Cereal Chemistry, 39, 437-444.
Ponte, J.G., Ovadia, D.Z. (1996) Instrumental methods. In: Hebeda RE, Zobel HF (eds) Baked goods freshness. Marcel Dekker, New York.
Pyler, E.J. (1988) Baking science and technology, volume II, Merriam, KS: Sosland, 850-910.
Rózyło, R., Laskowski, J. (2011) Predicting bread quality (bread loaf volume and crumb texture). Polish Journal of Food and Nutrition Sciences, 61 (1), 61-67.
Scanlon, M.G., Sapirstein, H.D., Fahloul, D. (2000) Mechanical properties of bread crumb prepared from flours of different dough strength. Journal of Cereal Sciences, 32, 235-243.
Scanlon, M.G., Zghal, M.C. (2001) Bread properties and crumb structure. Food Research International, 34, 841-864.
Short, A.L., Roberts, E.A. (1971) Pattern of firmness within a bread loaf. Journal of the Science of Food and Agriculture, 22, 470-472.
Sipos, P., Elek, A., Gyori, Z. (2008) Application of texture analyzer in the quality analysis of bakery products. Journal of Food Physics. 8th International Conference of Food Physicists Physics and Physical Chemistry of Food, Plovdiv, 229-234. ISSN 1416-2083.
Szczesniak, A.S. (2002) Texture is a sensory property. Food Quality and Performance, 13 (4), 215-225.
Zayas, I.Y. (1993) Digital image texture analysis for bread crumb grain evaluation.
Cereal Foods World, 38, 760-766.