Liquid Mixtures Involving Hydrogenated and Fluorinated Chains: (
p,
ρ, T, x) Surface of (Ethanol + 2,2,2-Trifluoroethanol), Experimental
and Simulation
Pedro Duarte,
†Marcelo Silva,
†Djêide Rodrigues,
†Pedro Morgado,
†Luís F. G. Martins,
‡and Eduardo J. M. Filipe*
,††Centro de Química Estrutural, Instituto Superior Técnico, Universidade Técnica de Lisboa, 1049-001 Lisboa, Portugal ‡Centro de Química de Évora, Universidade de Évora, Rua Romão Ramalho, 59, 7000-671 Évora, Portugal
*
S Supporting InformationABSTRACT: The effect of mixing hydrogenated and fluorinated molecules that simultaneously interact through strong hydrogen bonding was investigated: (ethanol + 2,2,2-trifluoroethanol) binary mixtures were studied both experimentally and by computer simulation. This mixture displays a very complex behavior when compared with mixtures of hydrogenated alcohols and mixtures of alkanes and perfluoroalkanes. The excess volumes are large and positive (unlike those of mixtures of hydrogenated alchools), while the excess enthalpies are large and negative (contrasting with those of mixtures of alkanes and perfluoroalkanes). In this work, the liquid density of the mixtures was measured as a function of composition, at several temperatures from 278.15 to 353.15 K and from atmospheric pressure up to 70 MPa. The corresponding excess molar volumes, compressibilities, and expansivities were calculated over the
whole (p,ρ, T, x) surface. In order to obtain molecular level insight, the behavior of the mixture was also studied by molecular dynamics simulation, using the OPLS-AA forcefield. The combined analysis of the experimental and simulation results indicates that the peculiar phase behavior of this system stems from a balance between the weak dispersion forces between the hydrogenated andfluorinated groups and a preferential hydrogen bond between ethanol and 2,2,2-trifluoroethanol. Additionally, it was observed that a 25% reduction of the F−H dispersive interaction in the simulations brings agreement between the experimental and simulated excess enthalpy but produces no effect in the excess volumes. This reveals that the main reason causing the volume increase in these systems is not entirely related to the weak dispersive interactions, as it is usually assumed, and should thus be connected to the repulsive part of the intermolecular potential.
1. INTRODUCTION
In spite of their apparent similarity, it is well-known that mixtures involving hydrogenated and fluorinated chains generate highly nonideal systems. In particular, binary mixtures of alkanes and perfluoroalkanes exhibit extensive regions of liquid−liquid immiscibility, large positive deviations from Raoult’s law, and large positive excess properties, such as the excess enthalpy and volume. This has been interpreted as an indication of weaker than anticipated unlike interactions. However, despite the large amount of work that has been carried out on the theoretical and computational modeling of (n-alkane + n-perfluoroalkane) mixtures,1−10 a satisfactory explanation for the unusually weak hydrocarbon−fluorocarbon interaction is still awaited. Most of these efforts have pointed to departures from the geometric (Berthelot) combining rule as the source of the unusual mixing behavior, implying that this rule overestimates the strength of alkane + perfluoroalkane interactions. Song et al.11 used the OPLS-AA force field to simulate properties of perfluoroalkane + alkane mixtures. They found that, although the OPLS-AA models accurately account for many of the liquid-phase properties of pure per fluor-oalkanes and alkanes, for the mixtures, most properties are only
reproduced by reducing the strength of H−F atom interactions by ∼25% compared to the geometric combining rule. This reduction in the H−F atom interactions is comparable to a reduction of 10% in united atom models. Zhang and Siepmann,12 using the united atom version of the TraPPE forcefield, found that a 1% increase of the unlike size parameter and an 11% reduction of the unlike well depth were necessary to obtain an adequatefit of the liquid−liquid envelope for the CH4/CF4mixture. More recently, Potoff and Bernard-Brunel13
developed united atom force fields for alkanes and perfluor-oalkanes based on Mie potentials. Allegedly, steeper, i.e., more repulsive, potentials are able to produce a better representation of the properties of fluorinated chains (vapor pressure and density). As for mixtures, the ethane + perfluoroethane pressure−composition diagram was simulated requiring a smaller correction to the geometric mean rule of the energy parameters, in order to fit the experimental data. Finally, it should be reminded that at least part of the inability of all the
Received: October 24, 2012
Revised: July 19, 2013
Published: July 22, 2013
previously mentioned potential models to describe the behavior of mixtures could be ascribed to the combining rules used to characterize the interaction between unlike molecules. The subject has been recently addressed by Haslam et al.14 who generalized previous combining rules originally designed for use with the Lennard-Jones potential, for use in modeling mixtures using potentials not of Lennard-Jones form. However, in their work, Song et al.11tested a number of combining rules only to conclude the following:“At this point, it must be admitted that the origins of the weaker-than-expected interactions between perfluoroalkanes and alkanes remain a mystery”.
The changes in volume that occur when hydrogenated and fluorinated substances are mixed are remarkable. When perfluoroalkanes are immersed in n-alkanes at infinite dilution, their molar volume increases by 13%.15,16When n-alkanes are dissolved in n-perfluoroalkanes, the effect is even larger and their molar volumes increase by 20%.17 Literally, a layer of empty space is created around each of the constituent molecules. It is clear that an accurate description and interpretation of such volume changes should provide important information on the nature of the cross interaction between these groups.
In recent work, we have accomplished a systematic study of perfluoroalkylalkanes (PFAAs), diblock compounds made up of alkyl and perfluoroalkyl segments covalently bonded to form a single chain. These molecules can be pictured as chemical mixtures of two mutually phobic segments that otherwise would phase separate. Consequently, they display the “dual character” of amphiphilic molecules and the physics of orientational ordering of smectogenic liquid crystals. Indeed, aggregation in solvents selective for one of the blocks18,19and smectic liquid crystalline phases have been reported for PFAAs.20−22 It should be kept in mind, however, that unlike common hydrophilic/hydrophobic amphiphiles in which one of the driving forces for organization is the strong interaction between polar or ionic groups, in PFAA, the origin of organization rests on a subtle balance between weak and even weaker interactions. We have reported15,16,23−26a number of properties of pure liquid PFAA (liquid density, vapor pressure, viscosity, and surface tension) and mixtures (partial molar volume at infinite dilution, solubility of water, interfacial tension) as a function of temperature, pressure, and relative length of the hydrogenated and fluorinated segments. The results were interpreted comparing with equivalent properties of corresponding alkanes, perfluoroalkanes, and their mixtures. This work is part of a project in which mixtures of hydrogenated and fluorinated alcohols will be investigated, hoping to clarify the effect of the combined presence of hydrogen bonding between molecules with mutually phobic segments (hydrogenated and perfluorinated) and how this affects the properties of the liquid mixture and induces organization. Following the strategy used in the study of PFAA, the results will be interpreted comparing with those of mixtures of hydrogenated alcohols and mixtures of alkanes and perfluoroalkanes.
From the application point of view,fluorinated alcohols are substances with unique properties and high technological value in the pharmaceutical and chemical industries. 2,2,2-Tri fluor-oethanol (TFE), in particular, displays a number of unusual properties as a solvent. For example, it dissolves nylon at room temperature and is used as solvent in bioengineering. The presence of the threefluorine atoms gives the alcohol a high ionization constant, strong hydrogen bonding capability, and
stability at high temperatures. TFE is known to induce conformational changes in proteins, and it is used as a cosolvent to analyze structural features of partially folded states. In the pharmaceutical industry, TFEfinds use as the major raw material for the production of inhalation anesthetics. Mixtures of TFE and water (known as fluorinols) are used as working fluids for Rankine cycle heat engines for terrestrial and space applications, as a result of a unique combination of physical and thermodynamic properties such as high thermal efficiency and excellent turbine expansion characteristics. Environmentally, TFE is a CFC substitute with an acceptable short lifetime and with small ozone depletion potential.
In this work, liquid mixtures of TFE and ethanol were investigated. The densities of the mixtures were measured as a function of composition between 278 and 338 K and at pressures up to 700 bar. In other words, the equation of state of liquid (ethanol + TFE) mixtures, ρ = f(p, T, x), was determined. The corresponding excess volumes, isothermal compressibilities, and thermal expansivities were calculated from the experimental results as a function of temperature and pressure. To obtain molecular level insight into the behavior of the system, atomistic molecular dynamics simulations have been performed to model the (TFE + ethanol) mixtures, using the OPLS-AA force field. The liquid density, excess volume, and excess enthalpy were obtained as a function of composition, temperature, and pressure. Radial distribution functions were also calculated.
The simulations are able to interpret the experimental results in terms of a balance between the weak dispersion forces between the hydrogenated and fluorinated groups and the existence of a specific hydrogen bond between ethanol and 2,2,2-trifluoroethanol. However, we have found that, although reducing the F−H dispersive interaction by 25% is essential to bring agreement between the experimental and simulated excess enthalpy, no effect in the excess volumes is observed. This uncovers that, contrarily to what is usually assumed, the volume increase found in these systems cannot be entirely related to weak dispersive interactions between the hydro-genated andfluorinated groups, and should be connected to the repulsive part of the intermolecular potential.
2. EXPERIMENTAL SECTION
Ethanol (absolute PA, min. 99.5% v/v) was obtained from Panreac and kept over 4 Å molecular sieves. The 2,2,2-trifluoroethanol (99%), supplied by Apollo Scientific, was distilled over calcium sulfate and stored in tightly closed bottles under dry nitrogen.
The mixtures were prepared by weight, in 4 mL screw-cap flasks, under a stream of dry nitrogen. The volume of vapor phase in the flasks was kept to a minimum to prevent differential evaporation.
The densities were measured in a vibrating-tube Anton Paar DMA HP external cell, connected to a DMA 5000 densimeter. The DMA HP cell has a built-in temperature control system, based on Peltier units, which is stable at ±0.001 K; the measuring cell is connected to a high pressure generator (HIP model 62-6-10) and to a Setra 280E pressure transducer, which has an accuracy of 0.08 MPa. This densimeter was calibrated in a vacuum in the whole range of measurement temperatures, and with water, toluene, and dichloromethane in the whole range of temperature and pressure, with a total of 737 calibration points; the average of the absolute residuals of the overall fit in relation to the literature data27−29 for the
calibrating fluids was 3 × 10⁻⁵ g cm−3, and the individual deviations were always lower than 2× 10⁻⁴g cm−3.
3. SIMULATION DETAILS
The optimized potentials for liquid simulations of the all-atom (OPLS-AA) force field30 were used to model the molecules studied. The OPLS-AA force field models each atom as an interaction site, and the potential energy is written as the sum of contributions due to bond stretching, bond angle bending, dihedral angle torsion, and nonbonded interactions (van der Waals plus electrostatic interactions). Details about the exact expressions used can be found in the original references. All OPLS-AA parameters needed for the simulations30−32 are summarized in the Supporting Information.
Following the OPLS parametrization, geometrical combining rules were used to compute the nonbonded Lennard-Jones interactions between sites of different type:
εij=(1 −kij) ε εii jj (1) σij= σ σii jj (2)
For nonbonded interactions between sites in the same molecule, only sites separated by three or more bonds are considered. Nonbonded interactions between sites separated by three bonds are scaled by a factor of 0.5. The cross interaction energy (eq 1) was calculated with the geometric rule (kij= 0)
for all pairs; in the case of the H−F interaction between unlike molecules (hydroxyl hydrogen not included), simulations were also performed with kij= 0.25, as proposed by Song et al.11for mixtures of hydrogenated and perfluorinated chains.
In this work, all bonds involving hydrogen were treated as rigid, with the respective length fixed at the equilibrium distance, and the LINCS algorithm was used to constrain them. The long-range electrostatic (Coulombic) interactions were calculated using the particle-mesh Ewald method.
Molecular dynamics simulations were performed using the GROMACS package,33,34with systems of 500 total molecules, to which periodic boundary conditions were applied in three directions. The initial liquid box sizes were established according to the experimental densities. For each system, two consecutive runs were performed: an initial NpT equilibration run of 5 ns followed by a 20 ns long NpT production run for accumulation of averages. The equations of motion were solved using the leapfrog integration algorithm, with a time step of 0.5 fs. The Nosé−Hoover thermostat35 and the Parrinello− Rahman barostat36 were used for all simulations. In the thermostat, a coupling constant of 0.5 ps was used, and for pressure, a coupling constant of 1.0 ps was chosen.
In all simulations, a neighbor list, with a radius of 12 Å, was used and was updated every 25 time steps. Both nonbonded Lennard-Jones and electrostatic potential were truncated by using cut-offs of 14 and 12 Å, respectively. Before the molecular dynamics runs, the boxes were subjected to energy minimization by the steepest descent method to a maximum force of 10 kJ mol−1Å−1, with a maximum number of steps of 1 × 10⁶.
Pure ethanol and 2,2,2-trifluoroethanol as well as five binary mixtures (with 2,2,2-trifluoroethanol mole fractions of 0.2, 0.4, 0.5, 0.6, and 0.8) were simulated at 298.15 K and 1 bar. In order to evaluate the influence of temperature on the properties of this system, the pure compounds and the equimolar mixtures were also studied at 278.15, 318.15, and 338.15 K. Simulations
were done for the same systems at 298.15 K and 500 bar in order to test the influence of pressure on the results. In all cases, densities and enthalpies were obtained for the pure substances and mixtures, from which excess molar volumes and excess molar enthalpies were calculated. Radial distribution functions were calculated for the equimolar mixtures at 298.15 K.
4. RESULTS
The volumetric behavior of the (ethanol + 2,2,2-tri fluoroetha-nol) system was studied as a function of temperature, pressure, and composition, including both pure components. For each composition (five mixtures and both pure components), four density vs pressure isotherms were obtained, between 278.15 and 338.15 K and from atmospheric pressure to 70 MPa. Twenty-five experimental density points were obtained for each isotherm. Since the total number of experimental points is too large to be conveniently presented in the main body of the paper, the full tables may be found as Supporting Information. The density results for each isotherm werefitted to the Tait equation, in the form
ρ = ρ* + + * + ⎡ ⎣ ⎢ ⎤ ⎦ ⎥ A B p B p 1 1 ln ( ) ( ) (3)
where ρ and ρ* are the densities at the pressure p and the reference pressure p* = 0.101325 MPa, respectively, and A and B are thefitting parameters. The root-mean-square deviations of thefits were always lower than or equal to 2 × 10⁻⁴g cm−3. Parameters for the Tait equation are presented in Table 1.
The density results for the pure ethanol and 2,2,2-trifluoroethanol were compared to the values proposed by Cibulka et al.,37,38which are based on a critical compilation of literature data. Our measurements agree within 0.07% for ethanol and 0.3% for 2,2,2-trifluoroethanol.
Table 1. Tait Equation Parameters, Obtained from Fitting to the Experimental Isotherms
x (TFE) 278.15 K 298.15 K 318.15 K 338.15 K 0 ρ* (g cm−3) 0.80170 0.78484 0.76748 0.74924 A (cm3g−1) 0.11172 0.10963 0.11456 0.12186 B (Mpa) 88.404 74.144 66.455 60.000 0.1969 ρ* (g cm−3) 0.93696 0.91602 0.89426 0.87134 A (cm3g−1) 0.087018 0.092938 0.095856 0.095281 B (Mpa) 74.876 68.800 59.548 48.000 0.3909 ρ* (g cm−3) 1.06094 1.03597 1.01009 0.98295 A (cm3g−1) 0.075798 0.079897 0.084561 0.087077 B (Mpa) 71.316 63.583 56.363 47.340 0.5000 ρ* (g cm−3) 1.12801 1.10071 1.07279 1.04336 A (cm3g−1) 0.070978 0.075662 0.078917 0.081816 B (Mpa) 70.263 63.313 55.000 46.338 0.6019 ρ* (g cm−3) 1.18881 1.15983 1.12984 1.09834 A (cm3g−1) 0.067999 0.072815 0.075505 0.077688 B (Mpa) 70.983 64.475 55.426 46.247 0.7985 ρ* (g cm−3) 1.30181 1.26955 1.23640 1.20149 A (cm3g−1) 0.066303 0.066338 0.068461 0.071201 B (Mpa) 78.255 65.184 55.858 47.314 1 ρ* (g cm−3) 1.41581 1.38144 1.34577 1.30816 A (cm3g−1) 0.059290 0.059613 0.063135 0.065090 B (Mpa) 78.195 66.496 59.235 49.951
The volumetric behavior of mixtures may be expressed in terms of the molar excess volume VmE
∑
= −
VmE Vm x Vi m,i (4)
where Vmis the molar volume of the mixture and xi and Vm,i are, respectively, the mole fraction and molar volume of each component.
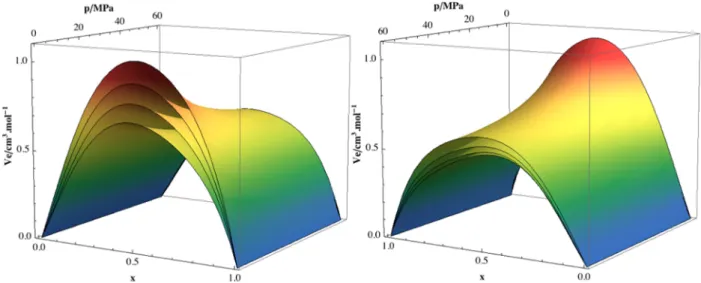
The excess molar volumes were calculated as a function of temperature and pressure for all the studied compositions, using the pure component densities from the respective Tait equation. Figure 1 shows smoothed surface representations of VE, and the calculated values can be found in the Supporting Information. The data at 298.15 K and atmospheric pressure compare very favorably with the literature results of Sassi and Atik39and of Minamihonoki et al.40
It can be seen from Figure 1 that the (ethanol + 2,2,2-trifluoroethanol) system presents excess molar volumes which are always positive and fairly large, with the VmEsurfaces almost
symmetrical relative to the equimolar composition; it can also be seen that the excess volumes increase with temperature and decrease with pressure. The maximum values at atmospheric pressure range from 0.70 cm3mol−1at 278.15 K to 1.04 cm3 mol−1at 338.15 K; at 60 MPa pressure, these decrease to 0.52 cm3mol−1at 278.15 K and to 0.59 cm3mol−1at 338.15 K.
For conveniency, the excess molar volume results were correlated, at several constant pressures, with Redlich−Kister equations:
= + −
VmE/x x1 2 A0 A x1( 1 x2) (5) and the coefficients are presented in Table 2.
The isothermal compressibilityκT for the studied composi-tions was calculated from the pressure dependence of the experimental densities, using the analytical derivative of the Tait equation: κ ρ ρ ρ = ∂ ∂ = + * + + * + ⎜ ⎟ ⎛ ⎝ ⎜ ⎞ ⎠ ⎟ ⎛⎝ ⎞⎠ ⎡ ⎣ ⎢ ⎢ ⎛ ⎝ ⎜ ⎞ ⎠ ⎟⎤ ⎦ ⎥ ⎥ p A B P A B p B p 1 / (1/ ) ln T x T , (6) In Figure 2, the isothermal compressibilities at 298.15 K and different pressures, and at 0.1 MPa and different temperatures, are represented as a function of composition. Thefigure shows
that, for a given composition, the compressibility decreases with pressure and increases with temperature, as is usual with molecular fluids. However, it can also be seen that, at all temperatures and pressures, the compressibility presents a maximum value near the equimolar composition.
In a similar fashion, the thermal expansivity, or thermal expansion coefficient, αp, can be calculated from the
depend-ence of the density with temperature:
α ρ ρ = − ∂ ∂ ⎜ ⎟ ⎛ ⎝ ⎞ ⎠ T 1 p p x, (7)
In this case,αpwas estimated at the mean temperature of the
experimental measurements (308.15 K), at each pressure, approximating the derivative in eq 7 as the linear slope of density vs temperature. The results are presented in Figure 3, where it can be seen that the thermal expansion coefficient decreases with pressure; for all the studied mixtures,αpexceeds
the average value of the pure components, and at the lower pressures, it goes through a maximum, at a composition closer to pure 2,2,2-trifluoroethanol.
5. DISCUSSION
As previously explained, this study is part of a project in which we seek to understand the effect of mixing fluorinated and hydrogenated molecules that simultaneously associate through hydrogen bonding. In this work, the (ethanol + 2,2,2-Figure 1.Two perspectives of the excess volume vs pressure and composition surfaces at each of the four studied temperatures. From bottom to top: 278.15, 298.15, 318.15, and 338.15 K.
Table 2. Parameters of the Redlich−Kister Equation (eq 5)a
T (K) p (MPa) Ai(cm3mol−1) 278.15 298.15 318.15 338.15 0.1 A0 2.855 3.270 3.712 4.212 A1 −0.111 −0.311 −0.417 −0.527 20 A0 2.474 2.768 3.025 3.261 A1 −0.123 −0.232 −0.310 −0.480 40 A0 2.263 2.440 2.612 2.753 A1 −0.056 −0.154 −0.243 −0.359 60 A0 2.143 2.207 2.339 2.447 A1 0.045 −0.081 −0.194 −0.217
aThe root-mean-square deviation of eachfit is lower than 0.02 cm3
trifluoroethanol) mixture was chosen. The effect of mixing hydrogenated and fluorinated segments can be assessed comparing the properties of this mixture with those of a mixture of ethanol and a hydrogenated alcohol with a similar molar volume of 2,2,2-trifluoroethanol. That would be (ethanol + 1-propanol), as the molar volume of 2,2,2-trifluoroethanol is only slightly lower than that of 1-propanol.
Given its importance, the (ethanol + 2,2,2-trifluoroethanol) system has been studied at 298.15 K and atmospheric pressure by a few other authors. Minamihonoki et al.40determined the excess molar volumes and excess molar enthalpies and found positive VmE (VmE1/2 = 0.8 cm3 mol−1) and negative HmE
(HmE
1/2=−700 J mol−1). Sassi et al. 39
also measured the excess volumes at 298.15 K and atmospheric pressure, and their results agree with those of Minamihonoki et al. The VmEvs x curve is
fairly symmetrical, whereas HmE is slightly asymmetrical with
the minimum near x (TFE) = 0.4. Smith et al.41studied the vapor−liquid equilibrium of this system at 298.15 K and found a negative azeotrope at x (TFE) = 0.4.
Using the activity coefficients reported by Smith et al.,41we have calculated the excess Gibbs energy as a function of composition, which, along with the HmE vs x curve by
Minamihonoki et al., were used to calculate the excess molar entropy for the system (Figure 4). As can be seen, the values of
HmEand GmEare very close to each other, and consequently,
the excess molar entropy is very small, indicating that the entropy of mixing for (ethanol + 2,2,2-trifluoroethanol) is mainly determined by its ideal contribution. The TSmE vs x
curve seems to be S-shaped, negative for TFE molar fractions up to 0.25 and positive for higher molar fractions.
The simultaneous existence of large positive excess molar volumes, large negative excess molar enthalpy (negative deviations to Raoult’s law and negative azeotrope), and practically ideal entropy of mixing is a clear indication of the complexity of this binary mixture.
For comparison, it should be mentioned that mixtures of primary hydrogenated alcohols display positive excess volumes and enthalpies, which are very small when the alcohols have similar chain length and increase with the difference in chain length. On the other hand, mixtures of alkanes and perfluoroalkanes exhibit large positive excess volumes and enthalpies. Thus, the (ethanol + 2,2,2-trifluoroethanol) mixture displays an opposite behavior relatively to mixtures of hydrogenated alcohols. Moreover, the negative excess enthalpy of (ethanol + 2,2,2-trifluoroethanol) seems to be an indication of stronger cross interactions between the hydrogenated and fluorinated alcohols. The positive excess volume can be either a sign of less efficient packing or weaker interaction between the hydrogenated andfluorinated segments, as found for mixtures of alkanes and perfluoroalkanes.
In order to obtain additional understanding on this binary system at the molecular level, we performed computer simulations (molecular dynamics). We have simulated the pure liquid components, ethanol and 2,2,2-trifluoroethanol, as a function of temperature (at 5, 25, 45, and 65 °C). The Figure 2.Isothermal compressibility as a function of composition. (a)
Values at 298.15 K and 0.1 MPa (◆), 20 MPa (■), 40 MPa (▲), and 60 MPa (●). (b) Values at 0.1 MPa and 278.15 K (∗), 298.15 K (◆), 318.15 K (+), and 338.15 K (×).
Figure 3. Average thermal expansion coefficient as a function of composition at 0.1 MPa (◇), 20 MPa (□), 40 MPa (△), and 60 MPa (○).
Figure 4.Excess molar enthalpy (■, experimental points; solid line, smoothing curve),40excess molar Gibbs energy (dotted line, calculated from data of activity coefficients from ref 41), and excess molar entropy times temperature (gray line) for mixtures of 2,2,2-trifluoroethanol with ethanol as a function of composition at 298.15 K.
simulation results are collected in Table 3 and compared with the experimental results from this work in Figure 5. As can be
seen, the agreement between simulated and experimental results is very good for both ethanol and 2,2,2-trifluoroethanol.
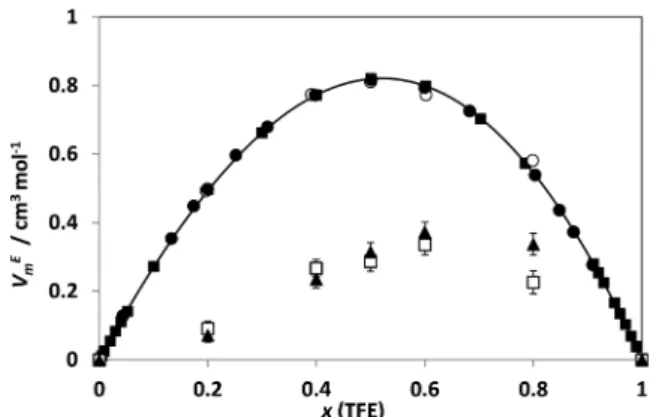
Liquid densities and molar enthalpies have also been obtained by simulation for binary mixtures at 1 bar and 298.15 K as a function of composition, which allow us to calculate both the excess volumes and excess enthalpies. The results are collected in Table 4 and compared with experimental data in Figures 6 and 7.
As can be seen, the simulation is able to predict both the sign and order of magnitude of the excess molar volume for this system, though underestimating the value of the maximum by a factor of 2.5. The simulated curve (VmEvs x) also seems to be
more asymmetrical than the experimental curve. The prediction of the excess molar enthalpy is excellent, especially taking into account the typical difficulty in estimating this property and the fact the cross parameters have not been subjected to any kind offitting or reduction. Both the sign and order of magnitude are predicted, although the absolute values of HmE are
overestimated (more negative) by a factor of 1.6. The shape of the HmEvs x curve seems to be well reproduced.
Most studies on mixtures of alkanes and perfluoroalkanes have interpreted the observed behavior of these systems as resulting from a particularly weak interaction between hydro-genated and fluorinated segments, around 10% weaker than predicted by the usual geometric mean. In atomistic simulations, this has been implemented by reducing the H−F dispersive interaction by a factor of 25%. Following this reasoning, we have obtained a second set of simulations, at the same conditions, in which the H−F dispersive interaction was reduced by 25%. The results are collected in Table 5 and Table 3. Densities of Pure Components Obtained by
Computer Simulation as a Function of Temperature
ρ (kg m−3)
T (K) ethanol 2,2,2-trifluoroethanol
278.15 814.7± 0.1 1399.3± 0.3
298.15 793.0± 0.1 1361.0± 0.4
318.15 770.4± 0.1 1320.4± 0.4
338.15 746.0± 0.1 1277.1± 0.3
Figure 5.Percent deviations between densities obtained by computer simulation and experimental results for ethanol42 (□) and 2,2,2-trifluoroethanol38(■).
Table 4. Densities, Molar Volumes and Enthalpies, Excess Molar Volumes and Enthalpies of Mixtures 2,2,2-Trifluoroethanol + Ethanol as a Function of Composition Obtained by Simulation at 298.15 K and 1 bar
x (TFE) ρ (kg m−3) Vm(cm3mol−1) V
mE(cm3mol−1) Hm(J mol−1) HmE(J mol−1)
0 793.0± 0.1 58.09± 0.01 0 8979± 10 0 0.2 928.1± 0.1 61.27± 0.01 0.09± 0.02 15401± 7 −836 ± 19 0.4 1048.6± 0.2 64.52± 0.01 0.27± 0.03 22439± 9 −1057 ± 23 0.5 1105.5± 0.2 66.08± 0.01 0.29± 0.03 26072± 11 −1054 ± 25 0.6 1159.3± 0.2 67.67± 0.01 0.33± 0.03 29822± 7 −933 ± 22 0.8 1259.9± 0.3 70.65± 0.02 0.41± 0.03 37414± 18 −601 ± 30 1 1361.0± 0.4 73.50± 0.02 0 45273± 27 0
Figure 6.Excess molar volumes for mixtures of 2,2,2-trifluoroethanol and ethanol as a function of composition at 1 bar and 298.15 K:□, simulation results with Berthelot rule;▲, simulation results with kij=
0.75 (both along error bars);○, experimental results from this work;
■, experimental results from ref 40;●, experimental results from ref 39.
Figure 7.Excess molar enthalpies for mixtures of 2,2,2-trifluoroethanol and ethanol as a function of composition at 1 bar and 298.15 K:□, simulation results;▲, simulation results with kij= 0.75 (the error bars
compared with experimental data in Figures 6 and 7. As can be seen, the agreement between the experimental and simulated excess enthalpy is now remarkable. However, the simulated excess volumes remain practically unaffected. Radial distribu-tion funcdistribu-tions have also been computed for this set of simulations and found to be indistinguishable from the previous. These results are in agreement with the results of Song et al.11These authors have simulated the (CH4 + CF4) and (hexane + perfluorohexane) mixtures, using the OPLS-AA force field, nonreducing and reducing the H−F dispersive interaction by 25%. For both systems, they have found that this reduction is essential to bring agreement between the simulated and experimental excess enthalpy but practically does not affect the simulated excess volume. It is interesting to note that in the present case the simulations predict relatively large positive excess volumes, even without reducing the H−F interaction. Moreover, this reduction does not affect the simulated excess volumes. We believe that this is a clear indication that the large positive excess volumes found in mixtures of hydrogenated and fluorinated chains cannot by entirely related to the weak dispersive interactions. Additionally, it should be recognized that the main physical reason for the volume increase in these systems is still not included in the model. Although the exact reason remains unidentified, these results clearly suggest that it should be connected to the repulsive part of the intermolecular potential.
Computer simulations have also been performed for equimolar mixtures of (ethanol + 2,2,2-trifluoroethanol) at four different temperatures in order to study the influence of temperature on the excess molar volume for this system. The simulation results are compared with experimental values in Figure 8a. As can be seen, the simulation is able to capture the temperature dependence of the excess molar volume, showing, as temperature increases, similar deviations from the exper-imental results as those at 298.15 K. An estimate of VmE(x =
0.5) at 25 °C and 500 bar was also made by computer simulation. The comparison with experimental results is shown in Figure 8b. Again, the model is able to reproduce the trend of VmE as a function of pressure, showing, at higher pressure,
similar deviations from the experimental results as those at atmospheric pressure.
As previously mentioned, the large negative excess enthalpy of (ethanol + 2,2,2-trifluoroethanol) is an indication of stronger cross interactions between the hydrogenated and fluorinated alcohols. In order to find out if the simulation results could provide arguments in favor of this assumption, we have calculated the radial distribution function, g(r), for an equimolar mixture of ethanol and 2,2,2-trifluoroethanol at 298 K and 1 atm (Figure 9). Four curves are shown, corresponding to all O−H pairs interacting through hydrogen bonds. As can be seen, three of these display approximately the
same intensity. However, the curve corresponding to hydrogen bonding between the oxygen atom in ethanol and the hydrogen Table 5. Densities, Molar Volumes and Enthalpies, Excess Molar Volumes and Enthalpies of Mixtures 2,2,2-Trifluoroethanol + Ethanol as a Function of Composition Obtained by Simulation, Usingkij= 0.25
x (TFE) ρ (kg m−3) Vm(cm3mol−1) VmE(cm3mol−1) Hm(J mol−1) HmE(J mol−1)
0 793.0± 0.1 58.09± 0.01 0 8979± 10 0 0.2 928.4± 0.1 61.25± 0.01 0.07± 0.02 15587± 6 −651 ± 17 0.4 1049.1± 0.2 64.49± 0.01 0.24± 0.03 22696± 7 −801 ± 20 0.5 1105.0± 0.2 66.11± 0.01 0.31± 0.03 26378± 7 −748 ± 21 0.6 1158.6± 0.2 67.71± 0.01 0.37± 0.03 30108± 7 −647 ± 22 0.8 1261.3± 0.2 70.76± 0.01 0.34± 0.03 37652± 8 −363 ± 24 1 1361.0± 0.4 73.50± 0.02 0 45273± 18 0
Figure 8. Excess molar volumes for equimolar mixtures of 2,2,2-trifluoroethanol and ethanol as a function of (a) temperature and (b) pressure: □, simulation results (along error bars);■, experimental results from this work.
Figure 9.Radial distribution functions for the hydroxyl O−H pairs in equimolar mixtures of 2,2,2-trifluoroethanol (TFE) and ethanol (EtOH).
atom in 2,2,2-trifluoroethanol is much more intense than the others. The relative intensity of the peaks follows the difference of the partial charges assigned to the interacting atoms (a quantum mechanical calculation has shown that these charges are realistic). The oxygen atom in ethanol has the highest negative partial charge, while the hydroxyl hydrogen atom in 2,2,2-trifluoroethanol has the highest positive partial charge. Therefore, the hydrogen bond between this pair displays the most intense peak. It should be kept in mind that in this model hydrogen bonds are effectively included through the Coulomb interactions between partial charges. We have also determined the distribution of hydrogen bonds from the simulated trajectory, by counting as hydrogen bonded all intermolecular O−H pairs within 2.67 Å, which corresponds to the first minimum in the radial distribution functions of Figure 9. The distribution of the hydrogen bonding in the simulation is O(EtOH)−H(TFE) = 36%; O(EtOH)−H(EtOH) = 25%; O(TFE)−H(EtOH) = 20%; O(TFE)−H(TFE) = 19%, confirming the preferential character of the O(EtOH)− H(TFE) interaction.
■
CONCLUSIONSIn this work, the effect of mixing hydrogenated and fluorinated molecules that simultaneously interact through strong hydro-gen bonding was investigated. The liquid density of (ethanol + 2,2,2-trifluoroethanol) mixtures was measured as a function of composition, at several temperatures from 278.15 to 353.15 K and from atmospheric pressure up to 70 MPa. The corresponding excess molar volumes, compressibilities, and expansivities were calculated over the whole (p,ρ, T, x) surface. The excess volumes are found to be positive, increasing with temperature and decreasing with pressure. The isothermal compressibility and the average thermal expansivity show maxima as a function of composition.
The mixture displays a very complex behavior when compared with mixtures of hydrogenated alcohols and mixtures of alkanes and perfluoroalkanes: large and positive excess volumes (unlike those of mixtures of hydrogenated alcohols) and large and negative excess enthalpies (unlike those of mixtures of alkanes and perfluoroalkanes).
Atomistic molecular dynamics simulations, using the OPLS-AA force field, reveal a balance between less favorable interactions (weak dispersion forces between the hydrogenated and fluorinated groups) and a preferential hydrogen bond between ethanol and 2,2,2-trifluoroethanol. Furthermore, it was found that reducing the F−H dispersive interaction by 25% is essential to bring agreement between the experimental and simulated excess enthalpy but leaves the excess volumes unaltered. This clearly indicates that the volume increase in these systems cannot be entirely ascribed to the weak dispersive interactions between hydrogenated andfluorinated groups, as it is usually assumed. While the exact reason for this behavior is still not understood, these results distinctly suggest that it should be connected to the repulsive part of the intermolecular potential.
■
ASSOCIATED CONTENT*
S Supporting Information(1) Density data tables and (2) OPLS-AA functions and parameters. This material is available free of charge via the Internet at http://pubs.acs.org.
■
AUTHOR INFORMATIONCorresponding Author
*E-mail: efi[email protected]. Phone: +351218419261.
Notes
The authors declare no competingfinancial interest.
■
ACKNOWLEDGMENTSP.M. acknowledges funding from Fundação para a Ciência e Tecnologia, in the form of a grant (No. SFRH/BPD/81748/ 2011). E.J.M.F. acknowledges funding from the Fundação para Ciência e Tecnologia through Grant Nos. POCI/QUI/61850/ 2004 and PEst-OE/QUI/UI0100/2011.
■
REFERENCES(1) Simons, J. H.; Dunlap, R. D. The Properties of n-Pentforane and Its Mixtures with n-Pentane. J. Chem. Phys. 1950, 18, 335−346.
(2) Rowlinson, J. S.; Swinton, F. L. Liquids and Liquid Mixtures, 3rd ed.; Butterworth Scientific: London, 1982.
(3) Siebert, E. M. D.; Knobler, C. M. Interaction Virial Coefficients in Hydrocarbon-Fluorocarbon Mixtures. J. Phys. Chem. 1971, 75, 3863− 3870.
(4) Brode, S.; McDonald, I. R. Excess Thermodynamic Properties of Liquid Mixtures of Methane and Perfluoromethane. Mol. Phys. 1988, 65, 1007−1012.
(5) Schoen, M.; Hoheisel, C.; Beyer, O. Liquid CH4, Liquid CF4 and the Partially Miscible Liquid Mixture CH4/CF4. Mol. Phys. 1986, 58, 699−709.
(6) Archer, A. L.; Amos, M. D.; Jackson, G.; McLure, I. A. The Theoretical Prediction of the Critical Points of Alkanes, Perfluor-oalkanes, and Their Mixtures Using Bonded Hard-Sphere (BHS) Theory. Int. J. Thermophys. 1996, 17, 201−211.
(7) Cui, S. T.; Cochran, H. D.; Cummings, P. T. Vapor-Liquid Phase Coexistence of Alkane Carbon Dioxide and Perfluoroalkane Carbon Dioxide Mixtures. J. Phys. Chem. B 1999, 103, 4485−4491.
(8) McCabe, C.; Galindo, A.; Gil-Villegas, A.; Jackson, G. Predicting the High-Pressure Phase Equilibria of Binary Mixtures of Perfluoro-n-alkanes Plus n-Alkanes Using the SAFT-VR Approach. J. Phys. Chem. B 1998, 102, 8060−8069.
(9) Duce, C.; Tinè, M. R.; Lepori, L.; Matteoli, E. VLE and LLE of Perfluoroalkane + Alkane Mixtures. Fluid Phase Equilib. 2002, 199, 197−212.
(10) Schneider, G. M. High-Pressure Phase Equilibria and Spectroscopic Investigations up to 200 MPa on Fluid Mixtures Containing Fluorinated Compounds: a Review. Fluid Phase Equilib. 2002, 199, 307−317.
(11) Song, W.; Rossky, P. J.; Maroncelli, M. Modeling Alkane/ Perfluoroalkane Interactions Using All-Atom Potentials: Failure of the Usual Combining Rules. J. Chem. Phys. 2003, 119, 9145−9162.
(12) Zang, L.; Siepmann, J. I. Pressure Dependence of the Vapor-Liquid-Liquid Phase Behavior in Ternary Mixtures Consisting of n-Alkanes, n-Perfluoroalkanes, and Carbon Dioxide. J. Phys. Chem. B 2009, 109, 2911−2919.
(13) Potoff, J. J.; Bernard-Brunel, D. A. Mie Potentials for Phase Equilibria Calculations: Application to Alkanes and Perfluoroalkanes. J. Phys. Chem. B 2009, 113, 14725−14731.
(14) Haslam, A. J.; Galindo, A.; Jackson, G. Prediction of Binary Intermolecular Potential Parameters for Use in Modelling Fluid Mixtures. Fluid Phase Equilib. 2008, 266, 105−128.
(15) Morgado, P.; Tomás, R.; Zhao, H.; dos Ramos, M. C.; Blas, F. J.; McCabe, C.; Filipe, E. J. M. Solution Behavior of Perfluoroalkanes and Perfluoroalkylalkane Surfactants in n-Octane. J. Phys. Chem. C 2007, 111, 15962−15968.
(16) Morgado, P.; Rodrigues, H.; Blas, F. J.; McCabe, C.; Filipe, E. J. M. Perfluoroalkanes and Perfluoroalkylalkane Surfactants in Solution: Partial Molar Volumes in n-Octane and Hetero-SAFT-VR Modelling. Fluid Phase Equilib. 2011, 306, 76−81.
(17) Lepori, L.; Matteoli, E.; Spanedda, A.; Duce, C.; Tinè, M. R. Volume Changes on Mixing Perfluoroalkanes with Alkanes or Ethers at 298.15 K. Fluid Phase Equilib. 2002, 201, 119−134.
(18) Turberg, M. P.; Brady, J. E. Semifluorinated Hydrocarbons− Primitive Surfactant Molecules. J. Am. Chem. Soc. 1988, 110, 7797− 7801.
(19) Binks, B. P.; Fletcher, P. D. I.; Kotsev, S. N.; Thompson, R. L. Adsorption and Aggregation of Semifluorinated Alkanes in Binary and Ternary Mixtures with Hydrocarbon and Fluorocarbon Solvents. Langmuir 1997, 13, 6669−6682.
(20) Mahler, W.; Guillon, D.; Skoulios, A. Smectic Liquid-Crystal from (Perfluorodecyl) Decane. Mol. Cryst. Liq. Cryst., Lett. Sect. 1985, 2, 111−119.
(21) Viney, C.; Russell, T. P.; Depero, L. E.; Twieg, R. J. Transitions to Liquid-Crystalline Phases in a Semifluorinated Alkane. Mol. Cryst. Liq. Cryst. 1989, 168, 63−82.
(22) Viney, C.; Twieg, R. J.; Russell, T. P.; Depero, L. E. The Structural Basis of Transitions between Highly Ordered Smectic Phases in Semifluorinated Alkanes. Liq. Cryst. 1989, 5, 1783−1788.
(23) Morgado, P.; Zhao, H.; Blas, F. J.; McCabe, C.; Rebelo, L. P. N.; Filipe, E. J. M. Liquid Phase Behavior of Perfluoroalkylalkane Surfactants. J. Phys. Chem. B 2007, 111, 2856−2863.
(24) Morgado, P.; Lewis, J. B.; Laginhas, C. M. C.; Martins, L. F. G.; McCabe, C.; Blas, F. J.; Filipe, E. J. M. Systems Involving Hydrogenated and Fluorinated Chains: Volumetric Properties of Perfluoroalkanes and Perfluoroalkylalkane Surfactants. J. Phys. Chem. B 2011, 115, 15013−15023.
(25) Morgado, P.; Laginhas, C. M. C.; Lewis, J. B.; McCabe, C.; Martins, L. F. G.; Filipe, E. J. M. Viscosity of Liquid Perfluoroalkanes and Perfluoroalkylalkane Surfactants. J. Phys. Chem. B 2011, 115, 9130−9139.
(26) Morgado, P. Ph.D. Thesis, Instituto Superior Técnico, Lisboa, 2011.
(27) Wagner, W.; Pruß, A. The IAPWS Formulation 1995 for the Thermodynamic Properties of Ordinary Water Substance for General and Scientific Use. J. Phys. Chem. Ref. Data 2002, 31, 387−535.
(28) Cibulka, I.; Takagi, T. P−ρ−T Data of Liquids: Summarization and Evaluation. 5. Aromatic Hydrocarbons. J. Chem. Eng. Data 1999, 44, 411−419.
(29) Cibulka, I.; Takagi, T.; Růžička, K. P−ρ−T Data of Liquids: Summarization and Evaluation. 7. Selected Halogenated Hydro-carbons. J. Chem. Eng. Data 2001, 46, 2−28.
(30) Jorgensen, W. L.; Maxwell, D. S.; Tirado-Rives, J. Development and Testing of the OPLS All-Atom Force Field on Conformational Energetics and Properties of Organic Liquids. J. Am. Chem. Soc. 1996, 118, 11225−11236.
(31) Duffy, E. M. Ph.D. Thesis, Yale University, 1994.
(32) Chitra, R.; Smith, P. E. A Comparison of the Properties of 2,2,2-Trifluoroethanol and 2,2,2-2,2,2-Trifluoroethanol/Water Mixtures Using Different Force Fields. J. Chem. Phys. 2001, 115, 5521−5530.
(33) Bekker, H.; Berendsen, H. J. C.; Dijkstra, E. J.; Achterop, S.; van Drunen, R.; van der Spoel, D.; Sijbers, A.; Keegstra, H.; Reitsma, B.; Renardus, M. K. R. Gromacs: A Parallel Computer for Molecular Dynamics Simulations. In Physics Computing 92; de Groot, R. A., Nadrchal, J., Eds.; World Scientific: Singapore, 1993.
(34) Hess, B.; Kutzner, C.; van der Spoel, D.; Lindahl, E. GROMACS 4: Algorithms for Highly Efficient, Load-Balanced, and Scalable Molecular Simulation. J. Chem. Theory Comput. 2008, 4, 435−447.
(35) Nosé, S. A Molecular-Dynamics Method for Simulations in the Canonical Ensemble. Mol. Phys. 1984, 52, 255−268. Hoover, W. G. Canonical Dynamics - Equilibrium Phase-Space Distributions. Phys. Rev. A 1985, 31, 1695−1697.
(36) Parrinello, M.; Rahman, A. Polymorphic Transitions in Single-Crystals - a New Molecular-Dynamics Method. J. Appl. Phys. 1981, 52, 7182−7190. Nosé, S.; Klein, M. L. Constant Pressure Molecular-Dynamics for Molecular-Systems. Mol. Phys. 1983, 50, 1055−1076.
(37) Cibulka, I.; Ziková, M. Liquid Densities at Elevated Pressures of 1-Alkanols from C1 to C10: A Critical Evaluation of Experimental-Data. J. Chem. Eng. Data 1994, 39, 876−886.
(38) Cibulka, I.; Takagi, T. P−ρ−T Data of Liquids: Summarization and Evaluation. 8. Miscellaneous Compounds. J. Chem. Eng. Data 2002, 47, 1037−1070.
(39) Sassi, M.; Atik, Z. Excess Molar Volumes of Binary Mixtures of 2,2,2-Trifluoroethanol with Water, or Acetone, or 1,4-Difluoroben-zene, or 4-Fluorotoluene, or Alpha, Alpha, Alpha, Trifluorotoluene or 1-Alcohols at a Temperature of 298.15 K and Pressure of 101 kPa. J. Chem. Thermodyn. 2003, 35, 1161−1169.
(40) Minamihonoki, T.; Ogawa, H.; Nomura, H.; Murakami, S. Thermodynamic Properties of Binary Mixtures of 2,2,2-Trifluoroetha-nol with Water or Alka2,2,2-Trifluoroetha-nols at T=298.15 K. Thermochim. Acta 2007, 459, 80−86.
(41) Smith, L. S.; Tucker, E. E.; Christian, S. D. Vapor-Density and Liquid-Vapor Equilibrium Data for Binary Mixtures of 2,2,2-Trifluoroethanol with Water, Methanol, Ethanol, and 2-Butanol. J. Phys. Chem. 1981, 85, 1120−1126.
(42) Cibulka, I. Saturated Liquid Densities of 1-Alkanols from c(1) to c(10) and n-Alkanes from c(5) to c(16) - a Critical-Evaluation of Experimental-Data. Fluid Phase Equilib. 1993, 89, 1−18.