Prospect Evaluation as an Emerging Pre-Evaluation Technique in
the Case of Great Plains Wheat Producers
’
Use of Web 2.0
Technology
Nicholas R. Brown Jenks Middle School
Kathleen D. Kelsey University of Georgia
We introduce a pre-evaluation technique, prospect evaluation, in the case of Great Plains wheat producers’ practices with Web 2.0. We emerged prospect evaluation as a pre-evaluation technique, expanding the role of evaluative logic and reasoning into the ideation phase of project and product development to close the risk gap between project idea and implementation. Prospect evaluation serves as a prequel to the well-established developmental, formative, and
summative evaluation models. We implemented the prospect evaluation technique in the context of iWheat, a USDA-funded Web 2.0 project (currently known as myFields, http://myfields.info/dashboard). Wheat producers were comfortable using computers; however, they conceptualized the Internet with a Web 1.0 mindset that depends on a centralized model of development and delivery of content. Wheat producers were not comfortable actively co-creating useful information for the betterment of community, a fundamental underpinning of Web 2.0 advancement. Extension specialists and educators should focus on the
rewards of contributing to Web 2.0 sites and proceed in diffusing Web 2.0 tools to the wheat producers. Prospect evaluation was sufficient for helping project leaders bridge the risk gap and move forward with the project.
Keywords: prospect evaluation, evaluation techniques, Web 2.0, wheat producer Internet attitudes and behaviors
Introduction and Background of Prospect Evaluation
of a technological innovation, iWheat.org and Web 2.0 (iWheat’s name changed to myFields after completion of this study, http://myFields.info/dashboard).
iWheat.org was conceptualized as a dynamic interactive website using Web 2.0 tools to allow Great Plains wheat producers to input and access information regarding integrated pest management (IPM) principles for improving wheat production outcomes by providing
information on pests in real time. The site was envisioned to allow wheat producers access to data for the evaluation and management of pests.
One aspect of the project included building a decision support system for wheat pests so users of the site could employ and unify binomial sequential sampling methods. The project was
dependent upon users to input field-based data using a Web 2.0 interface. Users included wheat producers, crop consultants, and IPM professionals from five states in the Great Plains region. Stakeholders were necessary co-researchers, inputting data regarding pests observed in their fields. The resulting database predicted infestation rates throughout the Great Plains, allowing producers to plan for and mitigate emerging outbreaks ahead of the actual event. Ideally, the data would be compiled to create prediction models of pest infestation alongside IPM
management strategies to mitigate the impact of infestation.
The project leader sought evaluative information to understand better wheat producers’ intention to contribute to the database before the project launched. The evaluation team conceptualized prospect evaluation and developed a technique to pre-evaluate the prospect of an emerging idea. In this case, we were charged with the task of discovering wheat producers’ behaviors and attitudes related to computer and Internet use. Our data would then inform decision making among the iWheat.org project leadership team.
Purpose and Evaluation Questions
The purpose of the research reported here is two-fold: to introduce a new pre-evaluation technique, prospect evaluation, and to document wheat producers’ levels of awareness and attitudes regarding the use of Internet technology, specifically Web 2.0 tools. Specific evaluation questions were:
1. How do wheat producers use computers?
2. How do wheat producers use the Internet, specifically Web 2.0 technologies? 3. What is the relationship between selected wheat producers’ farming and personal
Literature Review
Web 2.0
Cooperative Extension Service (CES) disseminates research-based knowledge to the public through a variety of communication channels, including Web 2.0 (Brunner & Yang, 1949; Hightower, Murphrey, & Dooley, 2010; Kelsey & Stafne, 2012). In a Web 2.0 environment, users actively participate in selecting information and services delivered to them, including contributing content to shape the online environment. Examples of Web 2.0 applications include social media, blogging, wikis, and tagging. Key aspects of Web 2.0 include “a focus on data -based services, not on software; large numbers of small channels to consumers, not small
numbers of big ones; [and] inherent scalability, not ever-growing server-farms” (Clarke, 2008, p. 34). Desirable attributes of Web 2.0 include flexible web design, reuse, instant updating
capability, responsive user interface, collaborative creation of content, mash-ups or the ability to combine different applications and data from a variety of sources, social networking, and ability to build a collective archive of knowledge (Murugesan, 2007).
Educational leaders opine that Web 2.0 may have been over-promoted as the ends versus the means of education attainment, cautioning educators not to replace relationships with technology in educational settings (Reeves, 2009). In spite of the minor voice of dissent, Web 2.0 remains extremely popular with businesses and consumers alike, and it is predicted to become a mainstay of the Internet experience (Reeves, 2009). It is therefore incumbent upon Land-Grant University faculty to engage with Web 2.0 applications to disseminate information to the public. The iWheat.org application was envisioned as a Web 2.0 tool positioned to improve wheat-farming outcomes and is predicated upon data contributions from a variety of users, including wheat producers, researchers, and Extension specialists.
Trust and e-Commerce
Possible barriers to the success of iWheat.org included a lack of trust among potential contributors with providing data in a Web 2.0 environment, specifically proprietary data regarding wheat producers’ pest infestation situation. Internet users were concerned about privacy in the online environment (Joinson, Reips, Buchanan, & Schofield, 2010); however, reported concerns did not always match behavior. For example, Spiekermann, Grossklags, and Berendt (2001) found little evidence that privacy preferences matched actual behavior when shopping online.
privacy was mediated by trust. The variable of trust was then manipulated. As trust in the Internet site increased, willingness to share private information also increased. High trust equaled low privacy concerns and vice versa.
Adult Use of Information Technology
The Internet has saturated American media channels and become a primary source of
information for 74% of American adults (Rainie, 2010). In the Western United States, over 70% of agricultural producers used the Internet (Wozniacka, 2011).
Czaja and Lee (2008) studied adults’ use of information technology and summarized the
literature succinctly. Highlights of their research include the following that informed our work:
People of all ages must use the Internet to function in society.
Older adults who do not use the Internet are disadvantaged in many domains, including independence and a reduced quality of life.
Older adults (i.e., age 55 and over) own and use computers at about one-half the rate of younger adults (i.e., age 35 to 54).
Older adults value technology and are receptive to using it; however, they face greater challenges using computers than younger adults.
Website design is a barrier to use for older adults as they are twice as likely as younger adults to have difficulty navigating the Internet.
Training is effective to teach older adults how to use computers and the Internet; however, they are slower and less able to acquire new skills and require more help and practice to master skills than younger adults.
Computer design (e.g., hardware) and webpage design are critical factors for facilitating computer and Internet use among older adults.
Conceptual Framework
The prospect evaluation technique was underpinned by the concept of trust, leading to
participants’ willingness to contribute private, and at times, proprietary information to a Web 2.0 application for the purpose of enhancing all contributors’ wheat production operations. “Trust is critical in understanding when we choose to share personal information with others and when we choose secrecy” (Joinson et al., 2010, p. 4) in an online environment.
of risk is necessary to build a trusting relationship. We term this risk as the risk gap that must be crossed to advance the relationship. The factors underlying Mayer et al.’s (1995) model of trust include ability, benevolence, and integrity, which leads to the trustor’s propensity to trust, balanced by the perceived risk. Degrees of trust or bridging the risk gap lead to a risk-taking relationship and desirable outcomes.
Mayer et al. (1995) explained ability as a “group of skills, competencies, and characteristics that enable a party to have influence within some specific domain” (p. 717); benevolence as “the extent to which a trustee is believed to want to do good to the trustor, aside from an egocentric profit motive” (p. 717); and integrity as “the trustor’s perception that the trustee adheres to a set of principles that the trustor finds acceptable” (p. 719). Benevolence and integrity constitute the bridge over the risk gap.
The crux of the iWheat.org project rested on wheat producers’ trust in the iWheat.org website, leading to their willingness to contribute to a Web 2.0 database that collected private wheat pest data, compiled it, and allowed researchers to make predictions about oncoming pest infestations. If enough producers contributed proprietary field-specific data to the online database, reliable models could then be created and shared with stakeholders to reduce the impact of the infestation regionally. The project depended on the project leaders creating a high trust relationship with wheat producers in five states.
If wheat producers perceived the iWheat.org site and its creators as able, benevolent, and having integrity, they would have a higher propensity to trust the site, reducing the perceived risk of contributing, thus increasing their willingness to provide data and reducing the risk gap. The reward for sharing data, or outcome, was having access to compiled data and models regarding pest infestations from all wheat producers. One goal in developing the prospect evaluation technique was to estimate the risk gap for our client prior to developing the iWheat.org website. Prospect evaluation technique emerged to test the idea prior to project implementation.
A Plan for Emerging the Pre-Evaluation Technique
We approached the evaluation challenge from the stance of emerging an original technique sensitive to the evolving state of evaluation in the 21st Century and the necessity of expanding the role of evaluation logic and reasoning into the ideation phase of project and product
development; as a prequel to the well-established developmental (Patton, 2011), formative, and summative evaluation models (Scriven, 1967). We termed our new technique prospect
new project, program, or intervention. Prospect evaluators are first and foremost explorers, forging ahead of the project leadership team to collect evidence regarding the success of the project. Prospect evaluators collect data and report back to the client to inform about the risks and rewards of the proposed journey, thus, reducing the risk gap.
Components of prospect evaluation include brainstorming, forming ideas, considering all
options, imagining possibilities, and then seeking empirical information to deepen understanding of how options may play out. Not only is the evaluator part of the leadership team’s
conversation as prescribed by Patton’s (2011) developmental evaluation, he/she also adds value by bringing data to the table to co-construct the new project/product/innovation with the team in advance of full implementation. Prospect evaluation is unique from needs assessment (NA) in that NA focuses on desired conditions. Prospect evaluation focuses on projects, products, and innovations in the imagination stage of development for the purpose of closing the risk gap. For example, when Extension faculty develop an inkling of an idea, they bring the team together to engage in prospect evaluation.
Emerging prospect evaluation as a new technique for infusing evaluation services into the iWheat.org Extension project began as the client called for information to identify the risks and opportunities associated with an emerging idea that eventually led to iWheat.org. We recognized the need to supplement client decision making with empirical data regarding wheat producers’ (stakeholders) behaviors and attitudes toward using Web 2.0 tools for production management decisions. The innovation was predicated on the idea that wheat producers would input location-specific and original data into a Web 2.0 database, resulting in prediction models for pest
infestation rates and occurrences. Thus, the clients needed to understand better if producers would indeed contribute to the database.
Prospect evaluation emerged out of the need to evaluate the ideas of the clients (R. Stake, personal communication, March 16, 2013) in an effort to bring evaluation techniques into the brainstorming and negotiating process of ideation. Prospect evaluation is performed before developmental evaluation (Patton, 1994, 2011) in the evaluative life of the project and is a unique contribution to the evaluation literature (Alkin, 2013; Fitzpatrick, Sanders, & Worthen, 2011; Rossi, Lipsey, & Freeman, 2004; Stufflebeam, 2001).
Population and Sampling
The target population consisted of all wheat producers who attended 2011 CES wheat production field days hosted by project directors in Colorado, Kansas, Nebraska, Oklahoma, and Texas (N = 531). The population was deemed appropriate because it represented a sector of the greater population of agriculturalists that had demonstrated an interest in interacting with Extension specialists and that were known wheat producers. In all, 457 field day participants agreed to complete the questionnaire, resulting in an 86% response rate. Due to the high response rate, no tests for non-response error were necessitated (Lindner, Murphy, & Briers, 2001) and, all data were considered population parameters.
Instrumentation
To collect data, we developed a questionnaire in consultation with Land-Grant University wheat experts. Questionnaire sections included 40 items designed to collect self-reported, descriptive information regarding participants’ use of computers, use of the Internet, intention to use Web 2.0 applications in the future, and demographic characteristics. Respondents’ attitudes were also measured by computing a composite mean score of six Likert-type items (Boone & Boone, 2012).
A panel of experts consisting of wheat specialists and agricultural education faculty established content and face validity. The questionnaire was beta tested by three wheat producers who were not included in the study. Beta testing consisted of asking the participants to complete the survey and talk aloud to capture flaws in the questioning and layout. A post hoc reliability analysis of all Likert data was calculated resulting in a Cronbach’s alpha (Kirk, 1995) of .90.
Analysis of Data
SPSS for Macintosh 20 was used for all data analysis procedures. Many wheat producers did not respond to every questionnaire item; as a result, the number of respondents varied by
questionnaire construct. Data related to the evaluation questions were analyzed by computing descriptive statistics through central modes of tendency and variability. When appropriate, means, frequencies, and percentages were calculated. In an effort to answer the third evaluation question, we compared mean scores to determine if between-groups differences in attitude scores were present. The use of inferential statistics to test for statistical significance was not
Findings of the Wheat Producer Survey
The first evaluation question explored wheat producers’ behaviors associated with computer use. Eighty-six percent (f = 393) owned a personal computer, 62.8% (f = 287) owned a laptop, and 43.1% (f = 197) owned a smart phone. Most producers (82.5%, f = 377) used the computer themselves, while only 20.8% (f = 95) reported asking an assistant to use the computer for them. Respondents also felt comfortable using computers (77.5%, f = 345). They used the computer for communications (76.1%, f = 348) and to find information about farm-related topics (81.8%, f = 374). Fewer wheat producers used computers to keep farming records (61.7%, f = 282).
The second evaluation question asked how wheat producers used the Internet, specifically Web 2.0 technologies. Seventy-eight percent (f = 358) used the Internet and had been doing so for almost 10 years. Respondents connected to the Internet using one or more of the following: cable, 3G card, smartphone, and wireless technologies. Only 8.3% (f = 38) used dial-up. The wheat producers in this study used Email (80.5%, f = 368), search engines (78.6%, f = 359), and to a lesser extent Facebook (37.6%, f = 172). They also used the Internet to access news sources, (68.5%, f = 313), read farming websites (61.7%, f = 282), shop (62.6%, f = 286), communicate with others (69.4%, f = 317), and find information (75.3%, f = 344). Only 43.5% used the Internet to find information related specifically to wheat production (f = 199). The majority used the Internet 1 to 10 times per week (56.7%, f = 259), while 23% used it 11 or more times per week (f = 105).
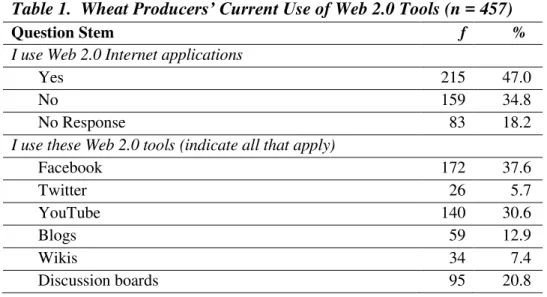
When wheat producers were asked if they currently use Web 2.0 Internet tools, 47% (f = 215) indicated that they used the tools, but only 24.7% (f = 113) used Web 2.0 to find information pertaining to wheat production issues. See Table 1 for additional information about wheat producers’ current use of Web 2.0 tools.
Table 1. Wheat Producers’ Current Use of Web 2.0 Tools (n = 457)
Question Stem f %
I use Web 2.0 Internet applications
Yes 215 47.0
No 159 34.8
No Response 83 18.2
I use these Web 2.0 tools (indicate all that apply)
Facebook 172 37.6
Twitter 26 5.7
YouTube 140 30.6
Blogs 59 12.9
Wikis 34 7.4
I use Web 2.0 tools to (indicate all that apply)
Communicate with my friends and family 174 38.1 Learn about current events 198 43.3 Learn about wheat production issues 113 24.7
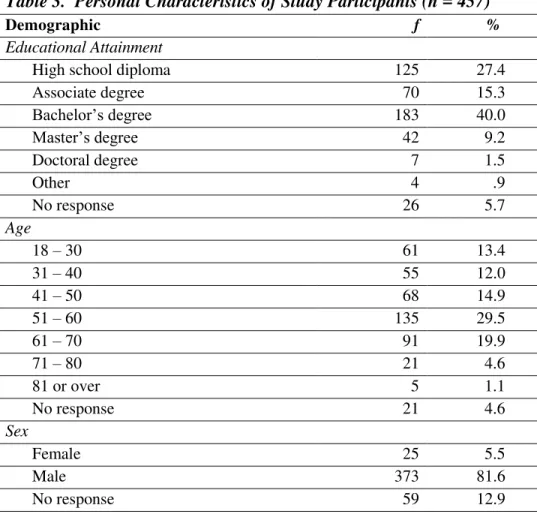
The third evaluation question asked about the relationship between selected wheat producers’ farming and personal characteristics and their attitudes pertaining to the usefulness of using Web 2.0 tools for wheat production. Tables 2 and 3 provide farming and personal characteristics of the wheat producers who participated in the study. Thirty-four percent of respondents (f = 156) currently farm 500 acres or less, while approximately 24% (f = 109) farm 2,001 acres or more. All five states in the project area were represented in the data with Nebraska having the lowest number of farms represented (f = 11). When asked about education, 306 (66.9%) respondents had obtained a post-secondary degree. Finally, 252 (55.1%) respondents were 51 years old or older.
Table 2. Farming Characteristics of Study Participants (n = 457)
Demographic f %
Acres of Wheat Production
0 – 500 156 34.2
501 – 1000 75 16.4
1001 – 1500 33 7.2
1501 – 2000 39 8.5
2001 or more 109 23.9
No response 45 9.8
State Where Farm is Located
Colorado 164 35.9
Kansas 101 22.1
Texas 74 16.2
Oklahoma 66 14.4
Nebraska 11 2.4
Other 1 .2
No Response 40 8.8
Years of Wheat Farming Experience
Less than 10 91 19.9
11 to 20 60 13.1
21 to 30 64 14.0
31 to 40 109 23.9
41 or more 78 17.1
Table 3. Personal Characteristics of Study Participants (n = 457)
Demographic f %
Educational Attainment
High school diploma 125 27.4
Associate degree 70 15.3
Bachelor’s degree 183 40.0
Master’s degree 42 9.2
Doctoral degree 7 1.5
Other 4 .9
No response 26 5.7
Age
18 – 30 61 13.4
31 – 40 55 12.0
41 – 50 68 14.9
51 – 60 135 29.5
61 – 70 91 19.9
71 – 80 21 4.6
81 or over 5 1.1
No response 21 4.6
Sex
Female 25 5.5
Male 373 81.6
No response 59 12.9
We measured wheat producers’ attitudes pertaining to Web 2.0 use in their production enterprise by calculating a composite score of six Likert-type items to create a Likert scale for reporting overall mean attitude scores (Boone & Boone, 2012). Producers were asked to indicate their level of agreement with positive statements associated with the value of employing Web 2.0 tools for wheat production. The scale was arranged as follows: strongly disagree (1.00 – 1.49), disagree (1.50 – 2.49), neutral (2.50 – 3.49), agree (3.50 – 4.49), and strongly agree (4.50 – 5.00). In all, wheat producers exhibited an agreeing attitude ( = 3.57; = .85) regarding the expediency of using Web 2.0 tools for wheat production.
Table 4. Mean Attitude Scores by Years of Farming Experience (n = 270)
Years of Wheat Farming Experience f
Less than 10 77 3.66 .86
11 to 20 46 3.86 .99
21 to 30 43 3.55 .87
31 to 40 69 3.46 .77
41 or more 35 3.33 .63
Note: Differences between means resulted in a small to medium effect size (ηp2 = .037; Cohen, 1988).
Table 5. Mean Attitude Scores by Age (n = 283)
Age f
18 – 30 51 3.89 .81
31 – 40 45 3.69 .91
41 – 50 40 3.60 .91
51 – 60 89 3.50 .78
61 – 70 54 3.41 .63
71 – 80 4 2.21 .63
Note: Differences between means resulted in a medium effect size (ηp2= .075;
Cohen, 1988).
Conclusions and Implications
On average, wheat producers own computers, including laptops and smartphones, and are
comfortable using them. They use the Internet to communicate and gather information, although to a lesser degree in gathering wheat production information. We conclude that computer usage will not be a barrier among this group of wheat producers for using the iWheat.org website. It should be noted that less than half of the wheat producers own a smartphone. Therefore, they are less likely to positively respond to a website predicated on the idea that data will be retrieved and uploaded in the field and designed to primarily work on a tablet or smartphone. Based on high Internet use for communications and shopping, we predict that wheat farmers have a high degree of trust in Internet sites.
respondents conceptualized the Internet with a Web 1.0 mindset in that they depended on a centralized concept (Clarke, 2008) and were not yet comfortable with active participation—the fundamental underpinning of the Web 2.0 paradigm (Murugesan, 2007). Respondents reported a high willingness to be “vulnerable to the actions” (Mayer et al., 1995, p. 712) of the trusted groups who host such sites, yet did not see themselves as co-creators of content.
Because many of the producers (75%) reported not using the Internet to find wheat production information, we predict their use of iWheat.org to be low. The Land-Grant University must build producers’ trust in its websites by increasing benevolence and integrity of Web 2.0 sites like iWheat.org (Mayer et al., 1995). If wheat producers are only willing to consume rather than contribute data to iWheat.org, the project will fail, as Web 2.0 tools rely on producers to
contribute proprietary field-specific data to the online database.
The typical wheat producer represented in the study was a middle-age male (over 50) and had earned an associate or bachelor’s degree. The acres farmed were from 1,000 acres or less (51%) to over 2,001 acres (25%) of wheat. While producers were willing to use Web 2.0 technologies with reservations, they agreed that Web 2.0 could be a useful tool to incorporate into their wheat enterprise.
When comparing the mean attitude scores by age, we found that older producers exhibited a more negative attitude about the utility of using Web 2.0 tools in their production. We
triangulated the validity of this finding by comparing mean attitude scores of wheat producers by years of experience, as it is expected that years of experience and age were related.
Consequently, mean differences when comparing age groups resulted in a medium effect size, and mean differences when comparing attitude scores by years of wheat farming experience resulted in a similar effect size. Therefore, the data align with literature regarding adult learners’ willingness to use computers and their need for training and support to improve skills (Czaja & Lee, 2008). As users age, they need more training and support to gain trust in the technology and medium of communication.
As Extension specialists diffuse iWheat.org, they are uniquely positioned to introduce Web 2.0 tools to producers and stress the value of integrating iWheat.org as a management practice due to their historical mission of disseminating agricultural knowledge to the public (Brunner & Yang, 1949). Extension has historically earned trust by demonstrating the ability to conduct research, exhibiting benevolence by teaching best practices, and establishing integrity through well-educated professional field specialists (Brunner & Yang, 1949).
Our prospect evaluation judgment is that wheat producers will reluctantly use Web 2.0
technology if Extension specialists and educators build trust in the site and train producers to use it to the mutual benefit of the wheat production community. There remains a delicate
Recommendations
We recommend that the iWheat.org team proceed with the innovation; however, careful design choices that result in a website resembling known Web 2.0 sites with which wheat producers are already using and comfortable, such as Facebook®, are paramount to success. To cross the risk gap and encourage wheat producers to contribute to iWheat.org, Extension specialists and
educators are advised to build trust primarily through addressing privacy concerns (Joinson et al., 2010). The Land-Grant University has established ability, benevolence, and integrity over its 150-year history; however, Web 2.0 is unchartered territory for many in the target audience. Using the previously established base of trust, Extension specialists and educators should focus on the rewards of contributing to the iWheat.org site to encourage use.
It is important to note that adult users are comfortable using computers; however, they need more training and support than younger users. Extension educators are advised to not only hold
workshops about iWheat.org as a production tool but also to include lessons on how to use computers and the Internet for a variety of benefits to the total lifestyle of participants, including finding social security and Medicare information online. Non-computer users are disadvantaged in a knowledge-based society, thus offering value-added Extension workshops would serve to extend the mission of the Land-Grant system and educate wheat producers about the iWheat.org innovation and other Web 2.0 innovations.
Reflections on Prospect Evaluation
As an emerging pre-evaluation technique, prospect evaluation holds great promise for the discipline. The concept of evaluating the merit of an idea proved invaluable to the iWheat.org team in moving ahead with recommended cautions to reduce the risk gap for project leaders. We recommend that others adopt this technique when working in interdisciplinary teams to introduce innovations yet untested in the marketplace. The challenge for evaluators remains in
mainstreaming evaluation at every phase of a project, from ideation to development, implementation, and measurement of outcomes and impacts. Prospect evaluators must
simultaneously act as explorers who mine data for informed decision making and innovative co-creators armed with social science research methods that bring about meaningful change in society. Finally, we recommend that project leaders adopt prospect evaluation for all high-risk projects to close the risk gap.
References
Boone, H. N., Jr., & Boone, D. A. (2012). Analyzing Likert data. Journal of Extension, 50(2), Article 2TOT2. Retrieved from http://www.joe.org/joe/2012april/tt2.php
Brunner, E. S., & Yang, E. H. P. (1949). Rural America and the Extension Service: A history and critique of the Cooperative Agricultural and Home Economics Extension Service. New York, NY: Columbia University.
Clarke, R. (2008). Web 2.0 as syndication. Journal of Theoretical and Applied Electronic Commerce Research, 3(2), 30–43. doi:10.4067/S0718-18762008000100004
Cohen, J. (1988). Statistical power analysis for the behavioral sciences (2nd ed.). Hillsdale, NJ: Lawrence Erlbaum.
Creswell, J. W. (2008). Educational research: Planning, conducting, and evaluating quantitative and qualitative research (3rd ed.). Upper Saddle River, NJ: Pearson Education.
Czaja, S. J., & Lee, C. C. (2008). Information technology and older adults. In A. Sears & J. A. Jacko (Eds.), The human-computer interaction handbook: Fundamentals, evolving technologies, and emerging applications (2nd ed.; pp. 777–792). New York, NY: CRC Press.
Fitzpatrick, J. L., Sanders, J. R., & Worthen, B. R. (2011). Program evaluation: Alternative approaches and practical guidelines (4th ed.). Upper Saddle River, NJ: Pearson.
Hightower, T. E., Murphrey, T. P., & Dooley, K. E. (2010). A qualitative analysis of the history of e-extension (eXtension) and the implementation of Moodle™ (A learning management system). Paper presented at the National Research Conference of the American
Association of Agricultural Education, Omaha, NE.
Joinson, A. N., Reips, U. -D., Buchanan, T., & Schofield, C. B. P. (2010). Privacy, trust, and self-disclosure online. Human-Computer Interaction, 25(1), 1–24.
doi:10.1080/0770020903586662
Kelsey, K. D., & Stafne, E. T. (2012). A model for evaluating eXtension Communities of Practice. Journal of Extension, 50(5), Article 5FEA1. Retrieved from
http://www.joe.org/joe/2012october/a1.php
Kirk, R. E. (1995). Experimental design: Procedures for the behavioral sciences (3rd ed.). Pacific Grove, CA: Brooks/Cole.
Lindner, J. R., Murphy, T. H., & Briers, G. H. (2001). Handling nonresponse in social science research. Journal of Agricultural Education, 42(4), 43–53. doi:10.5032/jae.2001.04043 Mayer, R. C., Davis, J. H., & Schoorman, F. D. (1995). An integrative model of organizational
trust. Academy of Management Review, 20(3), 709–734. doi:10.5465/AMR.1995.9508080335
Murugesan, S. (2007). Understanding Web 2.0. IT Professional, 9(4), 34–41. doi:10.1109/MITP.2007.78
Patton, M. Q. (1994). Developmental evaluation. Evaluation Practice, 15(3), 311–319. doi:10.1016/0886-1633(94)90026-4
Rainie, L. (2010, January 5). Internet, broadband, and cell phone statistics. The Pew Research Center’s Internet & American Life Project, November 30–December 27, 2009. Retrieved from http://www.pewinternet.org/Reports/2010/Internet-broadband-and-cell-phone-statistics.aspx?r=1
Reeves, D. B. (2009). The learning leader: Three challenges of Web 2.0. Educational
Leadership, 66(6), 87–89. Retrieved from http://www.ascd.org/publications/educational-leadership/mar09/vol66/num06/Three-Challenges-of-Web-2.0.aspx
Rossi, P. H., Lipsey, M. W., & Freeman, H. E. (2004). Evaluation: A systematic approach (7th ed.). Thousand Oaks, CA: Sage.
Scriven, M. (1967). The methodology of evaluation. In R. E. Stake (Ed.), Curriculum evaluation: American Educational Research Association Monograph Series on Evaluation (No. 1, pp. 39–83). Chicago, IL: Rand McNally.
Spiekermann, S., Grossklags, J., & Berendt, B. (2001). E-privacy in 2nd generation E-commerce: Privacy preferences versus actual behavior. Proceedings of the 3rd Association for
Computing Machinery Conference on Electronic Commerce, 38–47. doi:10.1145/501158.501163
Steinberg, W. J. (2008). Statistics alive! Thousand Oaks, CA: Sage.
Stufflebeam, D. (2001). Evaluation models. New Directions for Evaluation, 89(2001), 7–98. doi:10.1002/ev.3
Wozniacka, G. (2011, September 12). More U.S. farmers using Internet in daily business [Web log post]. Retrieved from http://www.fresnobee.com/2011/08/26/2513429/more-us-farmers-conducting-business.html
Dr. Nicholas R. Brown is principal at Jenks Middle School, Jenks, OK.
Dr. Kathleen D. Kelsey is Professor and Department Head in the Department of Agricultural Leadership, Education and Communication at the University of Georgia, Athens, GA.
Acknowledgement