Numerical analysis of nonlinear behavior of steel
concrete composite structures
Análise numérica do comportamento não linear
de estruturas mistas de aço e concreto
Abstract
Resumo
This paper presents the development of an efective numerical formulation for analysis of steel concrete composite structures considering geometric and materials nonlinear efects. Thus, a methodology based on Reined Plastic Hinge Method (RPHM) was developed and the stifness parameters obtained by homogenization of cross section. The evaluation of structural elements strength is done through the Strain Compatibility Method (SCM). The Newton-Raphson method with path-following strategies is adopted to solve nonlinear global and local (in cross section level) equations. The results are compared with experimental and numerical database presents in literature and a good accuracy is observed in composite cross section, columns and portal frames.
Keywords: nonlinear analysis, RPHM, interaction curves, SCM, moment-curvature relationship.
O presente trabalho apresenta o desenvolvimento de uma formulação numérica adequada para análise de estruturas mistas de aço e concreto considerando os efeitos da não linearidade geométrica e da inelasticidade dos materiais. Para tal, foi desenvolvida uma metodologia baseada no Método da Rótula Plástica Reinado (MRPR), sendo os coeicientes de rigidez obtidos por meio da homogeneização da seção transversal. A avaliação da capacidade resistente dos elementos estruturais é feita no contexto do Método da Compatibilidade de Deformações (MCD). Os problemas oriundos da consideração das fontes de não linearidade (global e local) são resolvidos por meio do método iterativo de Newton--Raphson acoplado a estratégias de continuação. Os resultados obtidos são comparados com aqueles fornecidos em análises experimentais e/ ou numéricas presentes na literatura, sendo veriicada boa precisão nas análises de seções transversais mistas, pilares isolados mistos e pórticos simples mistos.
Palavras-chave: análise não linear, MRPR, curvas de interação, MCD, relação momento-curvatura.
a Departamento de Engenharia Civil, Escola de Minas, Universidade Federal de Ouro Preto, Ouro Preto, Minas Gerais, Brasil.
Received: 19 Dec 2015 • Accepted: 15 May 2016 • Available Online: 06 Feb 2017
Í. J. M. LEMES a
[email protected] A. R. D. SILVA a
R. A. M. SILVEIRA a
[email protected] P. A. S. ROCHA b
1. Introduction
When considering the nonlinear behavior of structures, the ap-proaches proposed by design codes become less realistic as the structural elements become slender. In the current context, the use of high-strength materials in construction gives rise to less rigid structures that are susceptible to large displacements. Accurate analysis of such structures requires the use of computational tools that take into account both the nonlinear behavior of the geometry of the structure and the bearing capacity of its structural elements. Structures made up of two or more materials are referred to as composite structures. The objective of this sort of combination is to ind a balance between the materials, one that minimizes the unfavorable characteristics of each component. For example, con-crete has been used only to protect steel against corrosion and ire agents, although it also happens to contribute to increasing the bearing capacity and stifness of the structure. This idea spurred the irst composite steel-concrete structural elements.
It is not at all simple to deine the stifness and bearing capacity of composite structural elements and the complexity is due to the concrete’s anisotropic characteristics. Design codes [1-2] propose simpliied methodologies for deining these stifness parameters and full yield curve that can either approximate or hold of the ac-tual behavior of the structure [3].
One alternative for obtaining accurate results in a way that is more computationally feasible is the Reined Plastic Hinge Meth-od (RPHM). Usually the RPHM is associated with the analysis of steel [4-5] and composite structures [6-7]. In these approaches, the cross-section lexural stifness is possibly degraded by pseudo-spring elements inserted in the ends of inite elements. The deg-radation begins when the combination of the axial force and the bending moment exceeds the limit of the elastic stage imposed by the initial yield curve. In other words, the cross-section maintains linear elastic behavior only up to the beginning of this curve. When it comes to assessing the bearing capacity of the composite steel-concrete elements using Strain Compatibility Method (SCM) [2, 7], two strategies stand out. For nonlinear problems, propo-nents of quasi-Newton methods, such as Chen et al. [8] and Liu et al. [9], use this solution procedure, coupled with the
Regula-Falsi numerical scheme. The process consists of determining the neutral axis position and its orientation (3D problem), which are the parameters set in the iterative cycle. In such manner, one can obtain the cross section bearing capacity. The Newton-Raphson method [10-11] uses, however, as the axial strain adjustment vari-ables the membrane efect at the plastic centroid of the section and the curvature efect in one of the main axes (2D problem). The axial strain of each discrete point in the section is then determined and the respective constitutive relationships are used for the sum of stresses. The procedure consists of constructing the moment-curvature relationship (nonlinear problem), where, for a given axial force, the limit point that is found for the bending moment relects the axial force-bending moment combination responsible for the plastiication of the section. By analyzing moment-curvature the stifness parameters can be determined. Chiorean [11] obtained the lexural rigidity of the section based on the tangent to the mo-ment-curvature. Liu et al. [12] has already reduced the moment of
inertia of reinforced concrete elements as cracking occurred. Fur-thermore, Chan et al. [13] used the homogenized stifness section
to calculate the coeicients of the stifness matrix.
This work aims to couple the SCM to RPHM to provide the Com-putational System of Advanced Structural Analysis (CS-ASA) plat -form [7] a -formulation that is capable of assessing the load carrying capacity of composite structures while considering both the efects of geometric and physical nonlinearities. It is a new formulation within the context of evaluating plasticity in a concentrated form. Thus, the formulation retains the simplicity and small computation-al efort of RPHM and takes into account the accuracy of the SCM in the evaluation of cross section bearing capacity. While some recent studies have similarly coupled RPHM and SCM, none of their analyses of the bearing capacity of the cross-section uses the construction of the moment-curvature relationship. Moreover, to expand the range of analysis possibilities, the study also imple-ments prescriptive requireimple-ments [1-2] to obtain the load carrying capacity of the elements. This would make it possible to assess the structural behavior of composite elements based on design codes considerations and to compare results obtained using the general-ized formulation proposed by coupling RPHM with SCM.
2. Fundamentals for nonlinear
structural analysis
The global nonlinear structural problem in the context of the Finite Element Method (FEM) and RPHM/SCM, is resolved by the follow -ing equation:
(1)
(
, ,
)
@
λ
F U P
iS
F
rwith Fi the internal force vector, which is written on the basis of nodal
displacement vector U, internal forces in members, P, and the evalu-ation parameter of the lexural section stifness degradevalu-ation , S. The external forces vector is deined by the product between the load pa-rameter, l, and Fr, which is the external forces vector of reference. Equation (1) is solved here by the Newton-Raphson method used in conjunction with path-following strategies, such as the general-ized displacement technique [14] and the minimum residual dis-placements method [15].
Computationally, the efects of geometric nonlinearity are intro-duced in the conventional stifness matrix by the matrix Ks, K1 and K2. Ks is the geometric stifness matrix, K1 is a linear function of the incremental nodal displacements while the terms in the matrix K2 are quadratic functions [16]. Terms of higher order (K1 and K2) can be neglected, especially when the structures are rigid and the material nonlinearity is more relevant.
3. Concentrated plasticity analysis
The computer program CS-ASA [5] has been under development since 2009 and has already been established for the nonlinear analysis of steel structures. This program uses the Reined Plastic Hinge Method (RPHM) [4] to simulate the concentrated plasticity in the nodal points.
n there is full interaction between the materials present in the
cross-section;
n the elements are initially straight, prismatic, and warpage may
be ignored;
n the structure is perfectly locked on to the orthogonal axis (2D
problem);
n efects of localized instability are neglected;
n large displacements and rigid body rotations are allowed; n shear strain efects are neglected.
In the modeling, the beam-column inite element used is shown in Fig. 1. This element is deined by the nodes i and j. Also illus-trated are the internal forces, Mi, Mj and P, as well as their
respec-tive degrees of freedom qi, qj and d, referenced to the corrotational system. Null length pseudo-springs are inserted, at the ends of the element, to simulate the degradation of lexural stifness by parameter S.
The S parameter is set within three domains (Fig. 2). When in the
elastic state, the value of S is assumed to be 1016. Such a state is
limited by the beginning of initial yield curve. Upon reaching the plastic state (a situation where the internal forces reach the full yield curve), the lexural stifness is completely degraded. In this case, S is taken to be numerically equal to 10-10. Between the initial and full yield curves, the loss of stifness is considered to occur gradually, according to the following equation:
(2)
( )
æ
-
ö
=
ç
÷
-è
ø
comp pr
er
EI
M
M
S
L
M M
where L is the length of the inite element; Mpr is the full yield mo-ment and Mer the initial yield moment, which will be deined in
Sec-tion 4; and (EI)comp is the lexural stifness of the homogenized com-posite section that, for doubly symmetrical and comcom-posite beams section, is given by [17]:
(3a)
( )
EI
comp=
h
ë
é
( ) ( ) (
EI
a+
EI
b+
µEI
)
cù
û
(3b)
( )
EI
comp=
E
a(
0,4
I
comp+
0,6 '
I
comp)
where the subscripts a, b, and c refer to steel section, the
rein-forcement bar, and concrete; m is the reduction factor for the lex-ural stifness of concrete due to cracking; h is a reducing of the global stifness coeicient; and Icomp and I’comp are the moments of inertia of the composite section in the positive and negative mo -ment regions, respectively.
For the element shown in Fig. 1, the force-displacement relation-ship is expressed by [9]:
(4)
(
) ( )
(
)
(
)
2 20
0
Δ
Δ δ
Δ
0
/β
/β
Δθ
Δ
0
/
β
/β
Δθ
é
ù
ì
ü
ê
ú
ì
ü
ï
ï
=
ê
-
+
ú
ï
ï
í
ý
ê
ú
í
ý
ï
ï
ï
ï
ê
ú
î
þ
ë
-
+
û
î
þ
i i i jj j i j ij i
j j
i j ji j j ii i
/
comp
EA L
P
M
S S k S
S S k
M
S S k
S S k S
or
Δ
f
co=
K u
coD
cowith b = (Si + kii)(Sj + kjj) - kjikij. The subscripts i and j indicate the
nodes of the element and co the subscript to the coordinate system
used (corrotational); (EA)comp is the axial stifness of the homog-enized cross-section; DP and DM are, respectively, the incremental
axial force and bending moment; Dd and Dq are the increments of axial strain and nodal rotation.
The terms kii, kij, kji and kjj are obtained according to the Yang
and Kuo’s formulation [14]. When the section plastify, any in-crease in incremental load causes the internal forces to extrapo-late the full yield curve, therefore, violating the cross-section bearing capacity. The formulation used here avoiding this viola-tion is a strategy known as Return Mapping [5]. In this strategy, the element axial force remains constant and returns the inter-nal bending moment to the full yield curve. In other words, Eq. (4) is modiied so that in these situations the bearing capacity of the elements is not violated.
4. Strain compatibility method
The bending moments Mpr and Mer, used in Eq. (2), are obtained in
the context of the Strain Compatibility Method (SCM). Compared to the simpliied design codes procedures [1, 2], a more realistic approach is produced by the coupling of the deformed shape of section and the constitutive relationships of the materials com-prising it. To satisfactorily obtain the strain ield in the section, the cross-section discretization is necessary. In the discretization, the strength may be suiciently evaluated with two-dimensional layers, but this procedure is sensitive to the degree of reinement imposed by the analyst.
Figure 1
Hybrid finite element with section springs
Figure 2
4.1 Steel behavior
Fong and Chan [6] proposed for both the reinforcing bars and for the steel section an elastic-perfectly-plastic constitutive relation-ship (shown in Fig. 3), as described below:
(5)
σ ε
ì
ï
í
ï
î
if
- £ £ -
ε
uε
ε
ya
if
ε
- < <
yε ε
yy
if
ε
y£ £
ε
ε
u-
f
yE
f
where fy is the yield strength of steel, Ea the Young’s modulus of steel,
ey and eu the elastic limit and inal limit of steel strains, respectively.
4.2 Concrete behavior
When compressed, the parabolic-rectangular stress-strains rela-tionship is adopted (Fig. 4a), limited by the last of the concrete
compressive strain, ecu. As proposed by Bazant and Oh [18], it is
also possible to consider the tensile strength given by a bilinear model with a positive slope until reaching the beginning of cracking strain, etr, along with the ultimate tensile strength, fcr (Fig. 4b). The strain limit to the tensioned concrete is considered here as 0.0007, adopted by Bratina et al. [19]. We thus have:
(6)
(
)
c
2 c ci ci
tr
tr,2 cr
-f if
2ε
ε
σ
=
ε
-
ε
f
if
E
ε
if
E
ε-ε if
é
æ
ö
ù
ê
ç
÷
ú
ê
è
ø
ú
ë
û
cu ci
ε ε
£
£
ε
ci
ε < ε 0
£
cr
0 ε ε
£
£
ì
ï
ï
ï
ï
í
ï
ï
ï
ïî
0,
0007
³
ε > ε
crwhere fc is the maximum compression strength of concrete, Etr and
Etr,2 are the concrete modulus of elasticity in tension, before and
after cracking. eci is the strain limit of the parabolic curve of the compressed concrete.
4.3 Moment-curvature relationship
Once the cross-section is discretized, in using the SCM coupled with the Newton-Raphson Method, there are two relevant vari-ables: the area of the layers and their respective positions. This second is referred to as the plastic centroid (PC), so as to minimize convergence problems [8].
The position of the PC section is obtained by the following expres-sion [20]:
(7)
γ
γ
+
+
=
+
+
c c cd a a yd b b ybd cp
c cd a yd b ybd
y A f
y A f
y A f
y
A f
A f
A f
with Ac, Aa and Ab being the concrete, steel, and the reinforcing
bars areas; g is the confinement coefficient of concrete; yc, ya
and yb are the coordinates of the respective areas’ centroids
Figure 3
Steel constitutive relationship
Figure 4
on the ordinate axis in relation to a reference system; and fcd,
fyd and fybd are the compressed concrete, steel and reinforcing
bars strength, respectively.
Figure 5 illustrates the distribution of strains in the composite section from a combination of axial force and bending moment. Note that the total axial strain at the ith slice, e
i, is given by a
linear function. Therefore:
(8)
0ε ε
i= +
f
y
iwhere yi is the distance between the of the analyzed layer and
the cross-section plastic centroids (PCs), e0 is the membrane strain in the section CP, and f its curvature.
For the matrix notation, the study adopted the following: the vari-ables e0 and f are the positions of the strain vector X = [e0 f]T. It is
necessary to adjust the vector X until the deformed shape of the section is consistent with the active external forces. This adjustment is made through the iterative process described below. Chiorean [11] pointed out that adopting X = 0 in the first iteration enables a faster convergence. Numerically, it can be said that the balance of the section is obtained when the fol-lowing equation is satisfied:
(9)
( )
=
-
@
0
F X f
extf
intwhere the external forces vector is depicted as fext = [N M] T.
But the internal force vector is given by classical integral ex-pressions for the axial force, Nint, and bending moment, Mint. Once areas, Ai, and positions, yi, of each layer are known, the
integral becomes the sum described as:
(10)
fint=σaiAai nfat
i=1
+ σciAci nfat
i=1
+ σbjAbj nb
j=1
- σcjAcj nb
j=1
Ʃ
Ʃ
Ʃ
Ʃ
Ʃ
Ʃ
Ʃ
Ʃ
σaiAaiyai nfat
i=1
+ σciAciyci nfat
i=1
+ σbjAbjybj nb
j=1
- σcjAcjycj nb
j=1
with nfat being the number of layers used in the discretization
of the cross-section and nb the number of reinforcing bars lines
present in the composite section. Layers stresses, s, are de-pendent on the deformed shape of the cross-section, and are therefore functions of e0 and f.
While it is appropriate to initiate the process with X = 0, con-vergence is achieved only in the first iteration if external forces are null. Thus, for the next iteration, k+1, the strain vector is
given by:
(11)
( ) ( )
11
'
-+
=
+
X
kX F X
k kF X
kwhere F’ is the tangent stiffness matrix of the cross-section or the Jacobian matrix of the nonlinear problem stated in Eq. (9), that is:
(12)
0 0ε
ε
é
ù
ê
ú
æ
ö ê
ú
=
ç
÷ ê
=
ú
è
ø
ê
ú
ë
û
¢
F
F
X
int int int intN
N
M
M
f
f
The convergence criterion adopted in this work is based on the ratio of the Euclidean norms of the unbalanced force vector, F, and the external forces vector, fext. Thus, this ratio should be less than a tolerance, assumed here to be 10-5.
Figure 6 details the flow chart of the process for obtaining the moment-curvature relationship.
When, for a given axial force, the maximum bending moment of the moment-curvature is reached, there is a total plastifica-tion of the secplastifica-tion. It is defined such that a pair of forces is a point on the full yield curve.
The initial yield curve also is obtained from the moment-curva-ture relation. When the first layer of the section presents axial strain, e, greater than the yield strain of the steel (section or longitudinal reinforcing bars) and/or the strain of the concrete’s initial plastification [6], the layer begins to degrade and conse-quently the section loses stiffness. The moment responsible for this fact is considered the initial yield moment.
Figure 5
5. Limitations of the analysis methodology
In addition to the simplifying assumptions mentioned in Section 3, such as the full interaction between the materials, the disre-gard of shear strain, and so forth, there are some limitations in the proposed analysis methodology. The use of pseudo-springs at the ends of the inite element model to simulate the plastic -ity leads to a simpliication consistent with the behavior of steel structures. In Figure 2, it can be seen that the rotational stif-ness of the springs, discussed in Section 3, is deined within three domains (elastic, elastoplastic and plastic). Once within the elastic state, the S parameter of the pseudo-spring is kept constant, i.e., regardless the materials used in the structure, there is linear elastic behavior. This characterizes the linear be-havior of the steel in Hooke’s Law, shown in Fig. 3, for strains smaller than ey. Thus for the numerical simulation of composite structures in this formulation, the axial and lexural stifness are evaluated by homogenizing the cross-section.
A more careful evaluation is called for in the study and analysis of reinforced concrete structures. As illustrated in Fig. 4, the
concrete exhibits nonlinea r behavior under compression from strains smaller than eci, which means a limitation to the use of pseudo-springs.
6. Numerical examples
The numerical strategies presented in previous sections are used now to aim at a nonlinear analysis of steel-concrete compos-ite structural systems. Evaluated examples are divided into four groups: interaction curves, isolated concrete-illed steel columns, rectangular concrete-illed tube made of high-strength materials and simple composite portal frame. The results are compared with those reported in the literature, obtained numerically and/or experi-mentally. To simulate the following examples, we used a computer equipped with an Intel Core i7 2.20 GHz and 8 GB of RAM.
6.1 Full yield curves
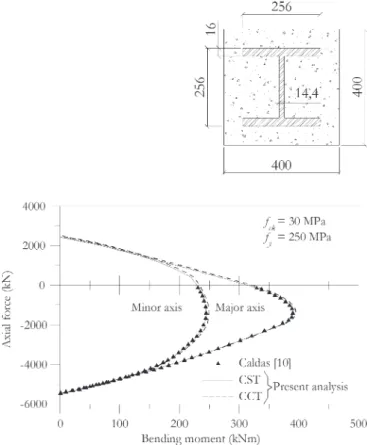
This section looks at the full yield curves of two steel-concrete composite cross-sections. At irst, the encased I section, shown in
Figure 6
Fig. 7, is evaluated around the major and minor axes. It is a steel I section (256 x 256 x 14.4 x 16 mm), where fy is taken to be equal
to 250 MPa, completely encased by concrete with fck 25 MPa. Fur -ther, the steel circular section is studied; its outside diameter is 400 mm; it is 10 mm thick with fy = 275 MPa illed with concrete
with fck of 35 MPa. In each case, two analyses will be made: a CST
analysis of the concrete will not have tensile strength; and a CCT analysis in which the constitutive relationship shown in Fig. 4b will be considered.
Interaction curves were constructed of 101 coordinate points (M, N), each of the sections discretized into 12 layers. Such data are presented in order to standardize comparative measures of run-time, which at that point were not provided in the literature. Figure 7 shows the full yield curves of the encased I section to major and minor axes. The study also evaluated the increase of the cross-section bearing capacity while considering the ten-sile behavior of concrete, as shown in Fig. 4b. Numerically, this increase is approximately 2.1% in the irst quadrant of the axial force-moment bending diagram. To construct the four curves, CS-ASA software took 0.57 seconds or 0.14 seconds, on average, to build each curve.
Figure 8 shows the bearing capacity behavior of a circular steel section illed with concrete. Once the section exhibited the same behavior in both the x and y axes, only one of the curves was
plot-ted. In this case, that took 0.28 seconds, averaging 0.14 seconds for each curve. There was a 1.7% increase in bearing capacity in the irst quadrant when considering the tensioned concrete contri-bution in the obtaining curve.
In the cases covered in this item, there was good agreement be-tween the results obtained by the Newton-Raphson Method and those provided by Caldas [10], who constructed the curve using
Figure 7
Full yield curves for encased I section
Figure 8
the D-strain parameter approach. In this method, one of the strain parameters is taken from the concrete strain domains, and the equations are thus adjusted to cycle through the deformed shapes for the ultimate limit state of the section. In both cases discussed in this item, the proposal to adopt the singularity condition of the Ja-cobian matrix of the cross-section (Eq. 12) as a stopping criterion for the construction of the moment-curvature relationship is veriied as being appropriate.
6.2 Concrete-illed steel columns
Seven concrete-illed steel circular columns were irst experimen-tally analyzed by Neogi et al. [21]. Liu et al. [12] and Fong and
Chan [6] used these experimental results to test their formulations based on RPHM. The simulated model consists of a column simply supported with an initial geometric imperfection (d=L/1000). A load eccentricity is introduced to the system considering bending mo-ments at both the top and base of the column, as shown in Fig. 9. To discretize the structural system, four inite elements are used. In local level, the circular cross-section was divided into 16 layers.
Figure 9
Idealized model for circular composite column with eccentric load analysis
Table 1
Geometry and material data
Specimen L (mm) e (mm) D (mm) t (mm) fy (kN/mm²) fcu (kN/mm²)
M1 3048 47,6 169,4 5,11 0,309 0,05553
M2 3048 38,1 169,2 5,26 0,309 0,054
M3 3048 47,6 168,9 5,66 0,295 0,04247
M4 3048 47,6 168,4 6,55 0,298 0,038
M5 3048 47,6 169,4 7,19 0,312 0,032
M6 3048 38,1 169,4 7,29 0,312 0,03318
M7 3022,6 47,6 168,9 8,81 0,323 0,03306
Figure 10
For the load increase strategy [14], the irst increase should be given and taken in this example as 2 kN.
The properties of the analyzed columns are shown in Table 1. The Young’s modulus of steel is taken to be equal to 207000 MPa for all specimens. According to Liu et al. [12], Neogi et al. [21] did not
provide the modulus of elasticity for concrete, so it is deined ac-cording to the ACI-318 recommendations [22].
Figure 10 ofers a comparison of the equilibrium path for Column M5 obtained with the CS-ASA, provided by the Neogi et al. [21]
and Liu et al. [12]. It can be observed in this same igure that there
exists a slight diference at the beginning of the equilibrium paths — the simulated model CS-ASA appears slightly stifer. Such di-vergence may be caused by the following sources: the geometric nonlinear formulation, the global and local reinements, plus some variables such as strain limits of the constitutive relationships of materials. After the load limit point is reached, the equilibrium paths are nearly the same.
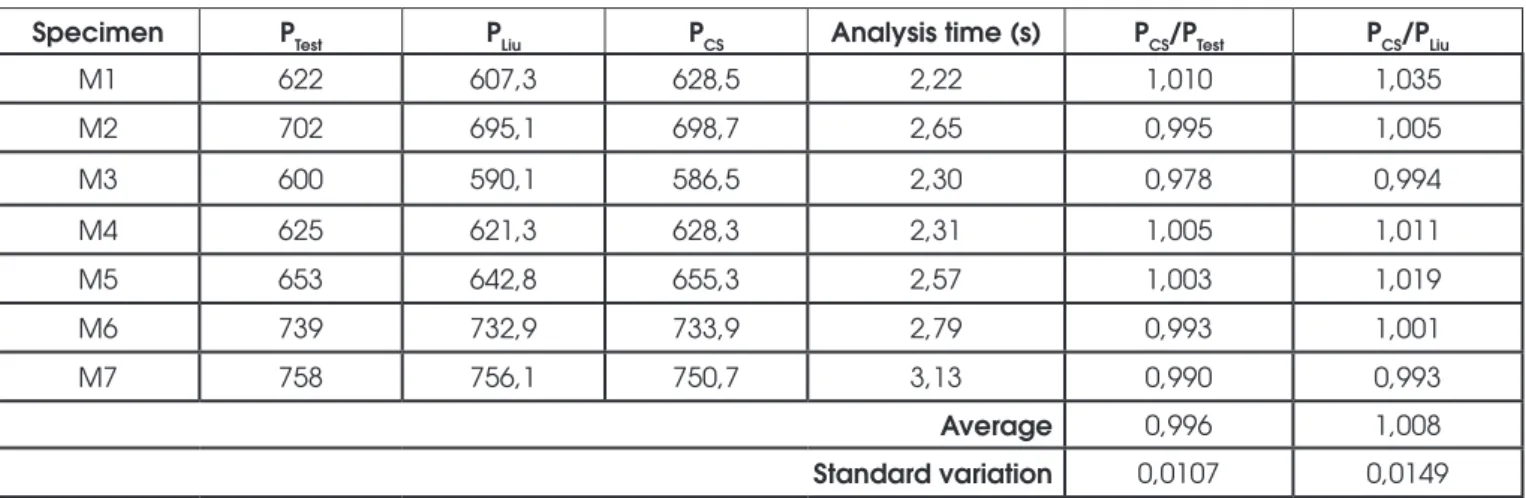
Table 2 presents the critical loads attained in each of the simula-tions. The table also compares the values of the loads obtained
here with those found in the literature. Compared to the experi-mental results, the low average diference, PTest (0.4%), points to
the reliability of numerical analyses presented for circular compos-ite columns under axial force and bending moment. It is noteworthy that little diference is found when compared with the numerical results obtained by Liu et al. [12], PLiu. Note that in Table 2, the value of the load limit obtained with the CS-ASA is denoted as PCS. Another point to be highlighted in the formulation proposed in this paper, also shown in Table 2, is the low program runtime for the calculation of each of the prototypes. The time shown in the table relects the time from the moment when the analysis began to the moment when the load limit point had been reached.
6.3 Rectangular concrete-illed tube made
of high-strength materials
Liu et al. [23] conducted experimental tests on 21 rectangular
concrete-illed tubes specimens. The materials used were high-strength — steel with an fy equal to 550 MPa. The cylindrical
M1 622 607,3 628,5 2,22 1,010 1,035
M2 702 695,1 698,7 2,65 0,995 1,005
M3 600 590,1 586,5 2,30 0,978 0,994
M4 625 621,3 628,3 2,31 1,005 1,011
M5 653 642,8 655,3 2,57 1,003 1,019
M6 739 732,9 733,9 2,79 0,993 1,001
M7 758 756,1 750,7 3,13 0,990 0,993
Average 0,996 1,008
Standard variation 0,0107 0,0149
Figure 11
compressive strength of the concrete varied between 70.8 and 82.1 MPa. Basically, the tests were carried out using short col-umns so as to enable the cross-sections to have maximum load carrying capacity. Moreover, to prevent the occurrence of bend-ing moments, the axial load on the structural element was ap -plied concentrically. As illustrated in Fig. 11, the columns were simply supported and discretized in the same way at the global level, using four elements and ive nodes, as at the local level, with 8 layers.
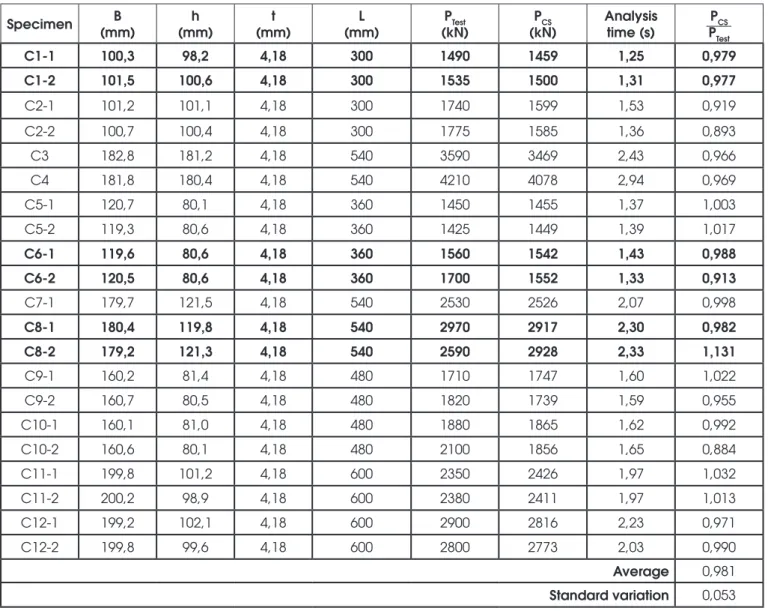
Table 3 presents the data of the cross-section and the results ob-tained with the formulation presented (PCS). The table also
com-pares the experimental results (Ptest) with those obtained by Liu et
al. [23]. The table shows a good approximation between the
nu-merical and experimental results. On average, the data extracted from the CS-ASA program varies from the data obtained in the laboratory by only 1.9%. Also noteworthy, shown by the standard variation, is how low the dispersion of results are compared to the calculated average. Such a pattern demonstrates the numerical
formulation’s reliability. The table also shows the program execu-tion times for each of the simulated specimens.
Regardless of considering the geometric nonlinearity, the critical load of the column is deined solely by the full yield curve. This occurs because the column is classiied as short, i.e., it has low slenderness. Another conditioning factor is the position of the load application in the section’s centroid, which makes the column be under the action of axial loading without bending moments. In other words, the limit load on the columns is equal to the point on the interaction curve where there is maximum compressive normal force and the bending moment is null.
Note that in some cases where two specimens were made of the same materials, the specimen with a smaller cross-section showed, in experimental terms, a load limit higher than that of the other element tested. This can be seen when comparing the C2-1 and C2-2 specimens. Theoretically, these values should be inverted, since the reduction of the cross-section directly implies a reduction in the bearing capacity of the structural element. In the
Table 3
Cross-section data and critical loads
Specimen B
(mm)
h (mm)
t (mm)
L (mm)
PTest (kN)
PCS (kN)
Analysis time (s)
PCS PTest
C1-1 100,3 98,2 4,18 300 1490 1459 1,25 0,979
C1-2 101,5 100,6 4,18 300 1535 1500 1,31 0,977
C2-1 101,2 101,1 4,18 300 1740 1599 1,53 0,919
C2-2 100,7 100,4 4,18 300 1775 1585 1,36 0,893
C3 182,8 181,2 4,18 540 3590 3469 2,43 0,966
C4 181,8 180,4 4,18 540 4210 4078 2,94 0,969
C5-1 120,7 80,1 4,18 360 1450 1455 1,37 1,003
C5-2 119,3 80,6 4,18 360 1425 1449 1,39 1,017
C6-1 119,6 80,6 4,18 360 1560 1542 1,43 0,988
C6-2 120,5 80,6 4,18 360 1700 1552 1,33 0,913
C7-1 179,7 121,5 4,18 540 2530 2526 2,07 0,998
C8-1 180,4 119,8 4,18 540 2970 2917 2,30 0,982
C8-2 179,2 121,3 4,18 540 2590 2928 2,33 1,131
C9-1 160,2 81,4 4,18 480 1710 1747 1,60 1,022
C9-2 160,7 80,5 4,18 480 1820 1739 1,59 0,955
C10-1 160,1 81,0 4,18 480 1880 1865 1,62 0,992
C10-2 160,6 80,1 4,18 480 2100 1856 1,65 0,884
C11-1 199,8 101,2 4,18 600 2350 2426 1,97 1,032
C11-2 200,2 98,9 4,18 600 2380 2411 1,97 1,013
C12-1 199,2 102,1 4,18 600 2900 2816 2,23 0,971
C12-2 199,8 99,6 4,18 600 2800 2773 2,03 0,990
Average 0,981
C6-1 and C6-2 columns, it can be seen that, in testing the slightly larger section (C6-2), it had a 9% higher load capacity. Finally, we highlight the results of the C8-1 and C8-2 columns. These columns of very similar sections and of the same materials demonstrated a 15% diference in bearing capacities. In such cited cases, one sees the greatest discrepancy confronted the experimental results of these columns with analyses via CS-ASA.
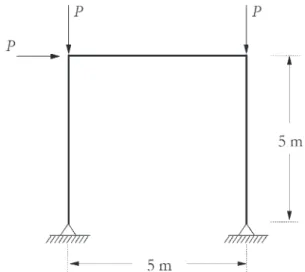
6.4 Simple frames
The simple frame shown in Fig. 12 was initially presented by Liew
et al. [17] in a study of steel structural systems with composite
beams. Comparing it with a steel system, the authors studied how including a concrete slab impacted the gain in stifness and load carrying capacity provided. Iu et al. [24] had already proposed fully
coating the columns with concrete. Later, Chiorean [11] validated his formulation when he compared his load-displacement curves with those found in the literature.
The structure in question is a simple frame with a height and width of 5 m, the columns having a W12 x 50 section and the beam a W12 x 27 section. As for the concrete slab, its height is 102 mm and its width 1219 mm. The columns are encased in the second
Figure 12
Figure 13
analysis, making for a square composite section with a base equal to 400 mm (Fig. 12b). Vertical incremental loads were applied to the tops of the columns, and a horizontal load to the top of the left column. The frame was considered to have no initial geometric imperfections. Each frame member was divided into four inite ele -ments, and the cross-sections discretized into 10 layers.
Two analyses described in the literature are made here: a struc-ture with steel columns and a composite beam (Strucstruc-ture 1) and a fully composite structural system (Structure 2). The displacement at the top of the right column is evaluated together with the incre-mental load to construct the equilibrium paths. Since in these two analyses composite beams were used without reinforcement in the negative moment region, it is proposed in this work to evaluate the gain of bearing capacity provided by including reinforcing bars in the slab. Structure 3 is then referred to as the frame with steel col-umns and an reinforced composite beam in the negative moment region while Structure 4 is referred to as the composite frame with an reinforced composite beam in the negative moment region. For the steel, a yield strength fy equal to 248.2 MPa is considered
along with a Young’s modulus taken as 200000 MPa. The con-crete compressive strength characteristic, fc, adopted is 16 MPa
and the secant modulus is calculated relating fc with strain eci taken
as -0.002. The actual strain was not allowed to exceed -0.0035, deined as ecu.
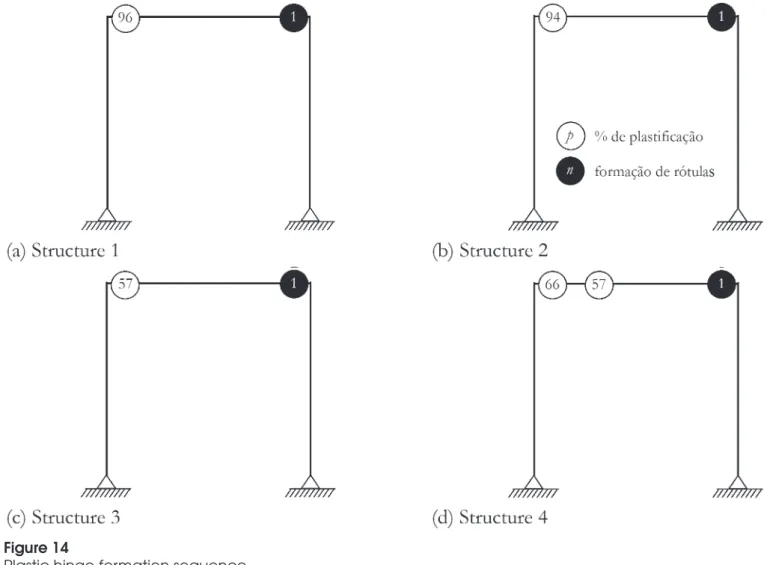
Figure 13 shows the load-displacement curves for the four cas-es dcas-escribed above. The runtimcas-es measured from the start of the analysis until the time when the load limit was reached for the structures 1, 2, 3, and 4 were the following: 0.64s, 0.66s, 0.65s, and 0.73s. In the equilibrium paths obtained through the analysis via the CS-ASA, one can see in both analyses, a al-most instant loss of stifness of the structural system near the incremental load P equal to 60 kN. This fact is related to the irst plastic hinge of the frame (Fig. 14) occurring in the beam near the junction with the right column. This portion concerns the efect of the negative moment. That is, the contribution of the concrete slab is practically null, since it has no longitudi-nal reinforcements. In this same igure it can be seen that only the beam has points in plastic and elastoplastic stages. Thus, it is concluded that encased I section in the columns does not signiicantly alter the bearing capacity of the structural system as a whole. The major contribution of filling the columns with concrete is amplifying these elements stiffness. The speed with which the plastification occurs is due to the constitutive relation adopted for the steel. With elastic-perfectly-plastic
Figure 14
behavior, the initial and full yield curves are very close, result-ing in the reduction of the portion of the stiffness degradation (elastoplastic stage).
When one considers the reinforcing bars with diameter equal to 8 mm (fyr = 400 MPa and Eb = 200 GPa) in the negative bending
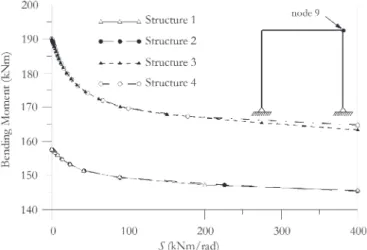
moment, it may be clearly noticed that there is a disappearance of the near instantaneous loss of stifness under load P equal to 60 kN. The reinforcing bars inserted in the slab amplify the resistant bending moment, increasing the elastoplastic stage of the cross-section. Thus, the stifness degradation is subtler if seen in the equilibrium path in Fig. 14. As a result, we see a gain of approxi-mately 7% in the structure’s load capacity (load limit P) as a whole. The percentage of plastiication is shown in the unilled circles. Figure 15 illustrates how, in relation to the bending moment, the stifness degradations of the pseudo-springs occur in Node 9 of the structure.
The plastiication starts when the ratio of moment x S ceases to be
parallel with the horizontal axis, that is, when the section reaches the initial yield moment. When the stifness S is zero, the full yield moment is attained. That is, the combination of internal forces lies on the full yield curve.
7. Conclusions
In this paper was presented a numerical formulation based on Re-ined Plastic Hinge Method ReRe-ined (RPHM) for advanced analysis of steel-concrete composite structures. In this context, was cou-pled to the CS-ASA program a general methodology to obtain the bearing capacity, the Strain Compatibility Method (SCM). The axial and lexural stifness were determined through homogenization of the cross-section.
In SCM, the Newton-Raphson Method is used to determine the moment-curvature relationship. Its generality allows that, through the presented constitutive relations, steel or reinforced concrete sections subjected to a combination of axial force and bending mo-ment, be also modeled. It was found in Section 6.1 that the use of the singularity of the stifness matrix as stopping criterion of the
construction of the moment-curvature relationship, adopted in this study, is consistent with strain domains used by Caldas [10]. In Figures 7 and 8 was seen that the consideration of the concrete tensile strength contribution added approximately 2% in the bear-ing capacity of composite sections under positive normal forces. In composite sections, there is a preponderant share of the steel sec-tion tensioned regions, since their behavior is treated as isotropic. Evaluation of composite elements considering the concentrated plasticity via RPHM also showed results consistent with the litera-ture. In Sections 6.2 and 6.3 were evaluated standard compos-ite elements under simple bending and compression, and in both cases the results were compared with data obtained in laboratory. In Tables 2 and 3 were highlighted, on average, good proximity between the numerical and experimental results. Furthermore, the low dispersion of the results from the average indicate the reliabil-ity of the analysis.
Figures 13a and 13b illustrate two simple frames behavior with the same geometry but diferent cross-sections for the columns. At irst only steel vertical elements (columns) were considered, then the columns were completely encased with concrete. It is noticed that there was no great increase in limit load, which is deined by the composite beam. An important fact to be noted is that in the litera-ture analyzes, the composite beam is not reinforced in the negative bending moment region. Thus, only the steel section works as a structural element. This fact associated with elastoplastic behavior used in this work, induce a loss of sharp system stifness (plastii-cation at the right end of the beam) when the load parameter is ap-proximately 60 kN. It was then proposed in this paper the reinforc-ing bars insertion in the composite beam in the negative bendreinforc-ing moment region. Thus, the reinforcing bars introduces an increase of bearing capacity in the critical section of the structural system, as illustrated in Fig. 14. This fact resulted in a 7% increase in the load limit of the structure and 17% in full yield bending moment of the beam in negative region, as illustrated in Fig. 15.
In addition, it should be noted the low execution time of the simula-tions carried out in Section 6 of this work. It was observed during the analysis that the formulation in question, in terms of runtime, showed a certain sensitivity for the initial load increment parameter. Very small values increase the runtime but improve the accuracy of the inal response. This observation can also be made with regard to local and global mesh. Nevertheless, the examples presented here, it was found that a low reining rate of such meshes showed satisfactory results with respect to data in the literature. It is note-worthy that in Example 6.2 a discretization slightly more reined was used than in the other problems mentioned in Section 6. This can be explained by the level of reining required for the modeling of circular sections, since the layers generated in the discretization of the cross-section are rectangular, as illustrated in Fig. 5. What has not been addressed in this work are the reinforced con-crete elements the overall structural context. In fact, the methodol-ogy presented in terms of an analysis of the structure as a whole, does not allow a good evaluation of this type of structure. When considering that a section has lexural stifness variation only when the internal forces reach the initial yield curve, it is assumed that every type of element initially presents a linear elastic behavior. As future stages of this research, we intend to eliminate this limitation
Figure 15
with the generalization of obtaining the axial and lexural stifness, which will be taken directly from moment-curvature relationships in the two nodal points of the inite element. Thus, the use of the tangent modulus to provide greater accuracy analyzes. The behav-ior of composite elements with partial interaction and composite frames with semi-rigid connections will also be studied. In addition, it intends to extend the formulations and simulations to dynamic analysis of composite structures.
8. Acknowledgment
The authors would like to thank CAPES, CNPq, Fapemig, and UFOP for their support during the preparation of this work. Special thanks go to prof. John White for the editorial review of this text.
9. References
[1] COMITE EUROPEEN DE NORMALISATION. Design of composite steel and concrete structures part I: general rules and rules for buildings. – EUROCODE 4, Brussels, Belgium, 2004.
[2] AMERICAN INSTITUTE OF STEEL CONSTRUCTION. Speciication for structural steel buildings, Chicago, USA, 2010.
[3] WENG, C.C., YEN, S.L. Comparisons of concrete-encased composite column strength provision of ACI code and AISC speciications. Engineering Structures, v.24, 2002; p.59-72. [4] CHAN, S.L., CHUI, P.P.T. Non-linear static and cyclic analy-sis of steel frames with semi-rigid connections, Oxford: Else-vier, 2000, 336 p.
[5] SILVA, A.R.D. Sistema computacional para análises avança-da estática e dinâmica de estruturas metálicas, Ouro Preto, 2009, Tese (doutorado) – Programa de Pós-graduação em Engenharia Civil, Universidade Federal de Ouro Preto, 322 p.
[6] FONG M., CHAN, S.L. Advanced analysis of steel-concrete composite beam-columns by reined plastic-hinge method. International Journal of Structural Stability and Dynamics, v.12, 2012.
[7] LEMES, Í.J.M. Análise avançada via RPHM de estruturas mistas de aço e concreto, Ouro Preto, 2009, Dissertação (mestrado) – Programa de Pós-graduação em Engenharia Civil, Universidade Federal de Ouro Preto, 101 p.
[8] CHEN, S., TENG, J.G., CHAN, S.L. Design of biaxially load-ed short composite columns of arbitrary section. Journal of Structural Engineering, v.127, n.6, 2001; p.678-685. [9] LIU, S.W., LIU, Y.P., CHAN, S.L. Advanced analysis of
hy-brid steel and concrete frames part 1: Cross-section analysis technique and second order analysis. Journal of Construc-tional Steel Research, v.70, 2012; p.326-336.
[10] CALDAS, R. B. Análise numérica de pilares mistos aço-con-creto, Ouro Preto, 2004, Dissertação (mestrado) – Programa de Pós-graduação em Engenharia Civil, Universidade Fed-eral de Ouro Preto, 200 p.
[11] CHIOREAN, C.G. A computer method for nonlinear inelas-tic analysis of 3d composite steel-concrete frame structures. Engineering Structures, v.57, 2013; p.125-152.
[12] LIU, S.W., LIU, Y.P., CHAN, S.L. Advanced analysis of hy-brid steel and concrete frames part 2: Reined plastic hinge and advanced analysis. Journal of Constructional Steel Re-search, v.70, 2012; p.337-349.
[13] CHAN, S.L, Liu, S.W., LIU, Y.P. Advanced analysis of hybrid frames structures by reined plastic hinge approach. In: Steel and Composite Structures – Proceedings of 4th International Conference, 2010.
[14] YANG, Y.B., KUO, S.B. Theory & Analysis of Nonlinear Framed Structures, Singapore: Prentice Hall, 1994, 569 p. [15] CHAN, S.L. Geometric and material nonlinear analysis
of beam-columns and frames using the minimum residual displacement method. International Journal for Numerical Methods in Engineering, v.26, 1988; p.2657-2669.
[16] GALVÃO, A.S. Formulações não lineares de EF para análise de sistemas estruturais metálicos reticulados planos, Ouro Preto, 2000, Dissertação (mestrado) – Programa de Pós-graduação em Engenharia Civil, Universidade Federal de Ouro Preto, 168 p.
[17] LIEW, J., CHEN, H., SHANMUGAM, N. Inelastic analysis of steel frames with composite beams. Journal of Structural En-gineering, v.127, 2001; p.194-202.
[18] BAZANT, Z.P., OH, B.H. Crack band theory for fracture of concrete. Materials and Structures, v.16, 1983; p.155-177. [19] BRATINA, S., SAJE, M., PLANINC, I. On materially and
geo-metrically non-linear analysis of reinforced concrete planar frames. International Journal of Solids and Structures, v.41, 2004; p.7181-7207.
[20] SFAKIANAKIS, M.G. Biaxial bending with axial force of re-inforced, composite and repaired concrete sections of arbi-trary shape by iber model and computer graphics. Advances in Engineering Software, v. 33, 2002, p.227-242.
[21] NEOGI, P., SEN, H., CHAPMAN, J. Concrete-illed tubular steel columns under eccentric loading. The Structural Engi-neer, v. 47, 1969, p.187-195.
[22] AMERICAN CONCRETE INSTITUTE. Building code re-quirements for reinforced concrete. – ACI 318, 1995. [23] LIU, D., GHO, W.M., YUAN, J. Ultimate capacity of
high-strength rectangular concrete-illed steel hollow section stub columns. Journal of Constructional Steel Research, v. 59, 2003, p.1499-1515.