ISSN 0104-6632 Printed in Brazil
www.abeq.org.br/bjche Vol. 32, No. 03, pp. 767 - 779, July - September, 2015
dx.doi.org/10.1590/0104-6632.20150323s00003449
Brazilian Journal
of Chemical
Engineering
HIGHLY-ACCURATE MODEL ORDER REDUCTION
TECHNIQUE ON A DISCRETE DOMAIN
L. D. Ribeiro, A. R. Secchi
*and E. C. Biscaia Jr.
Chemical Engineering Program, COPPE, Universidade Federal do Rio de Janeiro,
Av. Horácio Macedo 2030, Centro de Tecnologia, Bloco G, Sala G-115, CEP: 21941-914, Rio de Janeiro - RJ, Brazil. E-mail:[email protected]
(Submitted: April 14, 2014 ; Revised: October 12, 2014 ; Accepted: Novembr 30, 2014)
Abstract - In this work, we present a highly-accurate technique of model order reduction applied to staged
processes. The proposed method reduces the dimension of the original system based on null values of moment-weighted sums of heat and mass balance residuals on real stages. To compute these sums of weighted residuals, a discrete form of Gauss-Lobatto quadrature was developed, allowing a high degree of accuracy in these calculations. The locations where the residuals are cancelled vary with time and operating conditions, characterizing a desirable adaptive nature of this technique. Balances related to upstream and downstream devices (such as condenser, reboiler, and feed tray of a distillation column) are considered as boundary conditions of the corresponding difference-differential equations system. The chosen number of moments is the dimension of the reduced model being much lower than the dimension of the complete model and does not depend on the size of the original model. Scaling of the discrete independent variable related with the stages was crucial for the computational implementation of the proposed method, avoiding accumulation of round-off errors present even in low-degree polynomial approximations in the original discrete variable. Dynamical simulations of distillation columns were carried out to check the performance of the proposed model order reduction technique. The obtained results show the superiority of the proposed procedure in comparison with the orthogonal collocation method.
Keywords: Model order reduction; Discrete domain; Weighted residuals; Orthogonal collocation; Method of moments; Distillation column.
INTRODUCTION
Rigorous dynamic mathematical models of staged separation systems with mass and energy balances lead to a large set of differential-algebraic equations, making them impractical for real-time applications. The challenge to reduce the computational cost of such systems motivated the development of different model order reduction techniques, such as compart-mental models (España and Landau, 1978; Benallou et al., 1986; Musch and Steiner, 1993) and its variants aggregated modeling (Lévine and Rouchon, 1991; Linhart and Skogestad, 2009, 2010; Kamath et al., 2011) and time-scale separation (Kumar and Daoutidis,
2003) based on singular perturbation analysis, nonlin-ear wave propagation (Marquardt, 1986; Kienle, 2000), model linearization (Georgakis and Stoever, 1982), and orthogonal collocation.
subsequent application of the orthogonal collocation method in a continuous domain. Also in continuous domain, Kim et al. (2010) applied orthogonal collo-cation on finite elements using the temperature as independent variable and showed the advantage of this transformation for rigorous separation design. Cho and Joseph (1983) showed that it is possible to apply the orthogonal collocation method directly in the discrete domain by adequate selection of polyno-mials. Stewart et al. (1985) further showed that Hahn’s polynomials are the best choice for better results and more reliable reduced models. Following this approach, Pinto and Biscaia (1987) presented four different order reduction strategies dealing with the discontinuities that happen between the sections of staged separation systems, whereas Seferlis and Hrymak (1994) treated all discontinuous stages as discrete stages and applied order reduction for each section between these discrete stages using the or-thogonal collocation on finite elements technique with different polynomials for the vapor and liquid phases.
In this work we present a technique of model or-der reduction of staged separation systems based on null values of moment-weighted sums of heat and mass balance residuals on real stages, referred here as method of moments, for short. In order to com-pute these sums of weighted residuals, a discrete form of Gauss-Lobatto quadrature was developed, allowing a high degree of accuracy in these calcula-tions. Mass and energy balances related to upstream and downstream devices (such as condenser, reboiler, and feed tray of a distillation column) are considered as boundary conditions of the corresponding differ-ence-differential equations system, and by also de-fining residual functions for the boundary points, representing fictitious stages, we deal with the dis-continuities that may occur at these points using only one polynomial for each section. Using illustrative examples, we also show the adaptive nature of the proposed technique, where the locations of the null residuals of the model equations vary with time and the operating conditions. Scaling of the discrete inde-pendent variable related with the stages is also intro-duced in this work, which has been a drawback for applying discrete orthogonal collocation methods, avoiding accumulation of round-off errors present even in low-degree polynomial approximations in the original discrete variable.
In the next section we present the method of mo-ments in a general form to be applied to any staged process. Also in this section, a change in the inde-pendent variable was applied to increase the stability of the numerical procedure. Then, the methodology
is applied in detail to a simple absorber column in order to present all steps of the procedure and we also applied the method of moments to binary and ternary distillation columns to show the advantages of this approach when compared with the orthogonal collocation method.
ORDER REDUCTION TECHNIQUE
In order to introduce the proposed model order reduction technique, let us consider a generic section of an N-stage system described by the following difference-differential equations:
1 1
ˆ ( )
ˆ ˆ ˆ
[ ( )]
1,
[
2, ,
( )] [ ( )],
i
i i i
dx t
f x t g x t h x t
dt
i N
− +
= +
…
+
= (1)
with boundary conditions x tˆ ( )0 =p t( ) and xˆN+1( )t =q t( )
with known functions p(t) and q(t); f(⋅), g(⋅), and h(⋅) are functions resulting from the application of mass and/or energy conservation laws, and x tˆ ( )i repre-sents the system state variables, e.g., mole fraction or temperature of the i-th stage. Using the following scaled independent variable representing the stages of the system:
1 i
i s
N
−
= , i = 1, 2, …, N (2)
and the notation x s tˆ( , )i ≡x tˆi( ), then a polynomial
approximation of degree n + 1 in the state variables
ˆ ( )i
x t ,considering the internal points 0 ≤s(1) < s(2) < … < s(n) < 1 and the extreme points s(0) 1
N
= − at i = 0 and s(n+1)=1 at i = N + 1 as interpolation points,
can be written as:
1 1
( 1) ( )
0 0
ˆ( , ) ( , ) ( ) (ˆ , ) ( ) ( )
n n
n j
j j j
j j
x s t x s t s x s t s x t
+ +
+
= =
≈ =
∑
A =∑
A (3)where
1
0
( )
( )
( )
n
k j
j k k
k j
s s s
s s
+
= ≠
− =
−
∏
A are the Lagrange
interpo-lating polynomials and, for sake of notation,
( )
ˆ
( ) ( j, )
j
x t ≡x s t . Note that in the limiting case of n = N, the internal interpolating points are equal to the system stages, s( )i =si for i = 1, 2, …, N, and the
Highly-Accurate Model Order Reduction Technique on a Discrete Domain 769 For each interpolating point, i = 0, 1, 2, …, n + 1,
the following residual functions are defined:
[
]
( 1) ( ) ( 1) ( )
( 1) ( )
( )
( , ) ( 1 / , )
( ) ( 1 / , )
n i i n i
n i
i dx t
s t f x s N t
dt
g x t h x s N t
+ +
+
⎡ ⎤
ℜ = − ⎣ − ⎦
⎡ ⎤
− − ⎣ + ⎦
(4)
where the first-order negative and positive differ-ences are evaluated as:
1
( 1) ( ) ( )
0 1
, 0
( 1 / , ) ( 1 / ) ( )
( ) n
n i i
j j
j
n
i j j
j
f x s N t s N f x t
A f x t
+ + = + − = ⎡ − ⎤= − ⎡⎣ ⎤⎦ ⎣ ⎦ ⎡ ⎤ = ⎣ ⎦
∑
∑
A (5) 1( 1) ( ) ( )
0 1
, 0
( 1 / , ) ( 1 / ) ( )
( ) n
n i i
j j
j
n
i j j
j
h x s N t s N h x t
A h x t + + = + + = ⎡ + ⎤= + ⎡⎣ ⎤⎦ ⎣ ⎦ ⎡ ⎤ = ⎣ ⎦
∑
∑
A (6)where , ( ( ) 1/ )
i
i j j
A− =A s − N and , ( ( ) 1/ )
i
i j j
A+ =A s + N
are the (n + 2) × (n + 2) first-order difference matrices. Note that in Eq. (4) the residual function is also defined for the boundary points, representing fictitious stages to deal with discontinuities that may occur at the boundaries, which are used by the method of moments and discussed later.
In the classical method of discrete orthogonal collocation, xi(t) are found such that the residuals at
the internal points, i = 1, 2, …, n, are canceled (col-location points):
[
]
1 ( 1) ( )
, 0 1 , 0 ( )
( , ) 0 ( )
( ) ( )
n
n i i
i j j
j
n
i i j j
j dx t
s t A f x t
dt
g x t A h x t
+ + − = + + = ⎡ ⎤
ℜ = = − ⎣ ⎦
⎡ ⎤
− − ⎣ ⎦
∑
∑
(7)
and the boundary conditions x0(t) = p(t) and xn+1(t) = q(t) complete the system of n + 2 equations.
In order to avoid the discontinuities that may oc-cur at the boundaries, an approach similar to Seferlis and Hrymak (1994) can be applied in the classical method by adding two extra collocation points at the extreme stages of the section of the separation sys-tem, at s(0)=0 and at s(n 1) 1 1
N
+ = − , corresponding
to the stages 1 and N, respectively, and for these points the residuals are defined as:
[
]
[
]
( 1) (0) 0
1 1
0 0,
0
( )
( , ) 0 ( )
( ) ( ) n n j j j dx t
s t f x t
dt
g x t A h x t
+
−
+ +
=
ℜ = = −
⎡ ⎤
− −
∑
⎣ ⎦(8)
[
] [
]
1
( 1) ( 1) 1
1, 0
1 2
( )
( , ) 0 ( )
( ) ( )
n
n n n
n j j
j
n n
dx t
s t A f x t
dt
g x t h x t
+ + + + − + = + + ⎡ ⎤
ℜ = = − ⎣ ⎦
− −
∑
(9)
where the boundary conditions are x-1(t) = p(t) and xn+2(t) = q(t). However, this modified approach has
the disadvantage of increasing the size of the system by adding two extra collocation points, or reducing the degree of the orthogonal polynomial by two if keeping the same size of the classical method.
In the method of moments, xi(t) are found such
that sum of the moment-weighted residuals is can-celed for the first n moments:
( )
1( )
( 1) ( 1)
1
1,
( ) , 0,
2, , N k n n i i k i t k s s n t − + + = =
ℜ = =
…
ℜ
∑
(10)
These sums of weighted residuals are evaluated using a discrete form of Gauss-Lobatto quadrature:
( )
(
)
(
)
1 1
( 1) ( ) ( 1) ( )
0 1
( 1) ( ) ,
0
1, 2 ( ) 0 , , , , n k
n j n j
j k j n n j k j j
t s s t
k n
M s t
+ − + + = + + = ℜ =
= ω ℜ
= ℜ =
…
∑
∑
(11)where
( )
( ) 1 ,k j
k j j
M = ω s − are the entries of the n× (n + 2) matrix M, and ωj and s(j) are the weights and
abscis-sas of the Gauss-Lobatto quadrature, respectively. This quadrature is exact for polynomial functions up to degree 2 n + 1, which is always the case for linear systems because ℜ(n+1)
( )
s t, is a polynomial of degree n+1.As the n equations in Eq. (11) are linear in the co-efficients of matrix M, they can be rewritten in the following form:
( )
(
)
(
)
( 1) ( ) ( 1) (0)
,0 ,1
( 1) ( 1) 1, 2,
,
, 0, ,
,
n i n
i i
n n
s t
i n
V s t V
s t
+ +
+ +
ℜ + ℜ +
= …
ℜ =
where
[
0 1]
1[
0 1]
−=
V V M b b , bi,0 = Mi,0 are the
entries of the first column of matrix M,bi,1 = Mi,n+1
are the entries of the last column of matrix M, and
M is the n×n square matrix by removing the first and the last columns of matrix M. By substituting Eq. (4) in Eq. (12), the following expression can be derived:
[
]
1 , 0
1 , 0
( )
( ) ( )
() , 1, 2, ,
n i
i j j i
j
n
i j j
j
i n
dX t
B f x t G x t
dt
B h x t
+ −
=
+ +
=
⎡ ⎤
= ⎣ ⎦+
⎡ ⎤
+ ⎣ ⎦ = …
∑
∑
(13)
where X ti( )=x ti( )+Vi,0x t0( )+V xi,1 n+1( )t ,
, , ,0 0, ,1 1,
i j i j i j i n j
B− =A− +V A− +V A−+ ,
, , ,0 0, ,1 1,
i j i j i j i n j
B+ =A+ +V A+ +V A++ ,
and
[
i( )] [
i( )]
i,0[
0( )]
i,1[
n 1( )]
G x t =g x t +V g x t +V g x+ t .
The boundary conditions x0(t) = p(t) and xn+1(t) = q(t) complete the system of n + 2 equations. Note that the orthogonal collocation technique is repro-duced by setting Vi0 = 0 and Vi1 = 0. In both cases, s(1), s(2), …, s(n) are the roots of the Hahn’s polyno-mial of degree n.
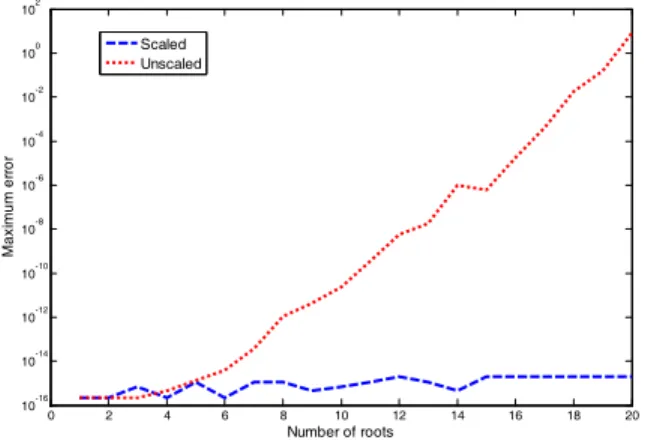
Figure 1 shows that the roots of the Hahn’s poly-nomial are obtained with high accuracy for any de-gree when using the proposed scaled discrete inde-pendent variable, whereas high accumulation of round-off errors is observed in the original discrete variable, even for low-degree polynomials.
0 2 4 6 8 10 12 14 16 18 20 10-16
10-14 10-12 10-10 10-8 10-6 10
-4
10-2 100 10
2
Number of roots
M
a
x
imu
m e
rr
o
r
Scaled Unscaled
Figure 1: Maximum deviation of the roots of the
Hahn’s polynomial from the exact values of integer roots plus the maximum value of the polynomial evaluation at these roots for the scaled and unscaled procedures.
It must be emphasized that overall heat and mass balances are fulfilled in the method of moments, which are given by the zero-order moment. More-over, in the orthogonal collocation method the points where the residuals are canceled are fixed (s(1), s(2), …, s(n)), and in the method of moments moving col-location points are obtained, characterizing a desir-able adaptive nature of this technique.
RESULTS AND DISCUSSION
Four separation processes were chosen to illus-trate the methodology and to show its advantages when compared with the classical orthogonal collo-cation method: (1) a simple absorber column, to present all steps of the procedure; (2) a high-purity propane-propylene distillation column with large num-ber of stages, to show the high reduction of the model order; (3) a benzene-toluene-xylene distillation col-umn, to apply the method to a multicomponent sys-tem and to show its high accuracy close to the bounda-ries of the distillation sections; and (4) an ethanol-propanol-water distillation column, to show the performance of the method for non-ideal mixtures.
All differential-algebraic systems presented in this section were solved by the solver DASSLC (Secchi, 2009) with relative accuracy of 10-6 and absolute accuracy of 10-8, implemented in the dy-namic simulator EMSO (Soares and Secchi, 2003).
Absorber Column
This simple hypothetical example of an absorber column demonstrates the application of the method of moments for model order reduction of a staged separation system described by the following differ-ence-differential equations:
[
]
1 1
ˆ ( )
ˆ ( ) ˆ ˆ ˆ
1, 2
( ) ( ) ( ),
, , i
i i i i
dx t
x t x t y t y t
t
i N
d = β − − β + +
= …
+
(14)
and thermodynamic equilibrium:
ˆ ( )
ˆ( ) [ ( )]ˆ ,
ˆ 1
0, 1, 2,
( )
,
( )
1 1 i
i eq i
i x t
y t y
x t
i N
x t α
= =
+ α
= … +
−
(15)
with the boundary conditions:
0
ˆ ( ) feed( )
x t =x t (16)
1
ˆN ( ) feed( )
Highly-Accurate Model Order Reduction Technique on a Discrete Domain 771 where α (relative volatility) and β (liquid/gas molar
flow ratio) are model parameters, and t is the dimen-sionless time (actual time multiplied by the ratio of the gas molar flow rate and molar holdup). Writing Eq. (14) in the form of Eq. (1) results in
1 1
ˆ ˆ
[ i ( )] i ( )
f x− t = βx− t , g x t[ ( )]ˆi = −βx tˆi( )−yeq[ ( )]x tˆi , and
1 1
ˆ ˆ
[ i ( )] eq[ i ( )]
h x+ t =y x+ t . Thus, the reduced model by the method of moments, given by Eq. (13), is written as:
[
]
1 , 0
1 , 0
( )
( ) ( ) (
1, , ,
)
( ) n
i
i j j i i
j
n
i j j j dX t
i
B x t X t Y t
dt
B y t n
+ −
=
+ +
=
= β − β +
= …
+
∑
∑
(18)
where
,0 0 ,1 1
( ) ( ) ( ) ( )
i i i i n
X t =x t +V x t +V x+ t ,
,0 0 ,1 1
( ) ( ) ( ) ( )
i i i i n
Y t =y t +V y t +V y + t , and
( ) [ ( )]
i eq i
y t =y x t .
The reduced model by the orthogonal collocation method (OC), given by Eq. (7), is written as:
[
]
1 , 0
1 , 0
( )
( ) ( ) ( )
( ), 1, , n
i
i j j i i
j
n
i j j j dx t
A x t x t y t
d
i
A y t n
t +
−
=
+ +
=
= β − β +
=
+ …
∑
∑
(19)
In both cases, x t0( )=xfeed( )t and yn+1( )t =yfeed( )t .
Using a set of arbitrary specifications given in Ta-ble 1, the corresponding results are shown in Figure 2, where both reduced order techniques present good agreement with the complete model for a reduction of 83%. The method of moments shows slightly bet-ter results in the regions near to the column top and bottom, with less oscillatory behavior, as show in Table 2 for the first two stages at the top and bottom of the column. These characteristics are better ex-plored in the next and more realistic examples.
Table 1: Absorber column specifications.
Number of internal points, n 5
Number of stages, N 30
β 1.0
α 0.75
xfeed 0.0
yfeed 1.0
0.0 0.1 0.2 0.3 0.4 0.5 0.6 0.7 0.8 0.9 1 .0
0 5 1 0 1 5 20 25 30 35
x
Stage
Complete
Moments
OC
Figure 2: Steady-state profiles for the complete
model, method of moments, and orthogonal colloca-tion of the absorber column.
Table 2: Absolute errors near the bottom and top of the absorber column.
Absolute Error Moments OC
stage 1 0.0023 0.0118
stage 2 0.0017 0.0122
stage 29 0.0019 0.0084
stage 30 0.0006 0.0075
Distillation Column – Propane and Propylene
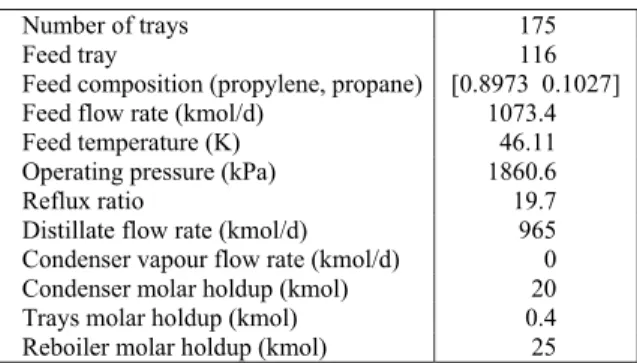
In order to compare the method of moments with the orthogonal collocation method, a distillation column to separate propane and propylene was used, as described in Seferlis and Hrymak (1994), with the specifications given in Table 3. The main characteris-tic of this example is the large number of stages, which is appropriate to show the high-degree of re-duction that can be achieved by these methods.
Table 3: Distillation column specifications for the
propylene−propane system.
Number of trays 175
Feed tray 116
Feed composition (propylene, propane) [0.8973 0.1027]
Feed flow rate (kmol/d) 1073.4
Feed temperature (K) 46.11
Operating pressure (kPa) 1860.6
Reflux ratio 19.7
Distillate flow rate (kmol/d) 965
Condenser vapour flow rate (kmol/d) 0
Condenser molar holdup (kmol) 20
Trays molar holdup (kmol) 0.4
Reboiler molar holdup (kmol) 25
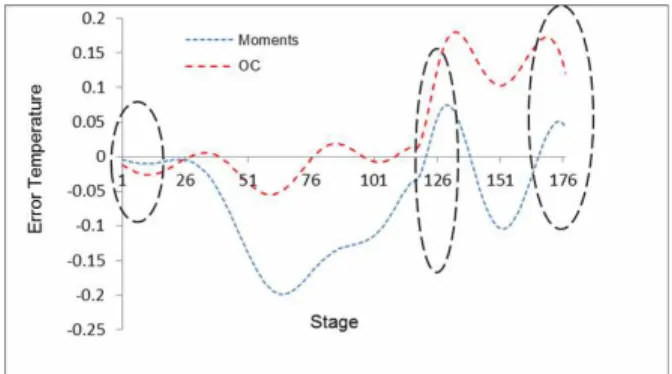
re-duction of 95%. In Figures 3 to 6, the steady-state profiles of liquid mole fraction, temperature and errors between the complete model and the reduced models using the method of moments and the or-thogonal collocation method are presented, respec-tively, where the superiority of the method of mo-ments in comparison with the orthogonal collocation method can be observed for the downstream vari-ables, mainly at the bottom of the column. These results are better visualized in Table 4, where the absolute square errors relative to the complete model are given for (1) sum of these errors over all stages, (2) maximum error, (3) condenser error, (4) reboiler error, and (5) feed tray. The errors of the orthogonal collocation method at the bottom and top stages are about three times larger than the method of moments for both composition and temperature, which is an important advantage for control applications, such as the dual composition control of a high-purity distilla-tion column.
0.0 0.1 0.2 0.3 0.4 0.5 0.6 0.7 0.8 0.9 1 .0
0 20 40 60 80 1 00 1 20 1 40 1 60 1 80
Li
quid
co
m
p
o
sit
io
n
Stage
complete propylene complete propane Moments 5 x 3 propylene Moments 5 x 3 propane OC 5 x 3 propylene OC 5 x 3 propane
Figure 3: Steady-state composition profiles for the
complete model, method of moments, and orthogo-nal collocation of the propane-propylene column.
Figure 4: Steady-state composition error profiles for
the method of moments and the orthogonal colloca-tion of the propane-propylene column, highlighting the better accuracy of the moments close to the boundaries.
Table 4: Absolute square errors relative to the complete model for the liquid composition and temperature in the propane-propylene column: (Sum) sum of these errors over all stages, (Max) maximum error, (Top) condenser error, (Bottom) reboiler error, and (Feed) feed tray error.
mole fraction temperature Errors Moments OC Moments OC
Sum 2.92937 3.46050 12.172 14.787
Max 0.02358 0.03273 0.202 0.283
Top 0.00055 0.00155 0.004 0.012
Bottom 0.00487 0.01379 0.043 0.122
Feed 0.00590 0.01721 0.025 0.028
31 8 31 9 320 321 322 323 324 325 326 327
0 20 40 60 80 1 00 1 20 1 40 1 60 1 80
Te
m
p
e
ra
tu
re
(K
)
Stage
complete
Moments 5 x 3 OC 5 x 3
Figure 5: Steady-state temperature profiles for the
complete model, method of moments, and orthogo-nal collocation of the propane-propylene column.
Figure 6: Steady-state temperature error profiles for
the method of moments and the orthogonal collocation of the propane-propylene column, highlighting the bet-ter accuracy of the moments close to the boundaries.
Highly-Accurate Model Order Reduction Technique on a Discrete Domain 773
318.551 318.552 318.553 318.554 318.555 318.556 318.557 318.558 318.559
0.9979 0.9980 0.9981 0.9982 0.9983 0.9984 0.9985 0.9986 0.9987 0.9988
0 1 2 3 4 5
T
e
mpera
ture (
K
)
Pr
opy
le
ne distil
la
te
com
posi
ti
o
n
Time (h) Complete
Moments
complete
moments
Figure 7: Distillate temperature and composition
re-sponse due to a +12% step change in the reflux ratio at 0.4 h for the complete and reduced models of the propane-propylene column.
The adaptive nature of the method of moments is demonstrated by showing the moving collocation points, i.e., the points where the residuals are null, compared with the fixed points of the orthogonal collocation method. In Figures 8 and 9, the residual function of the propylene mass balance in the rectify-ing section, at three different time points, is depicted for the method of moments and orthogonal colloca-tion methods, respectively.
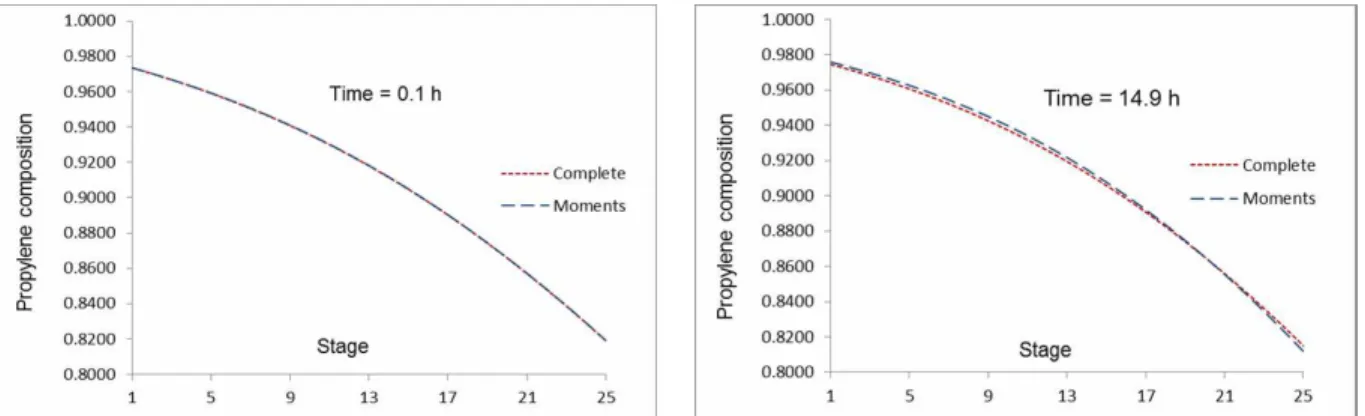
Figures 10 and 11 present the propylene composi-tion profiles and the distribucomposi-tion of errors calculated by the difference between the composition from the method of moments and the composition from the
complete model at different times. These results were generated with 88% reduction in the model order by using 3 internal points in the rectifying sec-tion and 3 points in the stripping secsec-tion, using the data of Table 3, except for the number of trays that was set to 49 and the feed tray location that was set to 25, and applying the same step change as de-scribed in the previous paragraph. A smaller column was used in this example to have a better approxima-tion of both reduced models, when compared with the complete model, and to focus the analysis on the location of the collocation points. The three time points were chosen to be located near to the initial and final steady-states (t = 0.1 h and t = 14.9 h) and after the step change (t = 0.4 h). The movement of the collocation points in the method of moments during the transient can be observed in Figure 8 after the step change in the reflux ratio, and the return of these points close to the location of the initial steady-state when the column reached the new steady-steady-state. This behaviour may be explained by the step re-sponse of the propylene composition, Figure 12, which presents an overshoot after the step change, and then moves back to a steady-state near to the initial condi-tion. Figure 9 shows the fixed collocation points of the orthogonal collocation method, which does not present the desired adaptability to changes in the oper-ating conditions that may cause significant changes in the profile shape, requiring the relocation of the collocation points to maintain the approximation accuracy. In Table 5, the exact locations of the collo-cation points are given as function of the time.
‐0.02
‐0.01 5
‐0.01
‐0.005 0 0.005 0.01 0.01 5 0.02 0.025 0.03
1 5 9 1 3 1 7 21 25
R
es
idua
l of
por
pyl
ene
m
as
s
bal
ance
Stage
Moments Method
time = 0.1 h time = 14.9 h time = 0.4 h
‐0.02
‐0.01 5
‐0.01
‐0.005 0 0.005 0.01 0.01 5 0.02 0.025 0.03
1 5 9 1 3 1 7 21 25
R
es
id
u
a
l of
pr
o
p
y
len
e
m
a
ss
ba
la
nc
e
Stage
OC Method
time = 0.1 h time = 14.9 h time = 0.4 h
Figure 8: Residual function of the propylene
mass balance in the rectifying section, at three different time points, for the method of moments, showing the change of the location where the residuals are null.
Figure 9: Residual function of the propylene
Figure 10: Propylene composition in the rectifying section for the complete and moments models at times 0.1 h and 14.9 h.
0 1 2 3 4 5 6 7 8 9 10 11 12 13 14 15 0.973
0.9735 0.974 0.9745 0.975 0.9755
Time (h)
P
ro
p
y
len
e d
is
ti
lla
te
co
m
p
o
sitio
n
Moments - 3 x 3 (88% of reduction) Complete - 51 stages
0 1 2 3 4 5 6 7 8 9 10 11 12 13 14 15 0.973
0.9735 0.974 0.9745 0.975 0.9755
Time (h)
P
ro
p
y
len
e d
is
ti
lla
te
co
m
p
o
sitio
n
Moments - 3 x 3 (88% of reduction) Complete - 51 stages
Figure 11: Propylene composition error of the
method of moments in the rectifying section at times 0.1 h and 14.9 h.
Figure 12: Propylene composition response due
to a +12% step change in the reflux ratio at 0.4 h for the method of moments for the column with 51 stages.
Table 5: Location of the collocation points as a func-tion of the time.
Moments
time root 1 root 2 root 3
0.1 4.233 13.75 22.60 0.4 6.556 15.65 23.32 0.6 3.069 8.867 17.63 0.8 5.750 15.33 23.11 1.0 4.783 14.47 22.96 1.6 4.350 13.30 22.88 2.0 4.227 13.42 22.55 14.9 4.222 13.67 22.98
OC
time root 1 root 2 root 3
all 5.457 13.83 21.71
Distillation Column – Benzene, Toluene and o-Xylene
In order to show that these methods of reduced order are not limited to binary systems, the third example is a distillation column to separate a ternary mixture of benzene, toluene and o-xylene (BTX) as
applied by Pinto and Biscaia (1987) and Kamath et al. (2010), with the specifications given in Table 6. The Peng-Robinson equation of state was used in the vapor phase and the UNIFAC model was used in the liquid phase to evaluate the thermodynamic properties.
Table 6: Distillation column specifications for the
benzene−toluene−o-xylene system.
Number of trays 20
Feed tray 10
Feed composition (benzene, toluene, o-xylene)
[0.15 0.25 0.60]
Feed flow rate (kmol/d) 100
Feed temperature (K) 410
Operating pressure (kPa) 200
Reflux ratio 5
Distillate flow rate (kmol/d) 50
Highly-Accurate Model Order Reduction Technique on a Discrete Domain 775 have been successful to reproduce the complete model
using 4 internal points in each section. However, when the main focus is to obtain the highest possible reduction with good accuracy to reproduce the con-ditions at the top and bottom of the column, as in the case of control strategies of a distillation column, the method of moments has great advantage as shown in the results for only two internal points in each section.
Figure 13: Steady-state benzene composition and
temperature profiles for the method of moments for different order reductions.
In Figure 14 to 16, the steady-state profiles of liq-uid mole fraction of benzene, temperature and errors between the complete model and the reduced models using the method of moments and the orthogonal collocation method are presented, respectively. In the reduced models, 2 internal points were used in both the rectifying and stripping sections, i.e., a reduction of 80%. In this example, the superiority of the method of moments is more evident. These results are also visualized in Table 7, with the same defini-tions used in the previous example.
Figure 14: Steady-state benzene composition and
temperature profiles for the complete model, method of moments, and orthogonal collocation of the BTX column.
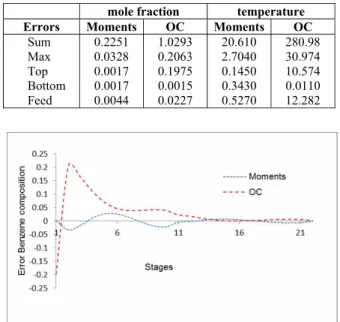
Table 7: Absolute square errors relative to the complete model for the liquid molar fraction of benzene and the temperature in the BTX column: (Sum) sum of these errors over all stages, (Max) maximum error, (Top) condenser error, (Bottom) reboiler error, and (Feed) feed tray error.
mole fraction temperature Errors Moments OC Moments OC
Sum 0.2251 1.0293 20.610 280.98
Max 0.0328 0.2063 2.7040 30.974
Top 0.0017 0.1975 0.1450 10.574
Bottom 0.0017 0.0015 0.3430 0.0110
Feed 0.0044 0.0227 0.5270 12.282
Figure 15: Steady-state benzene composition error
profiles for the method of moments and the orthogo-nal collocation of the BTX column.
Figure 16: Steady-state temperature error profiles
for the method of moments and the orthogonal collo-cation of the BTX column.
The errors of the orthogonal collocation method at the feed tray are about five times larger than the method of moments and at the top of the column are about two orders of magnitude larger than the method of moments for both composition and tem-perature, which is an important advantage of the method of moments for control and other real time applications. The lower sum of the absolute square errors (Sum) and maximum absolute square errors (Max) of the method of moments also indicate the overall high performance of this method compared with the orthogonal collocation method. It only pre-sents a slightly higher error at the bottom of the col-umn for the composition and a more significant error in the feed tray temperature, but representing less than 0.08% of the bottom temperature.
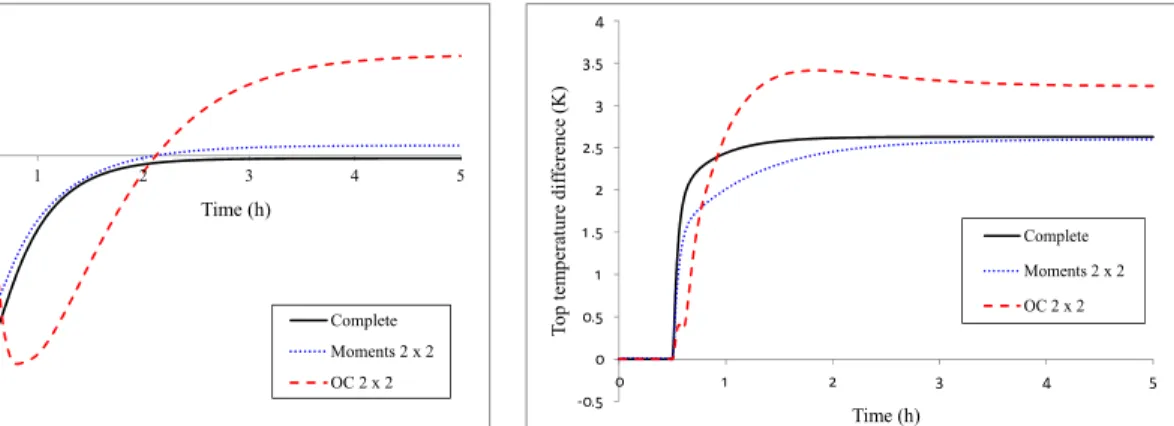
To illustrate the dynamic behavior, in this case a step function was applied in the reflux ratio at 0.5 h changing from 5 to 10, starting the simulation at the steady-state. In Figures 17 and 18, the dynamic be-havior of the benzene distillate composition and top temperature for the complete and reduced models are presented. The larger bias presented by the orthogo-nal collocation method is a consequence of the poor steady-state approximation shown in Figures 14 to 16.
In order to compare only the dynamic response, Figures 19 and 20 present the same results in terms of deviation variables from the initial steady-state. The good agreement of the method of moments with the complete model in terms of gain and dynamic response can be observed.
0.25 0.3 0.35 0.4 0.45 0.5 0.55
0 1 2 3 4 5
T
op be
nz
en
e
co
m
p
osit
ion
Time (h)
Complete Moments 2 x 2 OC 2 x 2
386 388 390 392 394 396 398 400 402 404
0 1 2 3 4 5
T
op te
m
p
er
at
ure
(
K
)
Time (h)
Complete Moments 2 x 2 OC 2 x 2
Figure 17: Distillate composition response due to
a +100% step change in the reflux ratio at 0.5 h for the complete and reduced models of the BTX column.
Figure 18: Top temperature response due to a
+100% step change in the reflux ratio at 0.5 h for the complete and reduced models of the BTX column.
-0.02 -0.015 -0.01 -0.005 0 0.005 0.01
0 1 2 3 4 5
T
op
benz
ene com
posit
ion d
if
ferenc
e
Time (h)
Complete Moments 2 x 2 OC 2 x 2
‐0.5 0 0.5 1 1 .5 2 2.5 3 3.5 4
0 1 2 3 4 5
T
o
p
tem
p
er
at
ur
e dif
fer
enc
e
(K
)
Time (h)
Complete Moments 2 x 2 OC 2 x 2
Figure 19: Distillate composition difference
re-sponse due to a +100% step change in the reflux ratio at 0.5 h for the complete and reduced models of the BTX column.
Figure 20: Top temperature difference response
Highly-Accurate Model Order Reduction Technique on a Discrete Domain 777
Distillation Column – Ethanol, n-Propanol and Water
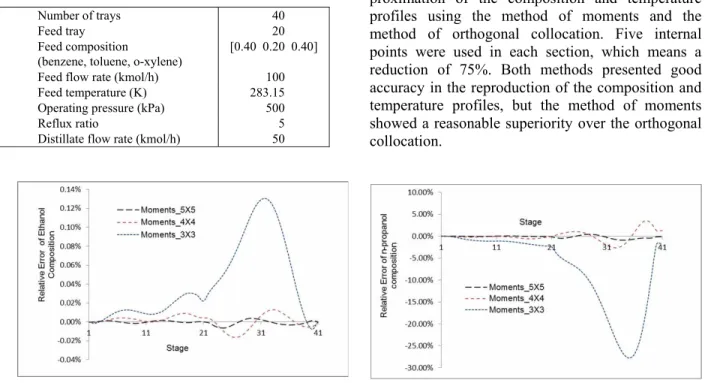
The mixture of ethanol, n-propanol and water, with the specifications given in Table 8, presented in this section was simulated in order to demonstrate the strength of method of moments in representing non-ideal systems. The Peng-Robinson equation of state was used in the vapor phase and the UNIFAC model was used in the liquid phase to evaluate the thermodynamic properties.
Table 8: Distillation column specifications for the
ethanol−n-propanol−water system.
Number of trays 40
Feed tray 20
Feed composition
(benzene, toluene, o-xylene)
[0.40 0.20 0.40]
Feed flow rate (kmol/h) 100
Feed temperature (K) 283.15
Operating pressure (kPa) 500
Reflux ratio 5
Distillate flow rate (kmol/h) 50
Figures 21 to 23 illustrate the behavior of the rela-tive errors for each component and the temperature for different order reductions. Equation (20) shows the criterion used to find the number of necessary collocation points. This relative deviation was calcu-lated between the variables of the complete and re-duced model. The maximum acceptable deviation was set to 5%.
Complete Moments Complete
X
X
5%
X
∞−
≤
(20)
Figures 24 to 27 illustrate the results of the ap-proximation of the composition and temperature profiles using the method of moments and the method of orthogonal collocation. Five internal points were used in each section, which means a reduction of 75%. Both methods presented good accuracy in the reproduction of the composition and temperature profiles, but the method of moments showed a reasonable superiority over the orthogonal collocation.
Figure 21: Steady-state relative error of ethanol
composition for the method of moments for different order reductions.
Figure 22: Steady-state relative error of
n-propanol composition for the method of mo-ments for different order reductions.
Figure 23: Steady-state relative error of temperature for the method of moments for different order
Etanol composition
Water composition
n-propanol composition Etanol composition
Water composition
n-propanol composition
Figure 24: Steady-state composition profiles for the
complete model, method of moments, and orthogo-nal collocation of the mixture ethanol, n-propanol and water.
Figure 25: Steady-state ethanol composition
error profiles for the method of moments and the orthogonal collocation of the mixture etha-nol, n-propanol and water.
Figure 26: Steady-state temperature profiles for the
complete model, method of moments, and orthogo-nal collocation of the mixture ethanol, n-propanol and water.
Figure 27: Steady-state temperature error
pro-files for the method of moments and the or-thogonal collocation of the mixture ethanol, n-propanol and water.
CONCLUSIONS
The proposed technique of model order reduction of staged separation systems based on the sum of moment-weighted residuals is shown to be superior to the orthogonal collocation method on a discrete domain, allowing a significant reduction in the model order with good quality. Global heat and mass bal-ances are fulfilled in this new method. Moreover, in the orthogonal collocation method the points where the residuals are canceled are fixed, and in the new method moving collocation points are obtained, char-acterizing a desirable adaptive nature of this tech-nique. The scaling of the discrete independent vari-able was crucial for the accuracy of the roots of Hahn’s polynomials, avoiding accumulation of round-off errors present even in low-degree polynomial ap-proximations in the original discrete variable. Steady-state and dynamical simulation results of distillation columns suggest the technique can be applied for optimization and control purposes.
ACKNOWLEDGEMENTS
We thank CNPq for the financial support.
REFERENCES
Benallou, A., Seborg, D. E. and Mellichamp, D. A., Dynamic compartmental models for separation processes. AIChE J., 32, 1067-1078 (1986). Cho, Y. S. and Joseph, B., Reduced-order
steady-state and dynamic models for separation proc-esses. AIChE J., 29(2), 261-276 (1983).
España, A. and Landau, L. D., Reduced order bilin-ear models for distillation columns. Automatica, 14, 345-355 (1978).
Finlayson, B. A., The Method of Weighted Residuals and Variational Principles. Academic Press (1972). Georgakis, C. and Stoever, M. A., Time domain order
Highly-Accurate Model Order Reduction Technique on a Discrete Domain 779 37(5), 687-697 (1982).
Kamath, R. S., Grossmann, I. E. and Biegler, L. T., Aggregate models based on improved group meth-ods for simulation and optimization of distillation systems. Comp. & Chem. Engng., 34, 1312-1319 (2010).
Kienle, A., Low-order dynamic models for ideal multi-component distillation processes using nonlinear wave propagation theory. Chem. Engng. Sci., 55, 1817-1828 (2000).
Kim, S., Ruiz, G. and Linninger, A. A., Rigorous separation design. 1. Multicomponent mixtures, nonideal mixtures, and prefractionating separation design. 1. Multicomponent mixtures, nonideal mix-tures, and prefractionating column networks. In-dustrial & Engineering Chemistry Reasearch, 49(14), 6499-6513 (2010).
Kumar, A. and Daoutidis, P., Nonlinear model reduc-tion and control for high-purity distillareduc-tion col-umns. Ind. Eng. Chem. Res., 42, 4495-4505 (2003). Lemos, E. M., Secchi, A. R. and Biscaia Jr., E. C., Implementation of Galerkin and moments methods by Gaussian quadrature in advection–diffusion problems with chemical reactions. Comp. and Che. Engng., 61, 156-174 (2014).
Lévine, J. and Rouchon, P., Quality control of binary distillation columns via nonlinear aggregated models. Automatica, 27, 463-480 (1991).
Linhart, A. and Skogestad, S., Computational per-formance of aggregated distillation models. Comp. Che. Engng., 33, 296-308 (2009).
Linhart, A. and Skogestad, S., Reduced distillation models via stage aggregation. Chem. Engng. Sci., 65, 3439-3456 (2010).
Marquardt, W., Nonlinear model reduction for binary distillation. In IFAC Symposium Dyn. and Control
of Chemical Reactors and Distillation Columns, Bournemout, UK, 123-128 (1986).
Musch, H.-E. and Steiner, M., Order reduction of rigorous dynamic models for distillation col-umns. Comput. Chem. Engng., 17, Supl. 1, 311-316 (1993).
Pinto, J. C. and Biscaia, E. C., Order reduction strate-gies for models of staged separation systems. Comput. Chem. Engng., 12(8), 821-831 (1987). Secchi, A. R., DASSLC: User’s Manual – v. 3.7
(Differential-Algebraic System Solver in C). Avail-able at: http://www.enq.ufrgs.br/enqlib/numeric (2009).
Seferlis, P. and Hrymak, A. N., Adaptative colloca-tion on finite elements models for optmizacolloca-tion of multistage distillation units. Chem. Engng. Sci., 49(9), 1369-1382 (1994).
Soares, R. P. and Secchi, A. R., EMSO: A new envi-ronment for modeling, simulation and optimiza-tion. In: Proceeding of the 13th European Sym-posium on Computer Aided Process Engi-neering (ESCAPE 13), Lappeenranta, Finland (2003).
Stewart, W. E., Levien, K. L. and Morari, M., Simu-lation of fractionation by orthogonal collocation. Chem. Engng. Sci., 40, 409-421 (1985).
Villadsen, J. V. and Michelsen, M. L., Solution of Differential Equation Models by Polynomial Ap-proximation. Prentice-Hall (1978).
Villadsen, J. V. and Stewart, W. E., Solution of bound-ary value problems by orthogonal collocation. Chem. Engng. Sci., 22, 1843-1501 (1967).