Faculty of Engineering
University of Porto
Decision support methodology for national
energy planning in developing countries:
An implementation focused approach
Nathan Coenen Lee
Porto
August 2016
Submitted to the Faculty of Engineering of the University of Porto
in partial fulfilment of the requirements for the degree of
Doctor of Philosophy in Sustainable Energy Systems
Supervisor: Vítor Manuel Silva Leal
Faculty of Engineering of the University of Porto
Co-Supervisor: Luís Miguel Cândido Dias
Faculty of Economics of the University of Coimbra
Faculty of Engineering of the University of Porto Rua Dr. Roberto Frias
4200-465 Porto, Portugal Nathan Coenen Lee, 2016
i
Acknowledgements
The last four years have been an opportunity to develop and sharpen my research skills investigating a topic that I have great interest in. I have faced many challenges, and I was fortunate to have the support of others in overcoming these, at times seemingly unsurmountable, barriers. As an international student my acknowledgements must cross substantial geographical distances, but it is important that I do not forget those who have supported me, despite their distance. I must recognize those who have supported my work in Portugal, remember those who aided me during my visit to Ghana, and acknowledge those who have supported me all along from “home” in the United States.
Firstly, I would like to thank Professor Vítor Leal for supervising my research. I have been fortunate to have had his support and guidance for my research over the last four years. I am grateful for the time he made available for discussions as well as his efforts to challenge and enrich my ideas. My thesis is what it is today because of his aid in focusing my research ambitions to a project of interest to the research community with an achievable set of objectives. I am also extremely thankful for his availability throughout the revision process. Next, I would like to acknowledge Professor Luis Dias, my Co-supervisor, for his assistance and technical guidance in the area of decision support methodologies. I am also grateful for his guidance and availability for discussions, which were predominantly conducted from afar. I am also indebted to all of his constructive feedback during the thesis revision process.
I would like to thank Professor Eduardo Oliveira Fernandes at the Faculty of Engineering of the University of Porto (FEUP) for his support for my work. I must also thank the Energy and Built Environment Group at the Institute of Science and Innovation in Mechanical and Industrial Engineering (INEGI) for providing a forum to present and discuss my work.
Of course, I cannot forget to acknowledge all the support provided by all of my fellow MIT Portugal Program Sustainable Energy Systems students at FEUP. I would also like to thank all of those directly or indirectly involved with the MIT Portugal Program, of which Celia Couto at FEUP deserves special mention for all her assistance facilitating my work and stay.
I must extend my gratitude to Professor Ahmad Addo, the Acting Director of The Energy Center (TEC) at Kwame Nkrumah University of Science and Technology (KNUST) in Ghana, for hosting me, and for facilitating my stay during my extended research visit to Ghana. I must thank him for his assistance and aid in installing and working in a new and foreign place.
ii
I am indebted to Professor Imoro Braimah of TEC for graciously agreeing to take the role of Host Supervisor during my time at KNUST. I greatly appreciate all of his time, our discussions regarding the thesis, and in opening doors and contacting the needed people.
I am extremely grateful to Gifty Mensah, a fellow PhD student at KNUST, without whose support prior to and during my stay, the research visit to Ghana would not have been possible. I cannot thank her enough for helping me to get installed, providing introductions and contacts, sharing her office during the frequent power outages, and for her kindness. I would like to acknowledge the support staff at TEC for their kind assistance and for helping me to navigate KNUST and Kumasi. Also, I must extend a thank you to Francis Kemausuor. This work was also supported by The Energy Commission of Ghana. Specifically, I owe my gratitude to Dr. Joseph Yeddu, Head of Strategic Planning & Policy. Dr. Essandoh-Yeddu and his team aided by providing data, hosting me during my work visits to Accra, and acting as excellent guides. Lastly, I am indebted to them for their assistance in organizing, mobilizing the necessary funds, and hosting of a DC in support of the work.
I will never forget the kindness shown by Andreas Ahrenbog at TEC for graciously sharing his office, but most of all for his efforts to make Kumasi a home away from home. Also, I wish to thank everyone at the weekly Chopsticks roundtables that were so welcoming. Without support of this kind an extended stay abroad would have been much more challenging.
Additionally, I am grateful to all of those, named and unnamed here, who have supported me in my stay abroad here in Portugal, during my trip to Ghana, and at “home” in the U.S. It was not always easy, and as those who belong in this list know, we all need someone to lean on, to laugh with, relax with, or complain to from time to time, so thank you.
Special acknowledgements are due to my mother and father, who have provided unwavering encouragement and support for my education since before I even had a say in the matter. I am indebted to them for all of their assistance in my education, work, and travels.
There have been many challenges in the last years, both in my work and in living abroad for an extended time in places that were initially foreign to my wife Débora and me. For this I cannot thank her enough for all of her understanding, patience and support as we undertook this challenge. None of this would have been possible without her help and encouragement.
Without financial support this thesis and my family’s stay in Portugal would have been impossible. This work was developed under the financial support of the Portuguese Foundation for Science and Technology (FCT) in the framework of the MIT Portugal Program, through the scholarship SFRH/BD/51585/2011. The work was partially developed with the financial support of a scholarship provided by FEUP.
The Institute of Science and Innovation in Mechanical and Industrial Engineering (INEGI) at FEUP hosted me for the period of my studies here, and I am grateful for this wonderful support.
iii
Abstract
Energy is a crucial input to almost all economic activities, in addition to being necessary in supporting human development efforts. The energy planning (EP) activity is a principal step in the development of an energy strategy. EP objectives that are specific to the local context of the EP activity may aid in ensuring the implementability and sustainability of energy plans and policies.
The purpose of this research was to identify EP objectives specific to the local context of developing countries, together with their relative operational attributes, and to structure these within a transparent multi-objective decision making methodology for EP at the national level. A national energy system model was constructed to support this EP methodology. The countries of the Economic Community of West African States (ECOWAS) were used as a representative area of study.
The first stage of the work consisted of structuring the energy planning problem. A review of EP practices and methods currently in use in the ECOWAS was completed to identify gaps in the state of the art and to develop recommendations to guide the work. An EP methodology was established to allow for the EP activity to be conducted in a strategic, systematic, and transparent manner supporting all the actors involved. Context specific EP objectives were identified and made operational with quantifiable attributes, in addition to a set of commonly considered EP objectives.
The second stage comprised the development of a national energy demand and supply system model for application in a case study country: Ghana. A baseline energy demand and supply projection was developed. Additionally, a set of EP alternatives was established representing future energy policy pathways.
The third stage of the work was the development of a multi criteria decision aid (MCDA) methodology for use in the evaluation of EP alternatives in achievement of the EP objectives. The fourth stage consisted of a case study conducted for the ECOWAS member state of Ghana. The case study was conducted to implement the national EP methodology in a real world application and to assess the outcomes of the use of the context specific EP objectives. The work proposed and applied a methodology for EP at the national level in developing countries consisting of the three main activities of problem structuring, energy modeling and MCDA evaluation. The proposed methodology provides a procedure for the development of EP objectives specific to the context of application and the transparent systematic analysis of a set of EP alternatives, to support energy policy development.
v
Resumo
A energia tem um contributo crucial em praticamente todas as atividades económicas, além de ser necessária para o desenvolvimento civilizacional em sentido geral. A atividade do planeamento energético (PE) tem um papel importante no desenvolvimento de estratégias energéticas. Os objetivos do PE, que são específicos do seu contexto local de atividade, podem contribuir para assegurar a viabilidade e sustentabilidade das políticas energéticas. Esta investigação teve como propósito identificar os objetivos do PE, específicos do contexto local dos países em desenvolvimento, em conjunto com os seus respetivos atributos operacionais, estruturando-os dentro de uma metodologia transparente de apoio à decisão multi-objectivo para o PE a nível nacional. Foi construído um modelo de sistema energético nacional para suportar esta metodologia. Os países da Comunidade Económica dos Estados da África Ocidental (CEDEAO) foram usados como área de estudo representativa.
A primeira etapa do trabalho consistiu em estruturar a problema do PE. Foi concluída uma revisão das práticas e métodos de PE, usados atualmente no CEDEAO, para identificar lacunas no estado da arte e formular recomendações para orientar o trabalho. Foi estabelecida uma metodologia de PE para permitir o desenrolar da sua atividade de uma forma estratégica, sistemática, e transparente para apoiar todos os fatores envolvidos. Foram identificados os objetivos do PE, específicos do contexto local, e foram operacionalizados com atributos quantificáveis, além de um conjunto de objetivos de PE geralmente considerados.
A segunda etapa incluiu o desenvolvimento de um modelo de oferta e de procura de energia para o sistema energético nacional, destinado ao país em estudo, o Gana. Foi desenvolvido um cenário de referência para a evolução futura de oferta e de procura de energia. Adicionalmente foi estabelecido um conjunto de alternativas de PE que descrevem percursos de futuras políticas energéticas.
A terceira etapa do trabalho consistiu no desenvolvimento de uma metodologia multicritério de apoio à decisão (MCDA) para ser utilizada na avaliação das alternativas que irão permitir a realização dos objetivos do PE.
A quarta etapa é constituída pelo estudo de caso realizado para o Gana, um estado membro do CEDEAO. Este estudo teve como objetivo a aplicação da metodologia do PE nacional num contexto real e a avaliação dos resultados da aplicação dos objetivos de PE específicos deste contexto.
O trabalho propôs e aplicou uma metodologia para o PE ao nível nacional dos países em desenvolvimento, que consistiu nas três atividades principais da estruturação do problema, modelação energética e avaliação MCDA. A metodologia proposta apresenta uma estrutura para o desenvolvimento dos objetivos específicos do contexto da aplicação e a avaliação sistemática e transparente de um conjunto de alternativas de PE, para apoiar o desenvolvimento das políticas energéticas.
vii
Contents
Acknowledgements ... i Abstract ... iii Resumo ... v Contents ... vii Abbreviations ... xi Symbols ... xiii ...1 Introduction 1.1 Motivation ... 11.1.1 Role of Energy in development ... 1
1.1.2 The national energy planning problem ... 7
1.1.3 Energy planning concerns in developing countries ... 9
1.1.4 Decision making in energy planning ... 14
1.2 Research objectives and questions... 15
1.3 Research scope and limitations ... 16
1.3.1 Scope ... 16
1.3.2 Limitations ... 18
1.3.3 Contribution ... 19
1.4 Thesis organization ... 19
... 21
Energy planning practices and methods in developing countries 2.1 Introduction ... 21
2.2 Energy planning and implementation ... 22
2.3 Energy planning practices in sub-Saharan Africa ... 23
2.4 The Economic Community of West African States (ECOWAS) ... 24
2.4.1 Socio-economic situation ... 25
2.5 Methodology ... 26
2.5.1 Document gathering and filtering ... 26
2.5.2 Matrix of analysis ... 28
2.6 Results from ECOWAS EP review... 30
2.6.1 Who is active in EP? ... 30
2.6.2 What is the purpose of the EP activity? ... 33
2.6.3 How is energy demand considered? ... 38
2.6.4 What is the scope of the EP activity? ... 41
2.6.5 What energy planning indicators are employed? ... 43
2.7 Updated review of EP activities - 2015 ... 45
2.7.1 Methodology... 46
2.7.2 Results ... 47
2.8 Summary of literature review ... 53
2.8.1 Who is active in EP activities? ... 53
2.8.2 What is the purpose of the EP activities? ... 54
2.8.3 How is energy demand considered? ... 56
2.8.4 What is the scope and what are the tools being adopted? ... 57
viii
... 61
Development of a national energy planning methodology 3.1 Introduction ... 61
3.2 Problem structuring ... 62
3.2.1 Problem structuring methods ... 64
3.2.2 Problem structuring and EP ... 67
3.3 Application of problem structuring method ... 68
3.4 Framing the problem ... 69
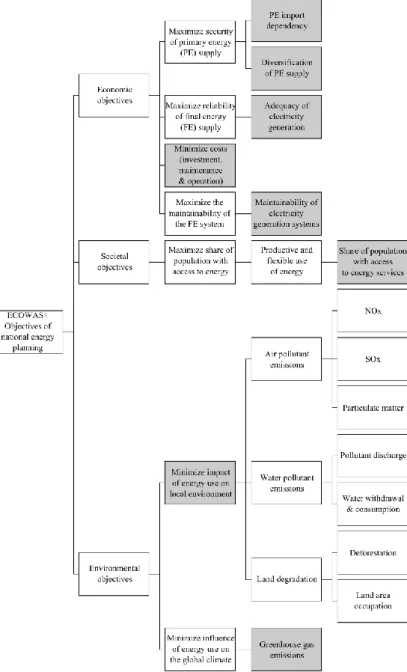
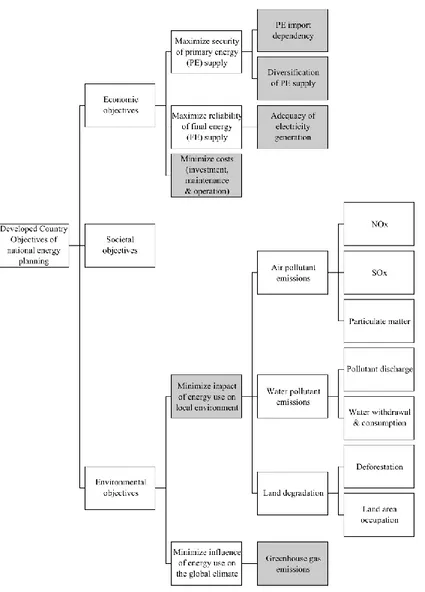
3.5 Structuring the problem ... 70
3.6 Refining the problem ... 75
3.6.1 Maximize the security of the PE supply ... 76
3.6.2 Maximize the reliability of FE supply ... 80
3.6.3 Maximize the maintainability of the FE system ... 82
3.6.4 Maximize access to the FE supply ... 85
3.6.5 Minimize costs of the energy system ... 91
3.6.6 Minimize impact of the energy system on the global climate ... 97
3.6.7 Minimize impact of the energy system on the local environment ... 102
3.7 Energy modeling ... 107
3.7.1 Elaboration of possible future scenarios ... 108
3.7.2 Development of a reference projection ... 108
3.8 Development of EP alternatives ... 108
3.8.1 Methods of EP alternative generation ... 108
3.9 Multi-criteria decision support methods ... 109
3.9.1 Classification of multi-criteria decision support methods ... 109
3.9.2 Value measurement methods and software ... 110
3.9.3 Outranking ... 115
3.10 Choice of multi-criteria evaluation method(s) ... 116
3.10.1 Requirements of method ... 116
3.10.2 Selection of MCDA method ... 119
... 123
National energy system modeling 4.1 Energy systems modeling ... 123
4.2 Energy model characterization ... 123
4.2.1 Purpose ... 124 4.2.2 Aggregation level ... 126 4.2.3 Underlying methodology ... 130 4.2.4 Geographical coverage ... 131 4.2.5 Time horizon ... 132 4.2.6 Data requirements ... 132
4.2.7 Requirements for a national energy system model ... 133
4.2.8 Existing energy systems models ... 135
4.3 Energy accounting ... 137
4.3.1 Additional accounting considerations ... 139
4.4 Overview of the national energy systems model ... 140
4.5 Disaggregation of energy data and modeling methodology ... 142
4.6 Energy demand considerations ... 142
4.6.1 Sectoral analysis ... 143
4.6.2 Residential sector ... 144
4.6.3 Service sector ... 149
4.6.4 Industry sector ... 152
4.6.5 Transport sector ... 160
4.6.6 Agriculture and Fishery sector ... 164
ix
4.7.1 PE Supply ... 167
4.7.2 Charcoal production ... 173
4.7.3 Petroleum refining ... 174
4.7.4 Electricity generation ... 176
4.7.5 Transmission and distribution system ... 179
4.8 Reference projection development ... 180
4.8.1 Residential sector projections ... 180
4.8.2 Service sector projections ... 183
4.8.3 Industry sector projections ... 184
4.8.4 Transport sector projections ... 185
4.8.5 Agriculture and Fishery sector projections ... 185
4.8.6 PE supply and transformation projections ... 186
... 187
Case study part I – National energy system modeling 5.1 Purpose of the case study ... 187
5.2 Choice of case study country ... 188
5.3 Description of Ghana in the context of the case study ... 188
5.3.1 Previous and current EP and policy efforts in Ghana ... 190
5.3.2 Overview of the national energy system – Ghana ... 191
5.4 Key parameters – Energy Demand and Supply Model ... 194
5.4.1 Population and households ... 194
5.4.2 Economic ... 195
5.5 Access to electricity ... 196
5.6 Energy demand model – Ghana ... 199
5.6.1 Residential sector demand ... 202
5.6.2 Service sector demand ... 212
5.6.3 Industry sector demand ... 220
5.6.4 Transport sector demand ... 227
5.6.5 Agriculture and Fishery sector demand ... 230
5.7 PE supply and transformation ... 237
5.7.1 PE supply ... 237
5.7.2 Charcoal production ... 239
5.7.3 Petroleum refinery ... 239
5.7.4 Electricity generation ... 240
5.7.5 Transmission and distribution ... 244
5.8 Calibration of the energy system model for Ghana ... 245
5.9 Reference projection ... 247
5.10 EP 2008-2020 alternatives ... 250
5.10.1 Alt. 1 - Proven renewables ... 251
5.10.2 Alt. 2 - Young renewables ... 252
5.10.3 Alt. 3 – Minigrid Access ... 253
5.10.4 Alt. 4 - Standalone Access ... 253
5.10.5 Alt. 5 - Refinery & DSM ... 254
5.10.6 Alt. 6 - Diverse actions I ... 256
5.10.7 Alt. 7 - Diverse actions II ... 257
5.10.8 Alt. 8 - Diverse actions III ... 258
5.10.9 Summary of EP 2008-2020 alternatives ... 259
... 263
Case study part II - Multi-criteria evaluation 6.1 Introduction to the case study part II ... 263
x
6.3 Decision conference ... 264
6.3.1 Framing the problem ... 265
6.3.2 Generating preference information... 269
6.3.3 Evaluation of alternatives without preference information: SMAA-2 ... 272
6.3.4 Evaluation of alternatives with preference information: SMAA-2 ... 273
6.3.5 Evaluation of alternatives with preference information: VIP Analysis ... 276
6.3.6 Summary of Evaluation of the EP alternatives ... 281
6.4 Expanded EP 2008-2020 alternative set. ... 283
6.4.1 Alt. 9 - Universal access and modern services ... 283
6.4.2 Alt. 10 - Diverse PE supply ... 284
6.4.3 Alt. 11 - Lowest investment cost ... 285
6.4.4 Alt. 12 - Lowest running cost ... 285
6.4.5 Alt. 13 - Local energy resources ... 286
6.4.6 Alt. 14 – Highly maintainable ... 287
6.4.7 Alt. 15 – Expanded renewables ... 288
6.4.8 Summary of expanded EP 2008-2020 alternatives set ... 288
6.4.9 Performance assessment and value scoring of expanded EP 2008-2020 alternative set. ... 291
6.4.10 Evaluation of expanded alternative set without preference information: SMAA-2 ... 292
6.4.11 Evaluation of expanded EP alternative set with preference information: SMAA-2 ... 293
6.4.12 Evaluation of expanded EP alternative set with preference information: VIP Analysis ... 297
6.4.13 Summary of evaluation of the expanded EP alternative set ... 302
6.5 Sensitivity analysis ... 303
6.5.1 Sensitivity analysis – Evaluation of expanded EP alternative set given variations in performance: SMAA-2 ... 305
6.5.2 Sensitivity analysis – Evaluation of expanded EP alternative set given variations in performance: VIP Analysis ... 306
6.5.3 Summary of sensitivity analysis evaluation ... 308
6.6 Case study conclusions ... 309
... 311
Conclusions 7.1 Energy system model ... 311
7.2 Case study insights ... 313
7.3 Conclusions on the research questions ... 315
7.4 Implications ... 316
7.5 Future work ... 318
References ... 321
Appendix A ... 341
Implementation factors literature review Appendix B ... 343
Mobility level- Transports Appendix C ... 349
Reference projection and Alternatives Appendix D ... 387
Evaluation of alternatives Appendix E ... 407
xi
Abbreviations
AC Air-conditioning
AHP Analytical Hierarchical Process b/d Barrels per day (petroleum) bbd Barrels (petroleum)
BP British Petroleum
CaVE Cabo Verde Modelo Energético
CEDEAO Comunidade Económica dos Estados da África Ocidental
CCGT Combined Cycle Gas Turbine
CDU Crude oil distillation unit CFL Compact fluorescent lamp
COMAP Comprehensive Mitigation Analysis Process CoreUrban Urban core
CRT Cathode ray tube
DC Decision conference
DEFENDUS Development-Focused END-Use oriented Service-directed DEP Decentralized energy planning
DM Decision maker
DSM Demand Side Management EC Energy Commission of Ghana ECG Electricity Company of Ghana
ECOWAS Economic Community of West African States ECREEE ECOWAS Centre for Renewable Energy and Energy Efficiency EDI Energy Development Index EER Energy efficiency ratio
EFOM Energy Flow Optimisation Model
EI Energy intensity
ELECTRE ELimination Et Choix Traduisant la REalité (ELimination & Choice Expressing REality)
ENS Energy not supplied
EP Energy planning
EPRAP Energy for Poverty Reduction Action Plan
ES Energy security
FE(C) Final energy (carrier)
FEI Final Energy intensity
GAMS General Algebraic Modeling System
GDP Gross domestic product
GHG Greenhouse gas
GIS Graphical information systems GNI Gross national income
GPRS Ghana Poverty Reduction Strategy
GridCo Ghana Grid Company
GRIP Generalized Regression with Intensities of Preference
GT Gas Turbine
GVA Gross value added
H2RES Energy planning of islands and isolated regions HDI Human Development Index
HHS Households
HVAC Heating ventilation and air-conditioning IEA International Energy Agency
IPCC Intergovernmental Panel on Climate Change IPP Independent Power Producer IRP Integrated Resource Planning JSMAA Java implementation of SMAA methods (software) KAMM Karlsruhe Atmospheric Mesoscale Model KITE Kumasi Institute of Technology, Energy and Environment KNUST Kwame Nkrumah University of Science and Technology (Ghana) LCD Liquid crystal display
LEAP Long-range Energy Alternative Planning LED Light-emitting diode
LNG Liquefied natural gas LPG Liquefied petroleum gas MACBETH
Measuring Attractiveness by a Categorical Based Evaluation Technique
MADM Multi-attribute decision making
MAED Model for Analysis of Energy Demand
MARKAL MARKet ALlocation
MAUT Multi-attribute utility theory
MAVT Multi-attribute value theory
MCDA Multi-criteria decision assessment (or analysis or aid) MDG Millennium Development Goal (United Nations) MESSAGE Model of Energy Supply Systems and their General Environmental Impacts MESTI Ministry of Environment Science Technology and Innovation (Ghana) MMSCFD Million standard cubic feet per day
xii MoE Ministry of Energy (Ghana)
MoP Ministry of Power (Ghana) NEAP National Energy Efficiency Action Plan NEB National energy balance
NEB National Energy Board (Ghana) NED Northern Electricity Department (Ghana)
NEMS National Energy Modeling Systems
NES National Electrification Scheme (Ghana) NFI National Focal Institute
NGC Net generation capacity NPA National Petroleum Authority (Ghana) OECD Organisation for Economic Co-operation and Development
OLED Organic light-emitting diode
OR Operational research
OSeMOSYS Open Source Energy Modelling System PAIRS Preference Assessment By Imprecise Ratio Statements
PE(S) Primary energy (supply)
PE Planeamento energético (Used only in the Resumo) PeriUrban Urban periphery
pkm Passenger kilometer (mobility) POLES Prospective Outlook on Long-term Energy Systems
PROMETHE
Preference Ranking Organization METHod for Enrichment of Evaluations
PSM Problem structuring methods PURC Public Utilities and Regulatory Commission (Ghana)
PV Photo voltaic
PVSyst Photovoltaic System Studies RAC Reliably available capacity RETSCREEN
Renewable-energy and Energy-efficient Technologies Clean Energy Project Analysis Software
RFCC Residual fuel catalytic cracker RFO Refined fuel oil
RIEP Regional Integrated Energy Plan
RMGC Remaining margin of generation capacity SAIDI System average interruption index
SAPP Sunon Asogli Power Plant
SE4ALL United Nations Sustainable Energy for all Initiative SEA Strategic environmental assessment SHEP Self-Help Electrification Program SIMPACTS Simplified Approach for Estimating Impacts
SMAA Stochastic Multi-Criteria Acceptability Analysis
SMART Specific, Measurable, Achievable, Realistic and Timed SNEP Strategic National Energy Plan (Ghana) SODA Strategic Options Development and Analysis SPLAT-W System Planning Tool (West African Power Pool system) SSA sub-Saharan Africa
SSM Soft Systems Methodology SWOT Strengths, Weaknesses, Opportunities and Threats
TAPCO Takoradi Power Company
TDL Transmission and distribution system losses TEC The Energy Center (KNUST, Ghana)
TICO Takoradi International Company
TIMES The Integrated MARKAL-EFOM System
tkm Ton kilometer (mobility)
TO Tullow Oil
TOR Tema Oil Refinery
TRL Technology Readiness Level
UN United Nations
UNCTAD UN Conference on Trade and Development
UNDP UN Development Programme
UNEP UN Environment Programme
UNFCCC UN Framework Convention on Climate Change UNIDO UN Industrial Development Organization US $ Dollars – United States of America US EIA Energy Information Agency - United States of America VIP Analysis Variable Interdependent Parameters Analysis VISA Visual Interactive Sensitivity Analysis VOC Volatile organic compound
VALCO Volta Aluminum Company (Ghana)
VRA Volta River Authority (Ghana) WADE World Alliance for Decentralized Energy
WAGP West African Gas Pipeline
WAPCo West African Gas Pipeline Company
WAPP West African Power Pool
WASP Wien Automatic System Planning
Package
WAsP Wind Atlas Analysis and Application Program WINPRE Workbench for INteractive PREference Programming
xiii
Symbols
𝐴𝑐𝑐𝑒𝑠𝑠 𝑝,𝑖 Share of households of population type p that have access to carrier i [%]
𝐴𝑐𝑐𝑒𝑠𝑠1,𝑦 Share of households with access to electricity in year y following the traditional method for evaluation (1) [%]
𝐴𝑐𝑐𝑒𝑠𝑠2,𝑦 Constructed value evaluating access, with the FE service method for evaluation (2) [constructed scale 0-12]
𝐴𝑑𝑒𝑞𝑢𝑎𝑐𝑦𝑦 Adequacy of electricity generation in year y [-]
𝐴𝑛𝑛𝑢𝑎𝑙 𝐺𝑒𝑛𝑒𝑟𝑎𝑡𝑖𝑜𝑛 𝑐𝑎𝑝𝑎𝑐𝑖𝑡𝑦𝑒𝑙𝑒𝑐𝑡𝑟𝑖𝑐𝑖𝑡𝑦,𝑦𝑒𝑙𝑒𝑐 𝑔𝑒𝑛 Domestic electricity generation, FE carrier i, capacity in year y [ktoe]
𝐴𝑝,𝑖,𝑦 Share of HHS of population type p that has access to carrier i in year y [%]
𝐴𝑣𝑎𝑖𝑙𝑎𝑏𝑖𝑙𝑖𝑡𝑦𝑔𝑒𝑙𝑒𝑐 𝑔𝑒𝑛 Availability factor of electricity generation technology g [%]
c𝑟 Correction factor for PE resource r, calculated as the share of PE resource r provided by indigenous sources. An increased indigenous PE supply of resource r results in an increased value for 𝐷2 [-]
𝐶𝑎𝑝𝑢,𝑔,𝑦𝑒𝑙𝑒𝑐 𝑔𝑒𝑛 Installed capacity of unit u=1,2,3…,Y, of generation technology g=1,2,3,…W, in year y [MW]
Cap𝑔,𝑦
𝑒𝑙𝑒𝑐 𝑔𝑒𝑛 Total installed capacity of technology type g in year y [MW]
𝑐𝑎𝑝𝑖𝑡𝑎 𝑦 Population in year y [people]
𝐶𝑜𝑛𝑛𝑒𝑐𝑡 𝐶𝑜𝑠𝑡𝑐 Cost per new connection of type c [monetary units/ household] 𝐶𝑜𝑛𝑛𝑒𝑐𝑡𝑖𝑜𝑛𝑠𝑝,𝑐 Number of households newly connected in year y [households]
𝐶𝑜𝑠𝑡ℎ,𝑦 Total cost from sectors : h=1 →electricity generation capacity, h=2 → transmission and distribution system, & h=3 → New connections (access) & h=4 → petroleum refineries, in year y [US dollars]
𝐷1 Shannon-Weiner diversity index [-]
𝐷2 Shannon-Weiner diversity index, import reflective. [-]
𝑒𝑚𝑖𝑠𝑠𝑖𝑜𝑛 𝑓𝑎𝑐𝑡𝑜𝑟𝑓,𝑟 Default emission factor for emissions of GHG f, for fuel type r [kg/TJ] ESA1 Measure of diversity of PE supply [-]
ESA2 Measure of diversity and import dependency of PE supply [-]
ESAimport Import reflective measure of PE diversity [-]
𝐹𝐸𝐶𝑝𝑒𝑡𝑟𝑜𝑙𝑒𝑢𝑚𝑇𝑂𝑅 Petroleum based FE carrier outputs from the TOR for FE carrier i in year y [ktoe]
𝐹𝐸𝐼𝑖,𝑠,𝑦𝑆𝑒𝑟 Final energy intensity at the energy service level for carrier i and service s in year y
[ktoe/monetary units]
xiv
Sector [ktoe/ monetary units] or [ktoe/pkm or tkm]
𝐹𝐸𝐼𝑝,𝑖,𝑠,𝑦𝑅𝑒𝑠, 𝑎𝑝𝑝 The FE intensity per unit of appliance (e.g. appliance or technology) for population type y
for FE carrier i attributable to FE service s, in year y [ktoe/appliance]
𝐹𝐸𝐼𝑝,𝑖,𝑠,𝑦 Final energy intensity for population type p for final energy carrier i and final energy service
s, in year y [ktoe/household]
𝐹𝑢𝑒𝑙 𝑐𝑜𝑠𝑡𝑔 Cost of fuel that corresponds to technology g [monetary units /ktoe] g=1,2,3,…W Newly installed electricity capacity types [-]
gij Performance element i of alternative ai corresponding to the attribute j.
𝐺𝐻𝐺𝑓,𝑑,𝑦 Total emissions of GHG f=1…N from emission source sector, d=1 – electricity generation
(stationary), d=2 petroleum refining (stationary) and d=3 transportation [kton/year] 𝐺𝐻𝐺𝑓,𝑦 The total emissions of GHG f, for GHG f=1…N, in year y [kton]
𝐺𝑉𝐴𝑦𝑆𝑒𝑐𝑡𝑜𝑟 Gross value added by the Sector in the year y [ monetary units ]
𝐺𝑟𝑜𝑤𝑡ℎ 𝑏 Growth rate of line type b where b=1 is transmission and b= 2 is distribution [km/year] 𝐺𝑊𝑃𝑓 Global Warming Potential of GHG f [-]
𝐻𝐻𝑆𝑝,𝑦 Households of population type p in year y [households] i=1,2,3,…M Final energy carrier types [-]
𝑖𝑛𝑡 The fixed annual interest rate [%]
𝑖𝑛𝑣. 𝑐𝑜𝑠𝑡𝑏 Unit investment cost of line (transmission and distribution) type b [monetary units /km] inv. cost𝑔 Unit investment cost for technology type g [US dollars /kW]
𝐼𝑛𝑣𝑒𝑠𝑡𝑚𝑒𝑛𝑡𝑖𝑛𝑡𝑒𝑟𝑣𝑒𝑛𝑡𝑖𝑜𝑛 Cost for installed capacity for each specific intervention considered [monetary units] k=(k1…kn ) Importance parameters in the linear additive value function.
𝐿𝑜𝑐𝑎𝑙 𝐸𝑛𝑣. 𝐼𝑚𝑝𝑎𝑐𝑡𝑦 Local environmental impact in year y [constructed scale 0-3] 𝐿𝑜𝑠𝑠𝑦𝑑𝑖𝑠𝑡 Effective losses resulting from the distribution system in year y [%]
𝐿𝑜𝑠𝑠𝑦𝑡𝑟𝑎𝑛𝑠 Effective losses resulting from the transmission system in year y [%]
𝐿𝑢𝐸 Evaluated level of local environmental impact (E) of the generation technology type. [constructed scale 0-3]
𝐿𝑢𝑀 The evaluated level of maintainability (M) of installed generation technology type u [constructed scale 0-3]
m𝑟 Share of net import in PE supply of resource r [%]
𝑀𝑎𝑖𝑛𝑡𝑎𝑖𝑛𝑎𝑏𝑖𝑙𝑖𝑡𝑦𝑦 Maintainability of the of the electricity generation system in year y [constructed scale 0-3] 𝑀𝑜𝑏𝑖𝑙𝑖𝑡𝑦𝑘,𝑖,𝑞,𝑦 The mobility for subsector k and FE carrier i for either passenger (q=1) or freight (q=2) in
year y [ktoe⁄ (pass or tkm)]
𝑀𝑜𝑏𝑖𝑙𝑖𝑡𝑦𝑠,𝑦 Mobility in the sector for the year y for subsector s, for passenger [ktoe/pkm] and freight [ktoe/tkm]
N Loan’s term in number of years (or number of yearly payments) [years] 𝑁𝐺𝐶𝑦 The net installed generation capacity in the given year [MW]
xv
𝑂𝑝𝑒𝑟. & 𝑀𝑎𝑖𝑛𝑡. 𝑐𝑜𝑠𝑡 𝑏 The operation and maintenance cost as a share of the total value of existing stock [%] 𝑂𝑝𝑒𝑟. & 𝑀𝑎𝑖𝑛𝑡.𝑔 Annual unit operation and maintenance costs for installed capacity [monetary units /kW]
𝑂𝑤𝑛𝑝,𝑖,𝑠,𝑦 Level of ownership of units at the household level for population type y for FE carrier i
attributable to FE service s, in year y [appliance/household]
𝑝𝑟 Share that primary energy resource r in total primary energy supply, for all resources in r=1…U: (U primary energy resources used) [%]
𝑝𝑙𝑜𝑎𝑛 Loan amount or the loan’s principal. This is calculated by the difference of the total investment cost and the initial down payment. [monetary units]
p=1,2,3 Residential population type 1→ CoreUrban, 2→PerUrban, & 3→Rural [-] 𝑃𝐸𝑆𝑟,𝑔 PES requirements of resource r for electricity generation unit g [ktoe]
𝑃𝐸𝑆𝐷𝑆𝑇,𝑦 PES requirements of direct solar thermal energy (DST),in year y [ktoe]
𝑃𝐸𝑆𝑟,𝑑,𝑦 Primary energy supply combusted for electricity generation (d=1) or petroleum refining
(d=2) of fuel type r [ktoe]
𝑃𝐸𝑆𝑐𝑟𝑢𝑑𝑒 𝑜𝑖𝑙,𝑦𝑇𝑂𝑅 PES requirements for the TOR of crude oil, in year y [ktoe]
𝑃𝐸𝑆𝑐𝑟𝑢𝑑𝑒 𝑜𝑖𝑙,𝑦𝐼𝑚𝑝 PES imports of crude oil in year y [ktoe]
𝑃𝐸𝑆𝑝𝑒𝑡𝑟𝑜𝑙𝑒𝑢𝑚,𝑦𝐼𝑚𝑝 Imported PES for petroleum products, in year y [ktoe]
𝑃𝐸𝑆𝑛𝑎𝑡𝑢𝑟𝑎𝑙 𝑔𝑎𝑠,𝑦𝐼𝑚𝑝 PES imports of natural gas in year y [ktoe]
𝑃𝐸𝑆𝑛𝑎𝑡𝑢𝑟𝑎𝑙 𝑔𝑎𝑠,𝑔,𝑦 PES requirements of natural gas for electricity generation unit g, in year y [ktoe]
𝑃𝐸𝑆𝑐𝑜𝑎𝑙,𝑦𝐼𝑚𝑝 PES imports of coal, in year y [ktoe]
𝑃𝐸𝑆𝑐𝑜𝑎𝑙,𝑔,𝑦 PES requirements of coal, for electricity generation unit g, in year y [ktoe]
𝑃𝐸𝑆𝑖𝑚𝑝𝑜𝑟𝑡𝑒𝑑 𝑒𝑙𝑒𝑐𝑡𝑟𝑖𝑐𝑖𝑡𝑦,𝑦𝐼𝑚𝑝 The imported electricity, in the year y [ktoe]
𝑃𝐸𝑆𝑏𝑖𝑜𝑚𝑎𝑠𝑠,𝑦 Total PES requirement of biomass, in year y [ktoe]
𝑃𝐸𝑆𝑏𝑖𝑜𝑚𝑎𝑠𝑠,𝑦𝑐ℎ𝑎𝑟𝑐𝑜𝑎𝑙 Biomass PES requirement for production of charcoal, in year y [ktoe]
𝑃𝐸𝑆𝑟,𝑦𝑀 𝑒𝑙𝑒𝑐 𝑔𝑒𝑛 PES requirement, r, for electricity generation for minigrids (M) in year, y [ktoe]
𝑃𝐸𝑆𝑟,𝑦𝑆 𝑒𝑙𝑒𝑐 𝑔𝑒𝑛 PES requirement, r, for electricity generation for standalone systems (S) in year, y [ktoe]
𝑃𝐸𝑆𝑟,𝑦𝑒𝑙𝑒𝑐 𝑔𝑒𝑛 PES requirement, r, for electricity generation in year, y [ktoe]
𝑃𝑟𝑜𝑑𝑢𝑐𝑡𝑖𝑜𝑛 𝑐𝑎𝑝𝑎𝑐𝑖𝑡𝑦𝑖,𝑦𝑇𝑂𝑅 The annual production capacities for each output FE carrier i and year y. [ktoe]
𝑄𝑐ℎ𝑎𝑟𝑐𝑜𝑎𝑙,𝑦 FE Demand in year y for charcoal [ktoe]
𝑄𝑒𝑙𝑒𝑐𝑡𝑟𝑖𝑐𝑖𝑡𝑦,𝑦𝑀 𝑡𝑜𝑡𝑎𝑙 Total FE demand for minigrid (M) supplied electricity, in year y [ktoe]
𝑄𝑒𝑙𝑒𝑐𝑡𝑟𝑖𝑐𝑖𝑡𝑦,𝑦𝑆 𝑡𝑜𝑡𝑎𝑙 Total FE demand for minigrid (S) supplied electricity, in year y [ktoe]
𝑄𝑖,𝑦𝑆𝑒𝑐𝑡𝑜𝑟 Aggregate FE demand for FE carrier i in year y for FE demand Sector [ktoe]
xvi
𝑄𝑘,𝑖,𝑠,𝑦𝑆𝑒𝑐𝑡𝑜𝑟 FE demand for FE carrier i attributable to FE service s in subsector k in year y for the Sector [ktoe]
𝑄𝐷𝑆𝑇,𝑦𝑡𝑜𝑡𝑎𝑙 FE demand for the DST FE carrier, in year y [ktoe]
𝑄𝑖,𝑦𝑡𝑜𝑡𝑎𝑙 Total FE demand for FE carrier i in corresponding year y [ktoe]
𝑄𝑒𝑙𝑒𝑐𝑡𝑟𝑖𝑐𝑖𝑡𝑦,𝑦𝑡𝑜𝑡𝑎𝑙 Total FE demand for electricity in year y [ktoe]
𝑄𝑒𝑙𝑒𝑐𝑡𝑟𝑖𝑐𝑖𝑡𝑦,𝑦𝑡𝑜𝑡𝑎𝑙+𝑇𝐷𝐿 Total FE demand for electricity, with transmission and distribution system losses (TDL) in year y [ktoe]
𝑄𝑓𝑢𝑒𝑙𝑤𝑜𝑜𝑑,𝑦𝑡𝑜𝑡𝑎𝑙 Total FE demand for fuelwood in year y [ktoe]
𝑄𝑖𝑇𝑂𝑅 Final energy demand for FE carrier i supplied by the oil refinery [ktoe]
𝑄𝑘,𝑖,𝑦 FE demand from sector k for FE carrier i in year y [ktoe]
𝑄𝑝,𝑖,𝑠,𝑦𝑅𝑒𝑠 FE demand from population type p for FE carrier i attributable to FE service s, in year y [ktoe]
r=1,2,3,…U Primary energy resource types [-]
𝑅𝐴𝐶𝑦 The remaining generation capacity that results from the difference of the NGC and the unavailable capacity in year y [MW]
𝑅𝑀𝐺𝐶𝑦 Remaining margin of electricity generation capacity in year y [MW]
𝑅𝑒𝑝𝑖,𝑠,𝑦𝑗, 𝑎𝑝𝑝: Representative efficiency of the end-use technology mix for the FE service s – carrier i
combination in year y, calculated at for each sector j [%]
𝑅𝑒𝑝𝑝,𝑖,𝑠,𝑦𝑗, 𝑎𝑝𝑝 Representative efficiency of the end-use technology mix for the FE service s – carrier i
combination in year y, calculated at for each sector j, and population type p [%] s=1,2,3,…P Final energy services considered [-]
𝑆ℎ𝑎𝑟𝑒1,𝑝,𝑦 Percentage of households of population type p in year y that are assumed to have access, following evaluation method 1 [%]
𝑆ℎ𝑎𝑟𝑒2,𝑝,𝑚,𝑦 Percentage of households in population type p with access to portfolio m in year y, following evaluation method 2 [%]
𝑆ℎ𝑎𝑟𝑒𝑐 Share of new connections met by connection type c [%]
𝑆ℎ𝑎𝑟𝑒𝑓,𝑦 Share that technology f represents in the transformation process in year y [%] 𝑠ℎ𝑎𝑟𝑒𝑔,𝑦 Share that technology g represents in the total installed capacity in year y [%] 𝑆ℎ𝑎𝑟𝑒𝑔,𝑦𝑀 𝑒𝑙𝑒𝑐 𝑔𝑒𝑛 Share that technology g represents in the minigrid generation mix in year y [ktoe]
𝑆ℎ𝑎𝑟𝑒𝑔,𝑦𝑒𝑙𝑒𝑐 𝑔𝑒𝑛 Share that technology g represents in the national mix (installed capacity) in year y [ktoe] 𝑆ℎ𝑎𝑟𝑒𝑘,𝑖,𝑦 Share that FE demand for carrier i represents in subsector k in the year y [%]
𝑆ℎ𝑎𝑟𝑒𝑘,𝑠,𝑖,𝑦 Share that FE service s represents of FE demand for carrier i in subsector k in the year y [%] 𝑆ℎ𝑎𝑟𝑒𝑠,𝑖,𝑦 Share that FE service s represents of FE demand for carrier i, and year y [%]
𝑆ℎ𝑎𝑟𝑒 𝑧,𝑖,𝑠,𝑦𝑗,𝑘 Share that technology z represents in the mix of appliances, z=1, 2, 3, ..., H, that provide FE service s for the respective carrier i in sector j and subsector k , in year y[%]
𝑆ℎ𝑎𝑟𝑒 𝑧,𝑖,𝑠,𝑦𝑗 Share that technology z represents in the mix of appliances, z=1, 2, 3, ..., H, that provide FE service s for the respective carrier i in the sector j and year y [%].
xvii
𝑆𝑒𝑟𝑣𝑖𝑐𝑒𝑠𝑚 FE services assumed available to households with access to portfolio m [count of FE services] 𝑆𝑡𝑜𝑐𝑘𝑏,𝑦−1 Total stock in distance of line type b in year y-1 [km]
𝑇𝑜𝑡𝑎𝑙 𝐶𝑜𝑠𝑡𝑦 Total costs from all sectors considered, h=1 → electricity generation capacity, h=2 → transmission and distribution system, & h=3 → New connections (access) & h=4 → petroleum refineries in year y [Monetary units]
𝑇𝑜𝑡𝑎𝑙 𝐺𝐻𝐺𝑦 Total GHG emissions in year y [kton] u=1,2,3…,Y Electricity generation installed units [-] uj Partial value function for the attribute j.
𝑢𝑛𝑎𝑣𝑎𝑖𝑙𝑎𝑏𝑙𝑒 𝑐𝑎𝑝𝑎𝑐𝑖𝑡𝑦𝑦 Generation capacity that is unavailable in year y calculated with the availability factor of each generation capacity technology type [MW]
𝑢𝑛𝑖𝑡 𝑐𝑜𝑛𝑣𝑒𝑟𝑠𝑖𝑜𝑛𝑟 Factors to convert units for result in calculation of GHG emissions [kg/kton & ktoe/TJ] V(ai,k) Scored value for alternative j, for the set of importance parameters.
𝑣𝑎𝑙𝑢𝑒 𝑜𝑓 𝑠𝑡𝑜𝑐𝑘 Total value of existing stock, compounded from base year, [monetary units]
𝑤𝑢,𝑦 Share that the technology represented in the total installed capacity of electricity generation technologies in year y for all installed capacity generation technologies u=1, 2, 3, ...,Y, in year y [%]
z=1,2,3,…N End use technology appliances [-]
𝛽𝑖,𝑠,𝑦𝐶𝑈/𝑃𝑈 Ratio of FE demand for carrier i, and service s, attributable to Core Urban (CU) and
PeriUrban (PU) populations in year y [-]
𝛽𝑖,𝑠,𝑦𝐶𝑈/𝑅 Ratio of FE demand for carrier i, and service s, attributable to CoreUrban(CU) and Rural (R)
populations in year y [%]
𝜂𝐷𝑆𝑇 Efficiency of PE to FE transformation of DST energy, in this case 𝜂𝐷𝑆𝑇= 100 [%]
𝜂𝑓𝑐ℎ𝑎𝑟𝑐𝑜𝑎𝑙 Transformation efficiency in biomass to charcoal production of technology f [%]
𝜂𝑔 Efficiency of electricity generation technology g [%]
𝜂𝑔𝑀 𝑒𝑙𝑒𝑐 𝑔𝑒𝑛 Efficiency of minigrid electricity generation technology g=1,2,3…,W [ktoe]
𝜂𝑔𝑆 𝑒𝑙𝑒𝑐 𝑔𝑒𝑛 Efficiency of standalone electricity generation technology g [ktoe]
𝜂𝑔𝑒𝑙𝑒𝑐 𝑔𝑒𝑛 Efficiency of electricity generation technology g [ktoe]
𝜂𝑟𝑒𝑓𝑖𝑛𝑒𝑟𝑦 The efficiency of the oil refinery [%]
𝜂𝑧,𝑖,𝑠𝑒𝑛𝑑 The end-use efficiency of appliance type z, energy carrier i, and FE service s in sector j and
subsector k [%]
𝜔𝑖,𝑠 Contribution to GVA of carrier i in the service s [%]
𝜔𝑘,𝑖,𝑠 Contribution to GVA of the sector for subsector k, carrier i and service s [%]
1
Introduction
1.1 Motivation
1.1.1 Role of Energy in development
Energy is essential to both the economic and human dimensions of development. It is a vital input to almost all economic activities. It also is necessary to support human development in meeting basic human needs for food and shelter. The provision of modern energy carriers to populations has numerous benefits including improved health, wellbeing and income-generating opportunities, as well as enabling access to employment, education, and social services (UN-Energy, 2007). The relationships, however, between energy and development are extremely complex, and energy is indispensable but not sufficient alone in bringing about the conditions for development (IEA, 2004).
A relationship exists between energy and economic growth as evidenced by Figure 1-1 representing economic activity as a function of electricity consumption (Stern, 2011). A general trend is seen in which countries with larger economic activity show higher energy consumptions. It is important, however, that energy is not viewed as the only ingredient to development, as no equation exists to calculate the energy requirements for a country simply given the GDP or vice-versa, and future economic developments and energy demand are often volatile (van Beeck, 2003).
Increased energy use does not necessarily coincide with increases in economic activity. The causal relationship in this energy consumption-growth nexus, has been the topic of extensive debate with no consensus on the direction of causality (Belke et al., 2010).
A decoupling of resource use, namely energy, and economic activity has been seen in developed countries especially following the first oil crises in the period from 1973 to 1985
2
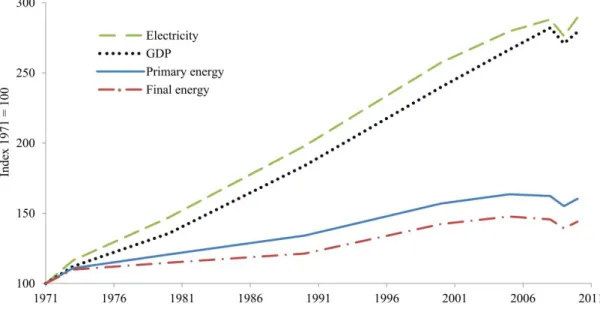
(de Bruyn and Opschoor, 1997; Goldemberg et al., 1987; IEA, 2012a; Kander, 2002). This decoupling of economic growth is seen in the continued rise of GDP in OECD countries, in Figure 1-2 from 1971 until present, and the slower rate of growth for the energy inputs that prior to the 1980s grew at a rate corresponding to that of economic growth (Stern, 2011).
Figure 1-1 - Electricity consumption and GDP/capita (UN, 2014a, 2013; US EIA, 2015a)
The decoupling of energy consumption and economic activity is often explained through four factors (Stern, 2011). The first factor is whether energy and other inputs (e.g. capital) are substitutes or are complements. Here two inputs are said to be substitutes if the quantity of one (e.g. energy) increases when the price of the other (e.g. capital increases). This is opposed to complements in which an increase in the price of one input results in a decrease of the other input (Apostolakis, 1990). Industries may respond to changes in energy prices by alternating between different production techniques that use different input ratios (Stern, 2004). The second factor is innovation and energy efficiency, also referred to as technology
changes, that allows for the use of less energy to produce the same amount of energy services
resulting in reduced energy demand. An example of this second factor is an increase in energy efficiency due to government standards and labelling efforts, that encourage a shift to (or development of) efficient appliances. Third are shifts in energy quality and the composition of energy inputs that allow for a reduction in the amount of energy required to produce a unit of output. Energy quality is defined in this sense as the economic usefulness per heat equivalent unit. Some higher quality fuels are more flexible than others meaning that they can be transformed into a larger number of carriers or provide for more final energy (FE) services that also have outputs with higher economic values (Grubler, 1999; Smil, 2005; Stern, 2011). An example of a shift in energy quality is the move from fuelwood to electricity - a higher quality FE carrier, supporting more activities and possibly more valuable activities.
3
Additionally, a shift from coal to higher quality crude oil as a primary energy (PE) input may result in reduced energy intensity (EI). Finally, the fourth factor, structural changes, or shifts in the composition of outputs from an economy affect both GDP and energy consumption. A common example is that of countries whose economies, in the early stages of development, shift from agriculture towards industry and manufacturing that are more resource intensive and extractive, typically representing increased energy demand. In the later stages of development a shift occurs away from industry towards light manufacturing and services that are less resource intensive at the national level and represent a decreased energy use per unit output (Bhattacharyya, 2011; Stern, 2011).
Figure 1-2 – GDP, PE supply, FE consumption and electricity consumption OECD countries (IEA, 2012a).
This decoupling of energy and economic activity has been observed in OECD countries that are at arguably higher stages of development than the majority of non-OECD developing countries. Despite this decoupling seen in countries at higher stages of development, small increases in energy consumption within developing countries can result in significant increases in quality of life (e.g. development of human welfare and economic growth) (IEA, 2004; REN21, 2005).
The energy sectors and the power sector in particular, in many developing countries are not adequately developed to support these economic and human developments, be it in terms of energy access levels, installed capacity, or overall levels of energy consumption (Castellano et al., 2015).
Increased access to modern energy has been linked to increased economic activity. This relationship of energy access and economic activity is seen in Figure 1-3 where nations that have rates of access to electricity of less than 80% show consistently lower GDP/capita than
4
states with higher access rates (Castellano et al., 2015).1 The measure of access to electricity gives a clearer indication of the level of energy poverty in a country than does the average consumption. In countries where a small portion of the population is responsible for the majority of the electricity consumption and the largest portion of the population consumes a marginal amount, the average can lead to an unclear indication of energy poverty.
Figure 1-3 - Electricity access and GDP/capita (UN, 2014a, 2013; World Bank, 2015a)
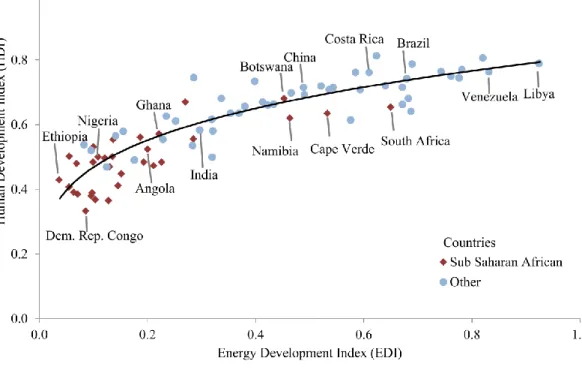
Efforts have also shown the relationships that exist between access to modern energy carriers and human development and welfare. One such relationship is seen between the Energy Development Index (EDI) from the International Energy Agency (IEA) and the Human Development Index (HDI) from the United Nations Development Programme (UNDP). The EDI is a composite indicator of energy development at the national level, and provides a measure of a country’s progress in transitioning to modern energy (IEA, 2012b).2 The HDI was developed
1 The outliers in this figure represent small nation states (e.g. Brunei) with significant natural resources
or island nation states. The Sub-Saharan Africa states with a GDP/capita of approximately $5,000/capita represent states in the region with significant natural resources (e.g. Angola, Botswana, Gabon, and South Africa) or small island states (e.g. Seychelles, Cape Verde and Mauritius).
2 The EDI indicator measures access at the household level with dimensions of both access to electricity
and per capita residential consumption of electricity. At the household level a measure of the share of modern fuels within the residential sector final energy consumption is also included. At the community level the indicator measures per-capita public sector electricity consumption as well as share of productive uses in total FE consumption.
5
in an effort to assess country development levels through dimensions beyond economic growth by including considerations of human development (UNDP, 2015a).3
The EDI and HDI indicators provide information at the national level as to the level of access to modern energy carriers and the level of human development respectively. Increases in a country’s progress in transitioning to modern energy are seen to correspond to increases in human development in Figure 1-4. The countries of sub-Saharan Africa (SSA) represent the majority of the countries with HDIs below 0.6. Small improvements in the EDI for countries below this level are seen to support rapid increases in the dimensions of human development as represented by the HDI. The improvements in HDI are seen to diminish with higher values of EDI.
Figure 1-4 – Energy Development Index and the Human Development Index for select countries
The relationship between access to modern energy and human development seen in Figure 1-4 is more evident when the actual linkages between energy and human welfare are examined.
The United Nations Millennium Development Goals (MDGs) set eight specific objectives for human welfare development worldwide. These goals integrate social, economic and environmental linkages to human development in all of its dimensions (UN, 2014b). While access to modern energy services was not explicitly referred to in the MDGs, it has been
3 The HDI is a composite measure of achievement in the dimensions of life expectancy, education and
gross national income per capita. The HDI is calculated as the geometric mean of indicators from these three dimensions.
6
recognized as an essential factor for their achievement. Modern energy access has been indirectly and directly linked to the successful achievement of the majority of the MDGs (DFID, 2002; REN21, 2005; UN-Energy, 2004; World Bank and UNDP, 2005).
Modern energy access is essential to efforts to overcome extreme poverty and hunger (MDG 1). Access to clean efficient modern energy carriers impacts the share of household income spent on cooking, lighting, and heating. Access to modern energy is an indispensable factor in the generation of employment, industrial activities, transportation, commercial services, and agricultural outputs (UN-Energy, 2004). Lighting allows for income generation activities to extend beyond daylight hours. Machinery provides for increased productivity in the productive sectors. Energy supports irrigation and post-harvest preservation (e.g. drying, cooling or freezing) activities that allow for increased food production and access to nutrition (DFID, 2002).
Energy access supports goals for universal primary education (MDG 2). Electric lighting in education facilities and housing accommodations aids in retaining teachers in rural areas and allows students to study beyond daylight hours. Electricity also supports the use of educational equipment (e.g. projectors and computers) (DFID, 2002). Children are often unable to attend school due to the essential chores of collecting fuelwood and water, and access to modern energy aids in removing this time pressure allowing for children study (UNDP, 2005; World Bank and UNDP, 2005).
Promotion of gender equality and women’s empowerment have also been linked to energy access (MDG 3). The energy services used by men and women differ in relation to the economic and social division of labor both, in the workplace and at home, and so the genders are affected differently when access to modern energy is achieved. Women spend a disproportionate amount of time daily gathering fuelwood, collecting water, and completing household chores without modern appliances. This time could be shifted to income producing or educational activities with the provision of modern energy access (Misana and Karlsson, 2001; World Bank and UNDP, 2005).
Public health and modern energy access are closely linked (MDG 4, 5 and 6). The impact of indoor air pollution on morbidity and premature deaths of women and children is an important public health issue within many developing countries (World Bank and UNDP, 2005). Women and children are disproportionately affected by the indoor air pollution caused by cooking on traditional stoves with solid cooking fuels in poorly ventilated spaces. The supply of clean grid based water, modern energy, and adequate cooking spaces is a factor that can potentially greatly reduce child mortality rates (van der Klaauw and Wang, 2003).
Health facilities require reliable illumination, refrigeration, and sterilization equipment, in addition to media equipment that aids medical services in remote areas. Effective health services play a role in stopping the incidence of major diseases, improving women’s mortality
7
rates at birth, and aiding in medical emergencies, and they are inextricably linked to modern energy services (World Bank and UNDP, 2005).
Communication mediums such as radio, television and mobile phones are essential in the sharing of public health information and specifically in the combat of fatal diseases (Aranda, 2015; BBC News, 2014; World Bank and UNDP, 2005).
The extraction, refinement, transportation, transformation and use of energy impact the environment on the local, national and global scale (MDG 7). This includes indoor air pollution, emission of air and water pollutants from electricity generation, land degradation from fuelwood gathering, and finally global impacts on climate from emissions of greenhouse gases (GHGs) (World Bank and UNDP, 2005).
Modern energy access is therefore an essential component for both economic and human development. However, ensuring that populations have adequate access to modern energy in order to support this development presents an energy planning (EP) problem that must be addressed by the relevant actors involved, with methodologies that are adequate to the context.
1.1.2 The national energy planning problem
EP is essential to the development of an energy trajectory that supports economic and human development. The EP activity is the process of designing a future energy framework at the local, regional, multi-national, or global energy scale (WADE et al., 2009). It is an effort to balance the energy demand and supply forecasted for a population over a specific time horizon (Kahen, 1998). EP consists of selecting the PE sources, transformation technologies, FE carriers and, demand side management (DSM) efforts required for energy generation, transmission, and distribution to meet society’s demand for FE services and fulfill national objectives.
The EP activity allows for the modeling of national demand and supply within possible future scenarios and the construction and comparison of multiple policy alternatives against, preferably, a “business as usual” future. The outputs from this process support governments in the development of policies or strategies to balance energy demand and supply while possibly also achieving objectives of economic development, environmental protection, energy security, or others.
Depending on the context, the energy system can be defined in a variety of ways. In general the energy system consists of an interconnected network of mechanisms that have the end goal of supplying society with the necessary energy services (Løken, 2007a). The system consists of all the technologies and activities required for the extraction and treatment of PE resources, the PE supply (PES), possible energy imports & exports, FE conversion technologies, required transmission and distribution systems, FE end-use conversion
8
technologies, the energy services provided, as well as the losses that result. The boundaries of the system vary depending on the application. As an example, global EP consists of considerations from the conglomerate of all national energy systems and their interconnections. Local EP in some communities may include considerations of FE energy but does not necessarily include PE considerations.
Interests in EP and energy policy development are rooted in the increased dependence of industrialized countries on fossil fuels that occurred in the 20th century. These interests peaked with disruptions in the PES due to the oil crises of the 1970s. These events encouraged governments to think more proactively about the security of their energy supply in a strategic way.
The traditional EP activity, carried out prior to the crises of the 1970s was historically entrusted to the national governments as the sole provider of commercial energy (i.e. state owned electrical utilities) working to some level with private firms (World Bank, 1993). The goal of traditional EP was to forecast demand and establish supply options according to economic and financial objectives. Demand was forecast in an aggregated form with no explicit acknowledgement of the energy services that this demand represented. The future energy system, therefore, became an extrapolation of energy demand trends and the rigid fitting of an energy supply system (de Oliveira and Girod, 1990). The EP activity was concentrated on supply-side configurations, mostly ignoring, possibly more economically viable and or environmentally attractive, demand side alternatives. Energy conservation and substitution of FE carriers was absent from EP (World Bank, 1993).
Following the oil crises, fossil fuel supplies were no longer considered guaranteed. This fact motivated countries to make structural changes in energy systems and planning efforts. This included diversification of PE supplies beyond oil as well as the incorporation of non-fossil fuel resources in the PES. It also influenced the start of end-use EP efforts with the realization of the energy services provided by energy, identification of possible substitutions of energy carriers within these energy services, and increases in energy efficiency. This end-use approach was radically different from the traditional approach. With the end-end-uses planning approach, energy was not the end product for society, and more complex energy demand considerations could be brought into the scope of EP. Lighting, heating, transport, etc. were the energy services demanded by society and in turn the appropriate factors to forecast demand (de Oliveira and Girod, 1990).
Interests in EP and energy policy development also shifted from the narrow focus on energy security, of the traditional approach, to a broader vision that also includes economic, environmental and additional concerns (Logan and James, 2009).
With worldwide efforts towards liberalization of the energy sector, the sovereignty over EP that the state historically had changed as new actors have entered the scene bringing a diverse set of concerns to the EP activity. According to Catrinu (2006) these actors include
9
companies involved in energy supply, municipal or regional administrative authorities, regulatory authorities, political groups, industrial and private energy consumers, environmental and other interest groups (e.g. NGOs and technology vendors). These actors consist of decision makers (DMs) and stakeholders that should be included in the EP activity (Webler and Tuler, 2006).
There have been increasing concerns about the implications of energy use on the global climate and the long term influences expected from the continued use of fossil fuels. There are also concerns about the relationship between security of PES and the large capacity expansions required globally, as well as the environmental ramifications that these changes will have in developed and developing countries.
As a result of these concerns, and the diverse set of actors, there has been a recent heightened interest in EP at all levels of government from the international and national down to the local municipal level (Covenant of Mayors, 2010; ECREEE, 2013a; European parliament, 2006). Energy and its importance within the framework to stem global climate change have influenced international EP efforts (Bruckner et al., 2014). At the regional level multi-national concerns are seen in the European Union (EU) with the Climate Action and Energy Package (Commission of the European communities, 2008). National interests have been seen in the EU with the development of the Energy End Use Efficiency and Energy Services Directive in addition to National Energy Efficiency Action Plans (European parliament, 2006). Activities are also present at the local municipality level (Covenant of Mayors, 2010).
How can EP objectives be best achieved, among the many future possible pathways, while ensuring that a society’s demand for FE services are met, in addition to addressing the concerns of the multiple stakeholders involved? This is the EP problem that must be addressed by the actors involved in the development of energy plans and policies at all levels (e.g. national, local, etc.).
1.1.3 Energy planning concerns in developing countries
Developing countries are poised to emerge into the international market. The economy of SSA has doubled since 2000, reaching $2.7 trillion dollars in 2013. This output, from the 940 million inhabitants of the continent, is not comparable with the $3.2 trillion dollars of the German economy that has a population of 82 million (IEA, 2014a).4 Continued economic growth will require access to reliable supplies of energy, and the governments of countries of SSA, as in other developing countries, will have to overcome multiple deficiencies in their