THIS REPORT WAS PREPARED BY JOSÉ PEDRO FERREIRA A MASTERS IN FINANCE STUDENT OF THE NOVA SCHOOL OF BUSINESS AND ECONOMICS, EXCLUSIVELY FOR ACADEMIC PURPOSES.THIS REPORT WAS SUPERVISED BY ROSÁRIO ANDRÉ WHO REVIEWED THE
M
ASTERS IN
F
INANCE
E
QUITY
R
ESEARCH
We recommend a holding position on EDP given our price target for FY15 of €3.14 per share, which reflects a potential downside of 1%, compared to the current market price.
EDP's generation segment is shifting towards liberalised activities due to the Iberian liberalisation process. In order to have an improvement of its margins, EDP needs a generation mix mainly composed by its hydro plants, which in 2015 should represent 50% of the company's Iberian installed capacity.
EDP's enterprise value continues to be a highly dependent on its regulated segments, which could be a risk. Iberian governments obsession to decrease their tariff deficit may put EDP on a weak position.
2015 should be the turning year for Brazilian's Pecém plant, since it should operate all year without any technical problems. Therefore, the coal plant should give a significant contribution to EDP Brasil's enterprise value.
EDP's top class dividend yield near 6%, continues to be one of the flagships of the company. However, the high dividend policy should have a negative impact on the company's deleveraging objective in 2017.
Company description
EDP-Energias de Portugal is the major Portuguese utilities company. The company's activity is focused in the generation, distribution and supply of energy. The group also has a strong presence in Brazil through EDP Brasil, in which the group has a 51% stake. EDP has renewable assets in its portfolio through EDP Renóvaveis, which is present in 12 countries.
EDP
C
OMPANY
R
EPORT
U
TILITIES 07JANUARY 2015S
TUDENT:
JOSÉP
EDROF
ERREIRA[email protected]
Shedding Light on EDP
Between deregulation and austerity measures
Recommendation: HOLD
Vs Previous Recommendation -
Price Target FY15: 3.14 €
Vs Previous Price Target -
Price (as of 6-Jan-14) 3.10 €
Reuters: EDP.LS, Bloomberg: EDP.PL
52-week range (€) 2.68-3.75
Market Cap (€m) 11350
Outstanding Shares (m) 3656.5
Source: Bloomberg
0% 50% 100% 150% 200%
01
-0
1-12
01
-0
4-12
01
-0
7-12
01
-1
0-12
01
-0
1-13
01
-0
4-13
01
-0
7-13
01
-1
0-13
01
-0
1-14
01
-0
4-14
01
-0
7-14
01
-1
0-14
EDP PSI 20
Source: Bloomberg at 31/12/2014
(Values in € millions) 2013 2014E 2015F
Revenues 5551 5266 5322
EBITDA 3617 3608 3578
Net Profit 1194 1041 1057
EPS 0.28 0.25 0.26
P/E(x) 12.4 11.0 10.4
EV/EBITDA (x) 8.51 8.63 8.65
DPS 0.185 0.185 0.185
Dividend Yield 6.9% 5.9% 5.9%
EDP-ENERGIASDEPORTUGAL COMPANY REPORT
Table of Contents
INVESTMENT CASE ...3
COMPANY OVERVIEW ...4
SHAREHOLDER STRUCTURE ... 8
VALUATION ...9
ELECTRICITY MARKET ...12
MARKET OVERVIEW ... 12
TARIFF DEFICIT IN IBERIA ... 13
ELECTRICITY GENERATION ...15
GLOBAL OVERVIEW ... 15
REGULATED GENERATION... 16
LIBERALISED GENERATION ... 18
ELECTRICITY DISTRIBUTION ...22
ELECTRICITY SUPPLY ...24
GAS ...26
EDP BRASIL ...28
EDPR ...32
SCENARIO ANALYSIS ...32
FINANCIAL STATEMENTS ...33
EDP-ENERGIASDEPORTUGAL COMPANY REPORT
Investment Case
We initiate our coverage on EDP with a price target of €3.14. EDP is the main player in the Portuguese utilities sector and one of the biggest Iberian utilities companies. We estimate that over the 2015-2017 period, EDP's EBITDA will grow at CAGR of 0.7%. In Iberia, EBITDA growth will come mainly from the liberalised generation segment due to its hydro capacity increase, which will be based on the addition of new plants and on the integration of former CMEC ones (figure 2). In Brazil, we expect growth to come from the generation and supply segments. Still in Brazil, it is important to refer that the Pecém coal plant is already operating after a problem on the plant generator, which stopped its production during part of 2014. Therefore, if no further problem arises, we expect Pecém to have a significant contribution on EDPB's enterprise value.
On EDP's EV, we expect Iberian regulated segments to rule with a 51% share on total EV, while EDPB and EDPR weight on the total EV should be 22% and 10%, respectively. Liberalised activities in Iberia have a 18% weight in the company's EV. So, EDP's value will be mainly driven by regulated activities, however the Iberian liberalisation process will give more importance to liberalised activities. EDP's strength might be also its weakness, since the company's EV could be affected by adverse regulation both in Iberia and Brazil.
Regarding EDP's financial position, we expected an improve with the Net Debt/EBITDA of 3.5x in 2017E, including regulatory receivables, and a dividend yield of 6%. The Net Debt/EBITDA is close to the company's 2017 target of 3.0x, however in our view, it might not be compatible with the company's current dividend policy of €0.185 dividend per share floor. In fact, EDP's dividend yield is the top of the class when compared with the one from its peers or its average, as figure 2 demonstrates.
Figure 3 - Multiples Comparison
EDF Endesa EOAN Gas Natural GDF Iberdrola RWE Average EDP
FY14 10,8 11,2 15,7 14,7 15,4 15,9 11,6 13,6 12,4
FY15 10,9 15,7 15,4 14,0 14,1 15,1 11,8 13,8 10,9
FY16 10,9 14,3 15,5 12,8 13,3 14,1 12,4 13,3 10,4
FY14 5,6% 4,7% 3,6% 4,4% 5,2% 4,9% 3,9% 4,6% 5,9%
FY15 5,6% 5,2% 3,6% 4,6% 5,3% 4,9% 3,9% 4,7% 5,9%
FY16 5,7% 5,5% 3,7% 5,0% 5,5% 5,1% 4,0% 4,9% 5,9%
P/ E
Dividend Yield
Source: Analyst Estimates and Bloomberg Consensus
Figure 1 - EDP Stock Market Performance in 2014(%)
122% 0% 50% 100% 150% Ja n-14 F eb -1 4 M a r-1 4 A p r-14 M ay -1 4 Ju n-14 Ju l-14 A u g-14 S e p-14 O c t-14 N o v-14 D e c-14
Source: Bloomberg, at 31/12/2014
Figure 2 - Installed Capacity in Iberia: Regulated vs. Liberalised (%)
53% 49% 48%
44% 38% 36%
30% 29%
47% 51% 52% 56% 62% 64% 70% 71%
2 0 1 0 2 0 1 1 2 0 1 2 2 0 1 3 2 0 1 4 E 2 0 1 5 E 2 0 1 6 E 2 0 1 7 E Regulated Liberalised
EDP-ENERGIASDEPORTUGAL COMPANY REPORT
Company Overview
EDP is a Portuguese vertically integrated utilities company founded in 1976, after the nationalization and merger of 13 utilities companies. The company's main mission was to provide electricity to the Portuguese territory, improving and expanding its existing distribution network. After restructuring the company, the Portuguese government created in 1994 the EDP group. In June of 1997, the first of eight privatisation phases took place, with the company's IPO taking place in the Lisbon Stock Exchange. This operation consisted on the transfer of 29.99% of EDP's share capital. Since then other seven phases occurred, with the last being the sale of 21.35% of EDP's share capital by Parpública – Participações Públicas (SGPS), a state owned company, to China Three Gorges (CTG). Listed since 1997 in the Lisbon Stock Exchange, EDP currently has a market capitalization of €11.4 Bn1. It is the main company in the Portuguese utilities sector and one of the top players in the Iberian market. The group operates in three out of four activities that belong to the electricity value chain(figure 5). In Iberia the electricity generation could operate under the regulated framework, through special regime producers, or under the liberalised environment. On the transmission phase, electricity is transported from the generating plant to the distribution grid. This is the only phase of the value chain where EDP is not present. The third phase is the distribution, which is responsible by carrying electricity from the transmission system to the consumer. The fourth stage of the value chain is the supply that makes the bridge between the distributor and the consumer. EDP's main competitors are the Spanish utility companies, Endesa, Iberdrola and Gas Natural since all operate in the same three activities of the Iberian market that EDP operates.
EDP group has a global footprint since it operates in 12 different countries. The parent company operates in Portugal and Spain. EDP Brasil operates in Brazil, while the renewable subsidiary operates in the 3 previously mentioned countries plus Belgium, Canada, France, Italy, Poland, Romania, UK and US. This geographical diversity could be a positive point for the group since it has exposure to markets in different growth stages. According to IEA, European Union's electricity demand is expected to experience an annual growth rate between 2012 and 2040 of 0.6%, which is the growth rate present on figure 6. In fact, OECD countries are expected to grow only 0.8%. On the other hand, non-OECD countries are expected to grow 3%, with Brazil expected to grow 2.6%. EDP's current portfolio allows the group to have a strong presence in developed
1 Source: Bloomberg at 06/01/2015
Figure 4 - EDP Peers (€Mn)
Pe ers Ma rke t Cap
Endes a 16.5 Bn
Iberdrola 34.7 Bn
Gas N atural 20.0 Bn
EDF 40.9 Bn
GD F Suez 45.0 Bn
EON 26.6 Bn
RWE 14.8 Bn
Source: Bloomberg, at 06/01/2015
Figure 6 - Electricity Demand Growth per Region (%)
Region CAGR 2012-2040 OECD 0.8%
Americas 0.9%
Europe 0.7%
European Union 0.6%
United States 0.8%
Non-OECD 3.0%
LatAm 2.5%
Brazil 2.6%
W orld 2.1%
Source: IEA
Figure 5 - EDP Peers 1.Generation EDP is present under
both liberalised and regulated environemnt
2.Transmission EDP is not present
3.Distribution EDP operates under a
regulated framework
4.Supply EDP operates under
EDP-ENERGIASDEPORTUGAL COMPANY REPORT
markets, which are less volatile and, at the same time, be present on emerging ones, which should experience a higher growth rate that generally is accompanied by higher volatility. All in all, EDP is trying to diversify its revenues by geography, which could be an advantage if no instability occurs on the emerging countries the group is exposed to. Otherwise it could be a problem for the group.
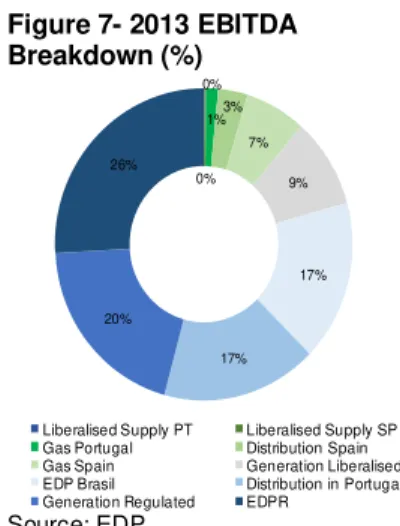
EDP operations are currently divided in Generation, Distribution, Supply, Gas, Brasil and Renewables business segments. Figure 7 shows the 2013's EBITDA breakdown. It is easy to understand the importance of EDPR since it is the biggest segment of the group, followed by the regulated generation with 20%. In fact, 86% of EDP's EBITDA in 2013 came from regulated activities, excluding EDPR and including EDP Brasil. The scenario of dominance of regulated activities has been decreasing since 2012 (figure 8). Over the following years is expected that liberalised activities will increase its weight on EDP's revenues due to the deregulation in Iberia.
In Iberia, EDP operates in the generation business through its subsidiaries, EDP Produção in Portugal and Hidroeléctrica del Cantábrico (HC) in Spain. Both companies operate in the liberalised and regulated generation. The regulated unit of electricity generation is composed by the PPA/CMEC (CMEC-costs with the maintenance of contractual equilibrium) and by the special regime contracts. The CMEC system was approved by the European Commission in 2004 and it preserves the NPV of the PPAs, a real pre-tax ROA of 8.5%. This regime started in 2007 and will finish in 2027, notwithstanding its conditions will be reviewed in 2017.
Currently, EDP has an installed capacity (excluding wind) in Iberia of 12,583 MW, however this value will increase by 1,405 MW until 2017 to 13,988 MW, figure 9. Since 2010, the weight of the regulated segment has been decreasing in the generation business (figure 3). In fact this trend will continue, as the CMECs contracts finish, the hydro installed capacity passes automatically to the liberalised segment. Moreover, EDP can only increase the installed capacity on the special regime, never on the CMEC side since it was not foreseen on the memorandum. This change will have a negative impact on EDP's EBITDA because the EBITDA margins in the liberalised generation are lower than the ones obtained on the regulated market. Figure 10 demonstrates that in 2013 the CMEC's margins were 88%, against 63% registered on the liberalised business. Figure 33 shows the hydro plants that will pass to the liberalised side.
EDP Distribuição and HC Distribución are responsible for the distribution of electricity in Portugal and Spain, respectively. Electricity distribution is a
Figure 7- 2013 EBITDA Breakdown (%) 0% 0% 1%3% 7% 9% 17% 17% 20% 26%
Liberalised Supply PT Liberalised Supply SP Gas Portugal Distribution Spain Gas Spain Generation Liberalised EDP Brasil Distribution in Portugal Generation Regulated EDPR
Source: EDP
Figure 8 - EBITDA Breakdown by Source (excluding EDPR) (%)
87% 87% 88% 86% 82% 78% 75% 74% 13% 13% 12% 14% 18% 22% 25% 26%
2 0 1 0 2 0 1 1 2 0 1 2 2 0 1 3 2 0 1 4 E 2 0 1 5 E 2 0 1 6 E 2 0 1 7 E Regulated Liberalised
Source: EDP and Analyst Estimates
Figure 9 - Installed Capacity in Iberia (MW) 13818 13555 13808 12764 12583 13254 13862 13988 20 10 20 11 20 12 20 13 20 14 E 20 15 E 20 16 E 20 17 E
Source: EDP and Analyst Estimates
Figure 10 - CMEC Vs Liberalised EBITDA Margins (%)
85% 87% 83% 88% 86% 86% 87% 87%
75% 75%
59% 63% 64% 66% 66% 66%
20 10 20 11 20 12 20 13 20 14 E 20 15 E 20 16 E 20 17 E
EDP-ENERGIASDEPORTUGAL COMPANY REPORT
regulated business, in which the remuneration is established by a Return on Regulated Asset Base (RoRAB) defined by the country's regulator. The Portuguese regulator, ERSE, established a RoRAB of 9.5% for 2014 and 6.75% for the period between 2015 and 2017. The Spanish regulator, CNE, established on the RDL 9/2013 that the RoRAB for the period 2014-2020 should be equivalent to a premium of 200 basis points over the 10 year Spanish bond yield. According to EDP, this scheme yields a RoRAB of 6.5%. The Royal Decree Law (RDL) 9/2013 was enforced on July 14th 2013 and from that date until the end of 2013, it paid a spread of 100 basis points. The value of the yield was calculated according to an average of the 10 year Spanish bond yield on the secondary market during the three months preceding the date on which the royal decree was enforced.
In Portugal, EDP currently has 225 thousand kilometres of distribution grid and in 2013 it distributed 43,858 GWh of electricity. In Spain, the group has 23 thousand kilometres of distribution grid and in 2013 it distributed 9,147 GWh of electricity. The distribution segment is a mature business, so it is not expected any further expansion investment. Regarding its gross profit, it has been decreasing in both countries over the past years (figure 11). In Portugal, the 2012 gross profit was an exception since the real RoRAB for the year was 10.05%, while in 2013 it was 8.56%. Unlike to the current Portuguese remuneration rate that is linked to the 10 year Portuguese bond yield, the 2012-2014 rate was linked to the Portuguese Republic 5-year CDS, which suffered a major decline in 2013. In the future, it is expected a smaller decrease and, then, a stabilization of both gross profits since there will be no room for further controlled costs' efficiency improvement, in our view. In fact, ERSE reduced the efficiency factor of EDP Distribuição from 3.5%, in the 2012-2014 period, to 2.5% for the 2015-2017 period since the company is close to the efficiency levels targeted by the regulator. In figure 12, it is possible to observe the controlled costs decrease trend.
In the Iberian electricity supply business, EDP also has the liberalised and the regulated segments, though the last one is predicted to finish its activity in 2015. As it was required by the European Directive, since January 1 of 2007, the role of the last recourse supplier has been undertaken by EDP - Serviço Universal. This company has the duty of selling electricity at the regulated tariff price to all clients that demand such service. The last recourse supplier must manage the different forms of contracts in order to acquire energy at the lowestcost. In 2016 the Portuguese supply segment will be completely liberalised.
The liberalised segment is controlled by EDP Comercial in Portugal, while in Spain it is ran by HC Energía. With the shift to the liberalised market, the electricity supply segment is becoming less dependent on the regulated
Figure 12 - EDP Distribuição OPEX (€Mn)
450
434 434
416
2010 2011 2012 2013
Source: EDP
Figure 11 - Gross Profit of Distribution in Iberia (€Mn)
1343 1297 1367 1302
184 179 164 161
2010 2011 2012 2013 Portugal Spain
EDP-ENERGIASDEPORTUGAL COMPANY REPORT
electricity tariff. Currently, EDP has a market share of 45% in Portugal and it is expected to sell almost 15,500 GWh in 2014. During the liberalization process, EDP's market share in this segment has been decreasing, as well as gross margins. In the future it is expected a stabilization of the market share and a reduction of the current's gross margin. In Spain, EDP has a current market share of 9% and it is expected to sell almost 17,000 GWh in 2014. Unlike Portugal, the Spanish supply market has been liberalised since 1997, so the company's gross margins have already stabilize and are not expected to suffer major changes in the future. In figure 13, it is possible to observe a higher volatility on the Portuguese business in comparison to the Spanish one, which is justified by its lower development stage. Nevertheless, it should be mentioned that both Iberian countries suffered an economic recession between 2011-2013 (figure 14), which negatively affected electricity demand and, consequently, its supply.
In the gas segment, EDP operates as a distributor and supplier of gas in the Iberian market, under a regulated and liberalised framework. The supply activity is recent in Portugal since it only started in 2009. In 2013, the group sold in Portugal 5,315 GWh of gas and had a market share of 15%. In the same year, in Spain, EDP sold in 28,553 GWh of gas and had a market share of 5%. On the distribution business, EDP had in 2013, 4,484 kilometres of grid in Portugal and 9,996 kilometres of grid in Spain. On the same year, EDP distributed 6,938 GWh of gas in Portugal and 51,535 GWh in Spain.
EDP is experiencing businesses in different maturity stages. The supply business in Portugal is a recent one that has been growing even with the fierce competition of Galp Energia. In Spain due to its small structure it has been losing market share, in fact since 2011 EDP dropped 6% from 11% to 5% in 2013. This negative trend has two main reasons: first, as it happened with electricity supply, the economic recession in Iberia led to lower gas demand, consequently the supply business was also affected. The second reason was EDP shifting its gas sales to the retail market where margins are more attractive and the volumes are lower than on the industrial segment. Regarding the distribution business, it is a mature business in both countries, like the electricity distribution one, so further expansion investment is not expected.
EDP Renováveis (EDPR) is the company of the EDP group responsible for the renewable energy segment. Listed in the Lisbon Stock Exchange since June 2008, with an initial price of €8 per share. EDPR is a reference company in the renewable's industry, more specifically on wind sector, where it is one of the main producers. Currently, EDPR has two qualified stakes, its main shareholder EDP that owns 77.5%, and MFS - Investment Management that owns 3.1%. The
Figure 16 - EDPR EBITDA (€Mn)
713 801
938 947
2010 2011 2012 2013
CAGR 10-13: 10%
Source: EDPR
Figure 14 GDP evolution in Iberia (%) -4% -3% -2% -1% 0% 1%
2011 2012 2013
Portugal Spain
Source: IMF
Figure 13 - Supply EBITDA (€Mn) -8 25 3 18 37 6
2011 2012 2013
Portugal Spain
Source: EDP
Figure 15 - EDPR vs PSI 20 vs MSCI World vs MSCI Energy sector, since its IPO (%)
0% 50% 100% 150% J u n -0 8 O c t-0 8 F e b -0 9 J u n -0 9 O c t-0 9 F e b -1 0 J u n -1 0 O c t-1 0 F e b -1 1 J u n -1 1 O c t-1 1 F e b -1 2 J u n -1 2 O c t-1 2 F e b -1 3 J u n -1 3 O c t-1 3 F e b -1 4 J u n -1 4 O c t-1 4
MSCI World EDPR
MSCI World Energy PSI 20
EDP-ENERGIASDEPORTUGAL COMPANY REPORT
remainder 19.4% corresponds to the company's free float. In figure 15, it is possible to observe EDPR's share price performance against the PSI 20, the MSCI world and the energy sector index, since EDPR's IPO. EDPR had a better performance than the PSI 20 and the MSCI world energy sector, but worse than the MSCI index. EDPR currently operates in 12 countries, in 2 different continents. The company has an installed capacity of 8,565 MW and in 2013 its EBITDA reached €947 Mn. EDPR is a high growth company (figure 16), its EBITDA has been growing at a CAGR of 10% from 2010 to 2013.
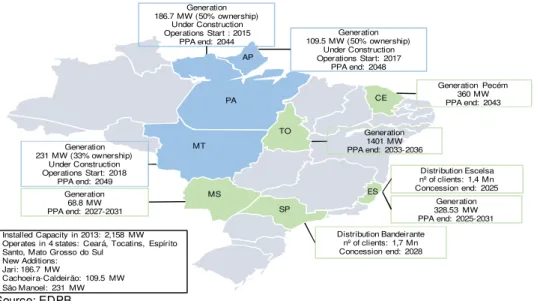
EDP started its operations in Brazil in 1996 with a minority stake acquisition in the company Cerj. In 2000, EDP founded its Brazilian subsidiary, EDP Brasil, and in 2005 it was listed in the São Paulo Stock Exchange. Currently, EDP owns 51% of EDP Brasil that has a market capitalisation of $R4.273 Bn2.
EDP Brasil operates in the electricity generation, distribution and supply businesses. The distribution segment is regulated, like the ones in Iberia, and it only operates in the states of Espírito Santo and São Paulo through Escelsa and Bandeirante, respectively. EDP Brasil will increase its current installed capacity of 2,157 MW in 2013 to 2,685 MW in 2018, with three new hydro plants-Jari, Cachoeira-Caldeirão and São Manoel. In figure 18, it is possible to observe EDPB's EBITDA evolution, which has been growing at a CAGR of 3% in the 2010-2013 period. The 2012 EBITDA drop came as a result of, the delay of the coal plant (Pecém) and regulatory negative impacts on the distribution business. All in all, EDP Brasil offers to EDP the exposure to a growing economy.
Shareholder Structure
EDP share capital has a total of 3,656,537,715 shares with a nominal value of €1 each. As it is possible to observe in figure 19, CTG is the main shareholder with a 21.35% stake followed by the Capital Group Companies with 10.13%. This US fund with around one trillion of USD under management, notified EDP on March 7 2014 that it held a qualifying shareholder position in EDP. The biggest Portuguese shareholder is Millennium BCP pension fund with a stake of 2.44%. Since its incorporation in 1994, EDP went through eight privatization phases, with the last being the sale of Parpública' stake of 21.35% to CTG. The Chinese company acquired the 780,633,782 shares at €3.45 per share, which implied an equity valuation of €12.614 Bn. On May 11 2012, date in which CTG and Parpública notified EDP about the operation, the share price close the day at €1.85, which implied an equity valuation of €6.758 Bn. So, CTG offer price implied a premium of 87% to market price. Since the CTG acquisition in May
2 Source: Bloomberg at 31/12/2014.
Figure 19 - EDP' Shareholder Structure
CTG 21%
Capital Group 10%
Oppidum 7%
SARL 4%
Grupo BCP 2%
Sonatrach 2%
Qatar 2%
José de Mello 2%
Blackrock 2%
Treasury Stock 1%
Free Float 46%
Total 100%
Source: EDP
Figure 17 - EDPB vs Ibovespa, since its IPO (%)
0% 50% 100% 150% 200% 250% A u g -0 5 J u n -0 6 A p r-0 7 F e b -0 8 D e c -0 8 O c t-0 9 A u g -1 0 J u n -1 1 A p r-1 2 F e b -1 3 D e c -1 3 O c t-1 4
EDP Brasil Ibovespa
Source: Bloomberg, at 31/12/2014
Figure 18 - EDP Brasil's EBITDA in 2013 (R$Mn)
1509 1538
1421 1656
2010 2011 2012 2013
CAGR 10-13: 3%
EDP-ENERGIASDEPORTUGAL COMPANY REPORT
2012, EDP performance has beaten all indexes, European, worldwide and industry specific ones (figure 20). In fact, EDP's performance is 45% above the MSCI index, which demonstrates that the CTG partnership was positively viewed by the market.
CTG is China’s largest clean energy group with an ambitious renewable energy expansion plan worldwide. In 2010, CTG had 25.4 GW of installed capacity and it plans to have 90 GW in 2020, which 70 GW are in hydro plants and 20GW in wind. The profitable offer allied with a strategic partnership with CTG was a decisive factor that separated this offer from the rest. EDP and CTG established a strategic partnership based on three main pillars: i) CTG commitment to invest €2 Bn in the acquisition of minority stakes and co-investment in renewable projects; (ii) a Chinese financial institution commitment to provide a €2 Bn credit facility to EDP for a maturity up to 20 years; (iii) EDP and CTG will jointly develop new growth opportunities worldwide. The first pillar of the agreement already allowed EDP to use half of the €2 Bn in its first wind block in Portugal, as well as in wind and hydro projects in Brazil. This agreement had an important objective regarding EDP's financial position, EDP's net debt/EBITDA should be 3.0x by 2015E. However, this target was already changed to 3.0x of net debt/EBITDA in 2017E, net debt includes the regulatory receivables.
CTG is fully supported by the Chinese Government, having a credit rating of A -by S&P, way better than EDP's BB+. This fact should allow EDP to have lower finance costs when using CTG's credit line to finance new projects, however as this fact did not change EDP's credit rating it was not considered on the WACC calculation for valuation purposes. Through this partnership, EDP should be able to enter in new markets with the financial support of CTG, while CTG will get exposure to other markets besides China.
Valuation
In order to value EDP, we applied the sum-of-the-parts (SOP) methodology, in which we evaluate each segment individually. We separate EDP according to the following segments: Regulated Generation, Liberalised Generation, Electricity Distribution in Portugal and in Spain, Electricity Supply in Portugal and Spain, Gas in Portugal and in Spain (liberalised and regulated units), Generation and Supply in Brazil, Electricity Distribution in Brazil and EDPR. We evaluate all the segments, with the exception of EDPR, through a DCF-WACC approach. We evaluated EDPR at market values. Concerning the non-operating items and provisions, we used their book value. Regarding EDP's stakes in BCP and in REN, we used their market values, as we believe that the market prices are the ones that better reflect the current firm valuation. Our DCF model forecasts the
Figure 20 - EDP Performance since CTG's Partnership (%)
0% 50% 100% 150% 200%
M
a
y
-1
2
A
u
g
-1
2
N
o
v
-1
2
F
e
b
-1
3
M
a
y
-1
3
A
u
g
-1
3
N
o
v
-1
3
F
e
b
-1
4
M
a
y
-1
4
A
u
g
-1
4
N
o
v
-1
4
EDP MSCI
SX6P PSI 20
MSCI Energy
+45%
EDP-ENERGIASDEPORTUGAL COMPANY REPORT
company's performance for the next three years, at current prices, with the values in Euros. In the Brazilian segments we estimated the cash flows in the local currency, then convert them to Euros through the EUR-BRL rates in figure 21, in order to discount and sum them to the enterprise value.
As it was previously mentioned, we evaluate EDP by its core areas in order to better evaluate the company. As a result, we also had to compute different WACCs, since each unit as its own implicit risk. So, we computed five costs of capital for the different areas.
Firstly, we calculated the cost of equity through the capital asset pricing model (CAPM) approach. We started by estimating the risk-free rate, we chose 10 year bonds yields with a high credit rating. We used the yield of the 10 year US bond as risk free for all operations, and then convert it into Euros. As far as the market risk premium is concerned, we assumed a rate of 5.8%3, according to empirical research. Regarding the industry beta, we choose different groups of comparable companies according to each segment (figure 22). So, we selected a group of companies for the regulated, liberalised businesses and for the Brazilian activities. After, we computed an average of the unlevered betas of each comparables group, which we levered with EDP's target debt-to-equity ratio at market values. All used levered betas result from individual regressions between each company's excess returns and a well-diversified market portfolio excess returns, the MSCI World. As the tax rates are not the same in Portugal and Spain, we had to calculate a different cost of capital for the business' operating each country. Secondly, we computed EDP's cost of debt. Instead of using the CAPM methodology, as we did with the cost of equity, we used the approach that has in consideration the perceived risk taken by investors. In other words, we used a formula that takes into consideration the company's credit rating and not its target capital structure. In order to calculate the cost of debt, we used the referred risk-free rate plus a credit spread measured by the average of the last 24 months of EDP's 10 year CDS quoted in Euros. Figure 23 has EDP's credit rating in the three credit agencies. According to Moody's, a Ba1 company has a probability of default of 1.37% and a recovery rate of 62.20%4.
Thirdly, the target capital structure implied in the WACC was obtained through EDP's guidance. As it was mentioned, EDP plans to obtain a 3.0x net debt/ EBITDA in 2017, including regulatory receivables. Besides this objective, EDP has a strict dividend policy that is based on a dividend per share floor of €0.185, which in our view is not possible to achieve with the debt target. In the end, we
3 Santa-Clara, Pedro; Yan, Shu (2004). Jump and Volatility Risk and Risk Premia: A New Model and Lessons from S&P 500 Options.
Massachusetts: NBER.
4 Sharon Ou (2011). Special Comment: Corporate Default and Recovery Rates, 1920-2010. New York: Moody's Investors Services. All.
Figure 23 - EDP's Credit Rating
Agency Rat ing
S& P BB+
Moody's Ba1
Fit ch
BBB-Source: EDP
Figure 21 - EUR-BRL Exchange Rate, Forecasts through the International Fisher Effect
Inflation 2014E 2015E 2016E 2017E
European
Union 0.5% 0.9% 1.2% 1.4% Brazil 6.3% 5.9% 5.6% 5.0%
EUR-BRL 3.03 3.18 3.32 3.44
Sources: IMF
Figure 22 - EDP's Peers
Liberalised
Comparables Country Beta Levered D/E t Beta Unlevered
Endesa Spain 1,00 58% 30% 0,71 Gas Natural Spain 1,12 65% 30% 0,77 Iberdrola Spain 1,14 67% 30% 0,78 EDF France 1,11 71% 33% 0,76 EON Germany 1,17 48% 30% 0,87 GDF Suez France 1,14 59% 33% 0,82 RWE Germany 1,14 65% 30% 0,78 Average of the Industry 0,78 Beta Levered 1,61
Regulated
Comparables Country Beta Levered D/E t Beta Unlevered
Enagas Spain 0,97 62% 30% 0,67 REE Spain 1,00 58% 30% 0,71 REN Portugal 0,60 194% 23% 0,24 Average of the Industry 0,54 Beta Levered 1,11
EDP Brazil
Comparables Country Beta Levered D/E t Beta Unlevered
Centrais Electricas Brazil Brazil 1,08 337% 25% 0,31 CIA Paranaense Brazil 0,86 38% 25% 0,67 CIA Energética MG Brazil 0,82 56% 25% 0,57 CPFL Energia Brazil 0,73 78% 25% 0,46 Tractebel Energia Brazil 0,86 12% 25% 0,78 Average of the Industry 0,56 Beta Levered 1,15
EDP-ENERGIASDEPORTUGAL COMPANY REPORT
chose the dividend policy since one of the company's flagships is its high dividend yield. Moreover, EDP's established this dividend policy in 2011 and maintained it, even with the 3.0x net debt/EBITDA objective in 2015 planned on the strategic agreement (figure 24). Nevertheless, we reached a net debt/EBITDA of 3.5x in 2017, close to its previous objective that will allow a deleveraging of the group.
Figure 25 - WACC Assumptions (all values are in Euros)
Brazil Liberalised Activities Regulated Activities Liberalised Activities Regulated Activities Brazil Activities Cost of Debt
Risk-f ree Rate 2,13% 2,13% 2,13% 2,13% 2,13%
Spread 2,96% 2,96% 2,96% 2,96% 2,96%
PD 1,37% 1,37% 1,37% 1,37% 1,37%
RR 62,2% 62,2% 62,2% 62,2% 62,2%
Cost of Debt 4,51% 4,51% 4,51% 4,51% 4,51%
Cost of equity
Risk-f ree Rate 2,13% 2,13% 2,13% 2,13% 2,13%
MRP 5,80% 5,80% 5,80% 5,80% 5,80%
Sector Beta 1,61 1,11 1,61 1,11 1,15
Cost of equity 11,45% 8,56% 11,45% 8,56% 8,79%
WACC
Cost of Equity 11,45% 8,56% 11,45% 8,56% 8,79% Cost of Debt 4,51% 4,51% 4,51% 4,51% 4,51%
Corporate Tax 23% 23% 30% 30% 25%
Target D/(D+E) 51% 51% 51% 51% 51%
Target E/(D+E) 49% 49% 49% 49% 49%
WACC 7,36% 5,96% 7,20% 5,79% 6,02%
Portugal Spain
Source: Analyst Estimates
On our sum-of-the parts, we included the energy tax applied to all Portuguese companies in the energy sector. The contribution tax figures in the 2015's Portuguese State Budget document, as it did in 2014. This tax is a rate of 0.85% that focuses on the company's fixed assets. It is expected to have a negative impact of €78 Mn in our valuation.
We computed the holding costs, which are the adjustments that occur between the group' segments. Regarding the income statement, we computed an adjustment rate, which is an average of the past four years, implied in the consolidated income statement. We used this method since the rates were stable in the past, so we estimate that they should continue this way in the future. Regarding the balance sheet, we adequate the holding structure to the target consolidated one, which we deem fair and considered it on the WACC computations. On the valuation, we used the same approach of the core business areas, however we used a specific cost of capital. As the holding is not a regulated nor liberalized segment, but rather the group as a whole, we decided to use EDP's beta against the MSCI world. All in all, our valuation points for a value of €3.14 per share, already considering two scenarios, leading to a Hold
recommendation.
Figure 24- EDP's Dividend per share (€)
15,5 17
18,5 18,5 18,5 18,5
2009 2010 2011 2012 2013 2014
EDP-ENERGIASDEPORTUGAL COMPANY REPORT
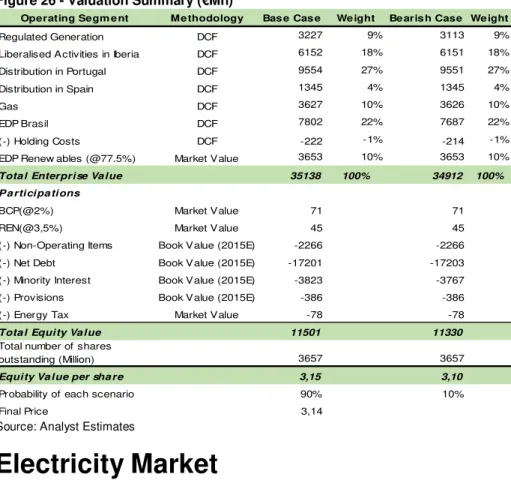
Figure 26 - Valuation Summary (€Mn)
Operating Segm e nt Me thodology Bas e Cas e We ight Be aris h Case We ight
Regulated Generation DCF 3227 9% 3113 9%
Liberalised Activities in Iberia DCF 6152 18% 6151 18%
Distribution in Portugal DCF 9554 27% 9551 27%
Distribution in Spain DCF 1345 4% 1345 4%
Gas DCF 3627 10% 3626 10%
EDP Brasil DCF 7802 22% 7687 22%
(-) Holding Costs DCF -222 -1% -214 -1%
EDP Renew ables (@77.5%) Market Value 3653 10% 3653 10% Total Enterprise Value 35138 100% 34912 100% Participations
BCP(@2%) Market Value 71 71
REN(@3,5%) Market Value 45 45
(-) Non-Operating Items Book Value (2015E) -2266 -2266 (-) Net Debt Book Value (2015E) -17201 -17203 (-) Minority Interest Book Value (2015E) -3823 -3767 (-) Provisions Book Value (2015E) -386 -386
(-) Energy Tax Market Value -78 -78
Total Equity Value 11501 11330
Total number of shares
outstanding (Million) 3657 3657
Equity Value per share 3,15 3,10
Probability of each scenario 90% 10%
Final Price 3,14
Source: Analyst Estimates
Electricity Market
Market Overview
Operating since 2007, the Iberian Electricity Market (MIBEL) is a jointly initiative of the Portuguese and Spanish Governments to have an integrated Iberian electricity market. The agreement between the two countries for the creation of MIBEL was achieved after the European Union directives issuances for the liberalisation of electricity markets. Under MIBEL it became possible for any consumer to acquire electricity under a free competition regime, from any producer or retail in Iberia. MIBEL structure is based on only one market operator OMI (Operador de Mercado Ibérico). OMI is divided in two divisions, OMEL, the
Spanish division, which is responsible for the management of the daily and intraday market, and OMIP, the Portuguese division, which is responsible for the management of the derivatives market.
As it was mentioned, MIBEL's objective is to have an unique price during the entire year. However, there are some periods of the day where it is not possible to have a single price since the grid does not support the energy flows between the two countries. During these periods, there is a market splitting, in which MIBEL is separated in two markets, a Portuguese and a Spanish one. This implies a specific price in each market, and the difference of them is called a spread. In figure 27, it is possible to observe two interesting aspects. First, the
Figure 27 - Spread (PT-SP) €/MWh: 2011 - 2014 (October)
-4 -2 0 2 4
0
1
-0
1
-2
0
1
1
0
1
-0
7
-2
0
1
1
0
1
-0
1
-2
0
1
2
0
1
-0
7
-2
0
1
2
0
1
-0
1
-2
0
1
3
0
1
-0
7
-2
0
1
3
0
1
-0
1
-2
0
1
4
0
1
-0
7
-2
0
1
4
2013 Spread:0.61
2014 Spread (October):0.38 Source: OMEL
EDP-ENERGIASDEPORTUGAL COMPANY REPORT
spread between the two countries has been shrinking, which is a consequence of the increasing number of interconnection points between the two countries (figure 28). Secondly, the Portuguese average price has been lower than the Spanish one, which goes against the prices pre MIBEL period. In figure 28, it is possible to observe the increase of the interconnection capacity between Portugal and Spain. It is possible to observe that Spain has a higher export capacity than Portugal, however when compared to 2008, the difference has been decreasing. This interconnection increase has contributed to reduce the Iberian spread, since both countries will consume first the cheaper energy sources, as we will latter explain on the liberalised generation. Figure 28, also shows that EDP's gross margin decreased with the increasingly Spanish competition due to the interconnection capacity increase. Nevertheless, it is important to refer that the generation gross margin is very dependent on the generation mix. The 2012 gross margin drop was not a consequence of an interconnection increase, but rather a more costly generation mix for EDP.
Tariff Deficit in Iberia
The tariff deficit is the major problem that Iberian countries are facing on the energetic sector. In 2013, Portugal and Spain faced an accumulated tariff deficit that reached 3% of their GDP5. As GDP influence the electricity consumption by consumers, the economic recession contributed to aggravate the deficit since the sharp fall in electricity demand required an increase of electricity prices to compensate the lower volumes, which did not happen in any of these countries. It is estimated that Spain has an accumulated tariff deficit of €30 Bn at the end of 2013, which is the highest deficit among European Union member states. Portugal should have a deficit between €3.7 - €4.4 Bn6 in 2013, which represents a substantial increase from the €2.85 Bn in 20127.
An electricity tariff deficit can be generally defined as a shortfall of revenues in the electricity system, which emerges when the tariffs of the regulated components on the retail electricity price are below the true costs incurred by the regulated companies. In the Spanish case, the majority of the tariff debt was created from regulated costs, which increased significantly over the last years. These costs include the transmission and distribution costs, the support to renewable and co-generation production, the extra-peninsular costs (compensation to Spanish Islands for their higher electricity cost), and the interests paid over the tariff deficits of previous years. In Portugal, the tariff deficit
5 See the European Commission document:
" Electricity Tariff Deficit: Temporary or Permanent Problem in the EU?", Asa Johannesson
Linden, Fotios Kalantzis, Emmanuelle Maincent, Jerzy Pienkowski.
6
EU points for a deficit of €3.7 Bn, while the Government expects €4.4 Bn.
7 According to ERSE (2012).
Figure 28 - Interconnection Capacity, 2008-2014 (YTD)
69% 82%
75% 75%
59% 63% 64%
0% 25% 50% 75% 100%
0 500 1000 1500 2000 2500 3000
2
0
0
8
2
0
0
9
2
0
1
0
2
0
1
1
2
0
1
2
2
0
1
3
2
0
1
4
Spain-Portugal Portugal-Spain Gross Margin
Source: EDP and REN
Note: Gross Margin referred to 9m14 results
Figure 29 - GDP change between 2007-2013 in Portugal and Spain (%)
-4% -2% 0% 2% 4%
2007 2008 2009 2010 2011 2012 2013
Portugal Spain
EDP-ENERGIASDEPORTUGAL COMPANY REPORT
started in 2007 and 2008 with the mismatch between the current wholesale price and the price implied in the tariff. Moreover, with the subsidies to renewable and conventional electricity production, the tariff increased (figure 30). Between 2009 and 2011, the Portuguese government launched an aggressive plan of almost €800 Mn, to support renewable electricity. However, the government postponed the tariff payments to the utilities companies to 2012. The legal framework in both countries allow those entities that have the tariff deficit burden to transform it into fixed-income securities. These securities are backed by payment rights, repaid by electricity consumers. This mechanism allowed EDP to securitize and issue part of its Portuguese regulatory receivables.
In order to reduce the current deficits, both Portugal and Spain governments are adopting aggressive measures that affect different players of the energy sector. In Spain, the government suspended the benefits to the majority of new renewable energy installations since early 2012 and included, in 2013, a new tax on the electricity generation. Moreover, the regulator is committed to reducing the remuneration of the renewables activities, instead of a fixed rate, the remuneration rate will be 300 basis over the yield of the 10 year Spanish bond. In Portugal, the government intends to eliminate the tariff deficit until 2020. In order to accomplish this ambitious objective, the government introduced several new measures, from which we highlight, the restructuring of the CMECs' agreement with EDP, the revision of the remuneration scheme for co-generation, like in Spain, and a cut on the benefits for Renewable energy installations. Moreover, the government introduced a new energy tax of 0.85% on the net assets of energy companies. All these changes on the regulatory business creates instability on the regulated markets, since Iberian governments will create new and more aggressive measures if the current ones do not fulfil their purpose. Regarding EDP's regulated business, the regulators might penalize them. These reductions could be done either by the efficiency factor increase or by the adoption of instruments with the lowest yield, as the Portuguese government did between 2012-2014, where it chose the Portuguese 5 year CDS instead of the Portuguese 10 year bond. All in all, we believe that the regulatory businesses will suffer since both Iberian governments need to reduce the tariff deficit.
Figure 30 - Evolution of the tariff deficit in Portugal, 2007-2013 (€Bn)
0 0,5 1 1,5
2007 2008 2009 2010 2011 2012 2013E
Source: ERSE
In 2008, the implied wholesale price was €50/MWh, while the average purchase price on the
wholesale market was
EDP-ENERGIASDEPORTUGAL COMPANY REPORT
Electricity Generation
Global Overview
Since its birth in the 19th century, the demand by electricity has been consistently increasing. According to the lastest IEA report8, world electricity demand will continue to grow by 2.1% every year from 2012 until 2040 (figures 6 and 31). Consequently, the world's electricity generation must increase from the 22,721 TWh in 2012 to 40,104 TWh in 2040, which represents an increase of 77%. Installed capacity will also grow from 5,952 GW in 2013 to just over 10,700 GW in 2040.
In order to reduce the fossil fuels share on electricity generation the majority of the new power additions will be renewables based, according to IEA. Nonetheless, coal and gas will continue to have a significant share on the future total electricity produced because the utilisation rates of renewables plants are much lower than those of thermal ones. In Figure 32, it is possible to observe that coal will continue to be in 2040, according to IEA estimates, the major source of electricity generation with 31%, however it registers a 10% drop from its 2012 share of 41%. Natural gas will continue to be the second source of electricity generation with 24%, a 2% increase from its 2012 share. Overall, fossil fuels drop from its 68% share in 2012 to 55% in 2040. Renewables (excluding hydro generation), will have the biggest increase between 2012 and 2040. In OECD countries, renewables (including all forms generation) will jump from its 21% share in 2012 to a 37% share in 2040. In European Union, energy production from renewable sources is expected to reach a 46% share in 2040, which almost doubles its current level. This investment in clean energies comes from a long list of decarbonisation policies taken by the OECD countries. The referred policies already penalize and will continue to fine the CO2 emissions, which could lead to an increase of the fossil fuels generation prices in OECD countries. IEA expects that OECD countries diminish its carbon emissions from 4.8 Gt9 in 2013 to 3.2 Gt in 2040. On the contrary, non-OECD countries are expected to increase its CO2 emissions, from 8.5 Gt in 2013 to 12.2 Gt in 2040, countries like China and India will continue to increase its emissions, even though China's aims to decarbonise its power sector. Lastly, Nuclear will keep its 12% share, even though it is a clean and cheap source of electricity, in case of an accident it has high consequences at the environmental and social levels, e.g. Fukushima accident in Japan. Thus, economic agents should remain sceptical about this source of energy.
8
See IEA, World Energy Outlook 2014.
9 Gigatonnes
Figure 32- Breakdown of the World's Electricity Generation: 2012-2014E (TWh)
41% 37% 31%
22% 22%
24% 5%
3%
1% 11%
12%
12% 16%
16%
16%
5% 10%
17%
2012 2020E 2040E Coal Natural Gas
Oil Nuclear
Hydro Other Renewables
Source: IEA
Figure 33 - Breakdown of EDP's Iberian Installed Capacity by Source: 2013-2017E (%)
46% 47% 50% 52% 52% 31% 31% 29% 28% 28% 21% 21% 20% 19% 19% 1%1% 1% 1% 1% 1%
2013 2014E 2015E 2016E 2017E
Hydro CCGT Coal Nuclear Fuel/Oil
Source: EDP and Analyst Estimates
Figure 31 - World Electricity Demand: 1990-2040E (TWh)
10092 19562
24068 26761
29442 32151 34887
1990 2012 2020E 2025E 2030E 2035E 2040E
EDP-ENERGIASDEPORTUGAL COMPANY REPORT
EDP's portfolio in 2013, had an installed capacity in Iberia (excluding wind) of 12.8 GW, of which 46% was from hydro generation, 31% from CCGT, 21% from coal sources, 1% from fuel and oil and 1% from nuclear production (figure 33). Over the following years, it is expected an addition of five hydro plants that together will add 1.468 MW to EDP's portfolio (figure 34). It is expected that the Iberian portfolio (excluding wind) will increase to near 14 GW in 2017, in which 52% will be hydro plants. EDP strategy follows the one adopted by OECD countries, according to IEA, so EDP should have low exposure to the decarbonisation policies planned by the European Commission. There are two disadvantages in EDP's portfolio. First, the lack of nuclear resources that besides being a clean energy source, may present a very high load factor close to 100%, if the company decides so. Secondly, even though hydro plants are a low cost energy source (figure 42), they are highly dependant on the weather conditions, which are difficult to forecast, so its utilization rates are very volatile. EDP's Iberian gross margin could suffer, if Iberia suffers a dry period since EDP would have to generate from its coal and CCGT plants that have higher costs.
Regulated Generation
Until 2007, Portuguese electricity generation was mainly under the regulated scenario, the PPA contracts, which granted a fixed remuneration independently of the volume consumed. The gross margin was calculated through a 8.5% real pre-tax Return on Assets (ROA) plus the annual depreciation and contracted costs (operational and maintenance costs), then, the sum had to be updated by inflation. Moreover, if there were adjustments to be made from the previous year tariff, it would fall in the gross margin. However, with the decree-law 240/2004, all the PPA contracts had to be extinguished until 2007. In order to keep part of the benefits from the PPA contracts, EDP reached an agreement with the Portuguese state and a new kind of contracts was created, the CMEC (Costs with the Maintenance of Contractual Equilibrium). This new agreement, which started in 2007, preserved the NPV of PPAs and provided liquidity to the recent Iberian liberalized market, MIBEL. These CMEC contracts also gave to EDP the option to securitize its tariff deficit.
In order to keep the stable cash-flow streams that previously existed with the PPA contracts, the new CMEC contracts were established in a compensation scheme dependant on the effective market demand. So, if the real market conditions were below the ones defined by the PPA threshold, EDP has to receive the difference. On the contrary, if the PPA threshold exceeds the real market conditions, EDP has to pay a compensatory fee. The CMEC contract main assumption was an average wholesale electricity price of €50/MWh (figure
Figure 35 - CMEC Calculations Assumptions
CMEC Assumptions Average Wholesale
Electricity Price Brent Price Coal Price
Cash Flow Discount Rate
€50/MWh
$63/bbl in 2010 €43/ton CIF in 2010 Portugual Government
Bond (Maturity June-14)+25bps
Source: EDP CMEC Memorandum
Figure 34 - EDP's New Hydro Additions in Iberia
Plant MW Start-up Date
Ribeiradio 81 4Q14
Baixo Sabor 172 4Q14
Venda Nova III 756 2H15
Salamonde II 207 2H15
Foz Tua 252 2H16
Total 1468
EDP-ENERGIASDEPORTUGAL COMPANY REPORT
35). As it was previously observed, the average wholesale price of €50/MWh stayed well below the realised one in 2008, which was €73/MWh. The realised differences should be paid by all electricity consumers through TPA tariffs included in the consumer final tariff. The contracts terms are annually revised from July 2007 to June 2017. At June 30 of 2017, the contract will have its final market condition revision that will endure until December 2027. This final revision in 2017 may put EDP's cash flow stability at risk, if the next government plans to pursue the current objective of eliminating the tariff debt until 2020. In fact, the CMEC contracts created a considerable part of the Portuguese tariff deficit and its conditions benefit EDP's cash flow stability, a fact that is not aligned with the country's objective. Therefore, a severe correction could happen since several entities, including the competition authority, defend that the gross profit should reflect the real market conditions.
Besides the CMEC contracts, there is another regulated generation system, which is the Special regime system. Under this regime, any operator may sell electricity to last recourse suppliers that are required to purchase electricity, under the article 55 of the decree-law 172/2006. The special regime can also sell the electricity to other suppliers operating in the market. In any case, the operator will receive the tariff applicable to the special regime generation. EDP had in 2013, an installed capacity of 370 MW under this regulated segment.
Valuation
As it was previously mentioned, EDP's gross margins are regulated by CMEC contracts since 2007 and could only be affected by adverse regulation of the Portuguese state. In Figure 36 it is possible to observe the total installed capacity of the CMEC contracts, which in 2007 was near 7,000 MW, currently, in 2015 it stands at 4,471 MW. As plants finish its CMEC contracts, the segment gross profit decreases (figure 37). When the plants finish their PPA concession, they automatically fall into the liberalised segment, with the exception of the thermal plants that are decommissioned after the end of the concession. On our valuation we kept the 8.5% ROA until 2027 since so far the regulator did not give any indication about a possible rate change. Moreover, as figure 37 demonstrates the majority of the CMEC contracts value was already paid to EDP and the regulator did not take any measure against it so, in our view, the remaining 10 years of the agreement will not bring any difference regarding the contracts terms. Nevertheless, there is regulatory risk for EDP because if Portugal's economic situation does not improve as expected, a ROA rate cut could appear on the 2017 revision. The operational costs are estimated to drop in the same proportion as the plants pass to the liberalised regime or are decommissioned. The same
Figure 36 - Plants Under the CMEC Memorandum
Plants MW End of PPA Hydro
Alto Lindos o 630 2024
Miranda 369 2013
Aguieira 336 2024
Valeira 240 2024
Bem pos ta 240 2013
Carrapatelo 201 2024
Picote 195 2013
Frades 192 2027
Pocinho 186 2024
Regua 180 2024
Cas telo de Bode 159 2015
V.Nova/Paradela 144 2015
Torrão 140 2024
Fratel 132 2020
Vilarinho Furnas 125 2022
Cres tum a-lever 117 2024
Cabril 108 2015
Alto Rabagão 68 2015
Caniçada 62 2015
Tabuaço 58 2024
Bouçã 44 2015
Salam onde 42 2015
Pracana 41 2024
Caldeirao 40 2024
Raiva 24 2024
Touvedo 22 2024
Coal
Sines 1180 2017
Fuel-Oil
Setúbal 946 2012
Carregado 710 2010
Barreiro 56 2009
Total 6987
Source: EDP CMEC Memorandum
Figure 37 - CMEC Gross Profit, 2010-2027E
20
10
20
12
20
14
E
20
16
E
20
18
E
20
20
E
20
22
E
20
24
E
20
26
E
EDP-ENERGIASDEPORTUGAL COMPANY REPORT
happens with Capex, net working capital (NWC) and operating assets and liabilities, which only includes deferred tax assets, should decrease as the plants become liberalised.
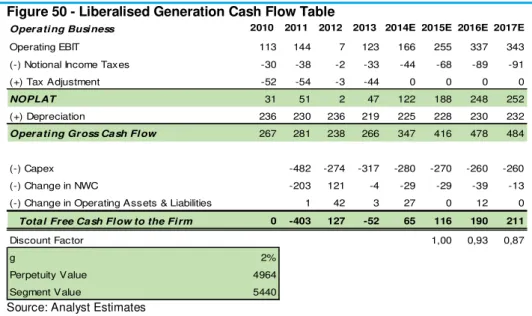
In the special regime, we considered that the load factors would be an average of the past ones. Regarding the gross profits, we believe that these will stabilize, since the last recourse unit will finish in 201510 and we do not believe that the legislation will continue to defend these small operators as it did in the past. So, we estimate that prices will grow in line with inflation. As presented in figure 38, the regulated segment has an overall value of €3,227 Mn and weighs 9% in the enterprise value. In the terminal value calculation, it was only considered the cash-flow related to the special regime generation since CMEC contracts finish in 2027. Below, it is possible to observe the segment cash-flow map.
Figure 38 - Cash Flow Table Regulated Generation
Operating Business 2010 2011 2012 2013 2014E 2015E 2016E 2017E
EBIT 663 630 592 513 461 451 416 395
(-) Notional Income Taxes -176 -167 -157 -136 -122 -120 -110 -105
(+) Tax Adjustment -306 -238 -235 -182 0 0 0 0
NOPLAT 181 225 200 195 339 332 305 290
(+) Depreciations 214 210 210 213 199 187 176 165 Operating Gross Ca sh Flow 394 435 411 408 537 519 481 456
(-) Capex -103 -234 -35 -51 -47 -44 -35
(-) Change in NWC -180 101 4 10 0 7 0
(-) Change in Operating Assets & Liabilities -7 -22 -24 -56 0 -39 0
Total Free Cash Flow to the Firm 144 256 352 440 472 405 420
Discount Factor 1,00 0,94 0,89
g 2%
CMEC 2018-2027 1139
Perpetuity Value 859
Segment Value 3227
Source: Analyst Estimates
Liberalised Generation
The liberalisation of the electricity market redistributed the value between EDP's liberalised segments. The liberalised generation was a segment that in the first years of MIBEL did not have a big weight in EDP's group. In 2007, it only had an installed capacity of 4,095 MW, way below the 7,000MW of CMEC contracts. In 2013, this segment had an installed capacity of near 7,120 MW, while in 2015 it is expected to pass the 8,500 MW barrier (figure 39). The increase of 1,555 MW comes as result of the passage of the hydro plants from CMEC contracts to the liberalised part, but also of EDP's investment on new hydro plants (figure 34). EDP's goal is to have its generation mix mainly composed by hydro plants
10 31/12/2015, for those clients that have a power inferior to 10.35 kVA
Figure 39 - Liberalised Portfolio Evolution, 2013-2017E (MW)
7119 7837
8509 9743 9869
2013 2014E 2015E 2016E 2017E
EDP-ENERGIASDEPORTUGAL COMPANY REPORT
because it is a source of energy that has a low correlation with the oil price and has low CO2 emissions.
As any other liberalised competitive market, the price depends of the supply and demand curves. Nevertheless, in the MIBEL case, it is a more complex process since electricity is not a commodity that is possible to accumulate in a battery and used afterwards when needed. In fact, producers generate electricity from its different sources, which afterwards will go to the Iberian pool at the residual price because MIBEL is subject to a pre-establish hierarchy. In this scheme, the special regime production is the first one to be sold, if it is sufficient to cover demand, the price is established and the remaining energy is not sold. If the supply is not enough to fulfil demand, other sources of energy are added to the pool, having in consideration its marginal cost. At this point, where supply is equal to demand, the market price is established. Generally, the electricity generated by hydro and nuclear sources are the first ones to be sold due to its lower costs. As it is possible to observe in figure 41, hydro and nuclear are the sources with lower costs, €4/MWh and €5/ MWh, respectively. The coal and CCGT have much higher costs, €40/MWh and €106/ MWh, respectively. These sources of energy require huge amounts of fuel so its costs are much higher than the hydro plants ones. As coal and CCGT use fossil fuels these plants produce higher CO2 emissions than the hydro or nuclear ones, which could result in CO2 emission fees, if its emissions are higher than the free allowances granted by the European Union. Therefore, EDP will always prefer to use first its installed capacity in hydro and nuclear, not only because of its lower costs but also by its low CO2 emissions. In 2013, EDP produced 13,321 GWh, which represents a stabilization of production when comparing with the 2012 production of 13,185 GWh. In figure 42 it is possible to observe the composition of 2013 generation, even though coal was the more significant source of electricity, hydro increased its weight on the generation mix from 16% in 2012 to 32% in 2013. In figure 43, we have the generation mix for 2012, which was mainly composed by coal and CCGT, a fact that contributed for a lower EDP's gross margin (figures 10 and 28). The 2013 hydro increase, due to the verified rainy weather conditions, allowed EDP to raise its gross margin in 2013 in Iberia.
EDP's installed capacity and, consequently, its generation mix is suffering from its lack of nuclear plants. Figure 44 shows that in 2013 EDP was the company with the lowest installed capacity of nuclear plants, when compared with its Iberian peers. This fact is a disadvantage for two reasons. First, in case of a dry year, EDP has to use coal and CCGT plants that are much more expensive than the nuclear ones, which will imply lower gross margins. Secondly, nuclear and hydro are the first plants to produce in order to fill MIBEL's demand. As EDP has
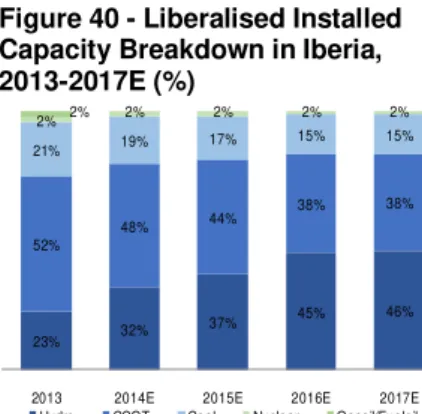
Figure 40 - Liberalised Installed Capacity Breakdown in Iberia, 2013-2017E (%)
23% 32% 37%
45% 46% 52% 48%
44% 38% 38% 21% 19% 17% 15% 15% 2% 2% 2% 2% 2% 2%
2013 2014E 2015E 2016E 2017E Hydro CCGT Coal Nuclear Gasoil/Fueloil
Source: EDP and Analyst Estimates
Figure 43 - Generation Mix in 2012 (%)
51%
24% 16%
9%
Coal CCGT Hydro Nuclear
Source: EDP
Figure 42 - Generation Mix in 2013 (%)
48%
32% 11%
9%
Coal Hydro CCGT Nuclear
Source: EDP
Figure 41 - Fuel Costs in 2013
Fuel Costs €/ M W h
Hydro 4
Nuclear 5
Coal 40
CCGT 106
EDP-ENERGIASDEPORTUGAL COMPANY REPORT
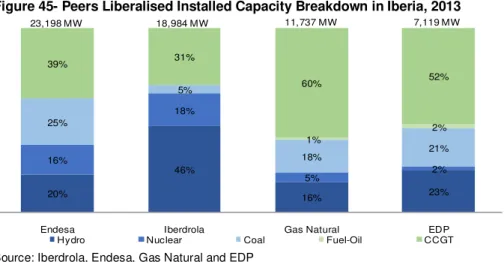
a low nuclear share in its portfolio, it will be behind its peers since these will sell all their nuclear production before EDP's fossil fuels production. All in all, this nuclear issue could result in lower volumes, especially in drought years. Figure 45 presents Iberdrola, Endesa, Gas Natural and EDP's 2013 portfolio breakdown in the liberalised segment.
Figure 45- Peers Liberalised Installed Capacity Breakdown in Iberia, 2013
20%
46%
16% 23%
16%
18%
5% 2%
25%
5%
18% 21%
1%
2%
39% 31%
60% 52%
Endesa Iberdrola Gas Natural EDP
Hydro Nuclear Coal Fuel-Oil CCGT
18,984 MW
23,198 MW 11,737 MW 7,119 MW
Source: Iberdrola, Endesa, Gas Natural and EDP
When comparing the four companies, Iberdrola's liberalised portfolio is the one that currently has more exposure to low cost generation sources, while Gas Natural is on the opposite end. All in all, EDP is on the right track with the increase of its hydro capacity on the liberalised segment since it is a green low cost source of energy. Nevertheless, an increase of nuclear installed capacity could be a positive point on EDP's liberalised portfolio, for the reasons above mentioned.
Valuation
In our valuation, we estimated the gross profits of each country, Portugal and Spain, as well as the installed capacity and, consequently, the generation mix. In order to estimate the appropriate electricity produced and the mix of it, we observed the estimated GDP evolution in both countries (figure 46). According to IMF, both Iberian countries appear to have recovered from its recession on the past years. As electricity demand is correlated with the GDP's evolution (figure 47), we should expect an increase on the demand side, and consequently on supply. Figure 48 shows the total electricity sold by the group (includes CMEC and Special Regime), which recovered from its 2012 drop, with the liberalised sector giving a big contribution on such recovery. In fact, in the future this segment is expected to increase its weight on the total electricity sold due to the increase of its installed capacity.
In order to forecast the gross profit we had into consideration the generation mix of the next years and the costs associated with it. EDP's production mix is related
Figure 46 - GDP change in Portugal and Spain, 2014E-2017E (%)
1,0%
1,5%
1,7% 1,8%
1,3%
1,7% 1,8% 1,8%
2014E 2015E 2016E 2017E
Portugal Spain
Source: IMF
Figure 44 - Nuclear Liberalised Installed Capacity in Iberia in 2013(MW)
3687
3410
604 156
Endesa Iberdrola Gas Natural EDP