Journal of Applied Bacteriofogy 1996, 81, 126-1 32
Ethanol-induced changes in the fatty acid composition of
Lactobaci//us hilgardii, its effects on plasma membrane fluidity
and relationship with ethanol tolerance
J.A.
Couto,
N. R O Z ~ S '
and
T. Hogg
Escola Superior de Biotecnologia, Universidade Cafdiica Portuguesa, Porto, and 'lnsfifufo de Tecnologia Ouimica e Biologica, Oeiras, Portugal
5565/11/95: received 23 November 1995, revised 23 January 1996 and accepted 29 January 1996
J.A. COUTO, N. R O Z ~ S AND T . H O G G . 1996
.
T h e effect of environmental ethanol
concentration on the fatty acid composition of strains of
Lactobacillus hilgardii,
differing in their tolerance to ethanol, was determined.
A
marked increase in the
proportion of lactobacillic acid (a cyclopropane fatty acid) and a decrease in oleic and vaccenic
acids with increasing ethanol concentration was observed. T h e amount of lactobacillic
acid determined at standard conditions (25"C,
O0h
ethanol) was found to be proportional to
the ethanol tolerance
of the strains studied. T h e effect of this alcohol on plasma
membrane fluidity was studied by differential scanning calorimetry. T h e adaptive
response
to
growth in the presence of high concentrations of ethanol produced
membranes which, within the limits
of
ethanol tolerance, maintained the fluidity and integrity
in an environment which tends to increase membrane rigidity. When pre-adapted cells
are analysed in the absence
of
environmental ethanol there is a measurable increase in fluidity.
It is proposed that this phenomenon may be correlated with the increase in the
proportion of lactobacillic acid. T h e existence of a relationship between membrane
fluidity and ethanol tolerance
is
discussed.
INTRODUCTION
with its direct environment is the plasma membrane. It is
Most bacteria exhibit a dose-dependent inhibition of growth
over the range
l0/oto 10% (v/v) ethanol and few organisms
grow at concentrations above 10°/o (Ingram and Buttke 1984).
Organisms
ofthe genus
Lactobacilluscan be considered
exceptional in this respect in that many of these grow in
higher concentrations of this alcohol. Certain strains of
Luct.
hilgurdii, along with strains
ofcertain other lactobacilli
(Lact.
jiuctioorans and Luct.
homohiochii)are some
of the most
ethanol-tolerant of all free-living vegetative cells (Uchida
1075; Kandler and Weiss 1986). Due to their high intrinsic
resistance, isolates of
Luct. hilgardziobtained from Douro
fortified wine (Couto and
Hogg1994) present a useful model
for the further study of mechanisms
of resistance
tothis
environmental challenge.
The primary site through which the cell maintains contact
Curtespondcncr to: Dr T. HI,KK, Ls'rrola Superior de Biotecnologiu, l ~ ~ t i r ~ r s i d u i l e Cutdlir u Portuguesu, R. D r Antdnio Bernurdzno de Almcida,
41700 Porta, PortiquL
therefore likely that it would be the primary site for the
expression of an adaptive response to environmental ethanol
(Dombeck and Ingram 1984). T h e potency of alcohols in
eliciting alterations
a tthe plasma membrane level has been
shown to be directly related to their hydrophobicity or
octanol-water partition coefficients (Ingram 1986), sup-
porting the suggestion of a hydrophobic site
ofaction. That
ethanol induces changes in the lipid membrane composition
of several organisms, apparently to favour microbial growth
and survival in its presence, has also been shown. Among
eukaryotes,
Saccharom.ycescerevisiue is probably the most
studied organism in this respect (Thomas
etal. 1978; Mishra
and Prasad 1989; Castillo Agudo 1992; Sajbidor and Grego
1992; Alexandre
et al. 1993,1994) but other yeasts, considered
to have elevated resistance to ethanol, have also been studied:
Schixosucchuromyces pornbe (Koukou et al.199O),
Kloekeruapiculata (Alexandre et
al.1994) and
Zygosuccharomyces b a t h(Couto and Huis in't Veld 1995). These yeast cells were
grown in the presence of increasing concentrations of ethanol
and subsequently analysed for phospholipid fatty acyl com-
0 1996 The Society for Applied BacteriologyETHANOL TOLERANCE IN LACJ. H l L G A R D l l 127
position. Results show a dose-dependent increase in the con-
tent of unsaturated fatty acids. Sterol composition can also
be affected by the presence of ethanol as reported by Alex-
andre
et a f .(1994), who found a significant increase in ergos-
terol in cells grown at near limiting ethanol concentrations in
atolerant strain of
S.
cerevisiae. Among bacteria, Escherichia
coli has,
asin most aspects, been extensively investigated in
terms of ethanol tolerance mechanisms (Ingram 1976; Ingram
and Vreeland 1980; Buttke and Ingram 1980); indeed changes
in fatty acid composition have been shown to be analogous
towhat has been described above for yeasts. Other bacteria
which have also been the subject of study include
'Lact.
heterohiochii' (now included in Lact. jhctivorans) (Uchida
1975), Bncillus
subtilis (Rigomier et al. 1980), Clostridium ther-
mocellum
(Herrero
et al. 1982) and
Zymomonasmobilis
(Bringer
et
a/.1985). It is worthy to note that not all studies
within these organisms demonstrate the same trend in lipid
changes.
The incorporation of more unsaturated fatty acids into
membrane lipids would tend to cause an increase in fluidity
(if measured in a constant environment). Such composition
shift is seen as an adaptive response of the cell to ethanol,
compensating for the direct physico-chemical interaction
which this compound has with the membrane (Ingram 1976).
This model, whilst being widely reported, is apparently not
universally applicable to all organisms. Exceptions have been
reported by Dombeck and Ingram (1984) who found that
plasma membranes isolated from
E. coli cells grown in the
presence
ofethanol were more rigid than those from control
cells and Rigomier
et al. (1980) who observed that in B. subtilis
ethanol-induced changes in fatty acids decreased rather than
increased membrane fluidity.
A wide variety of physical methods can be applied to
investigate the organization and dynamics of the lipid bilayer
in model and biological membranes. Differential scanning
calorimetry (DSC), the method chosen for this work, is a
thermoanalytical technique that monitors changes in physical
or chemical properties of materials as
afunction of tem-
perature by detecting the heat changes associated with such
processes (Biliaredis 1983). It has proved to be of great value
in studies
ofthe thermotropic behaviour of lipids in biological
membranes (McElhaney 1982) and has been applied to the
study of adaptive mechanisms of membranes in some bacterial
species (Reizer
et al. 1985; Lepock et al. 1990). In this work,
ethanol-induced alterations in the fatty acid composition of
Lact. hilgurdii are analysed and its relationship with plasma
membrane fluidity and ethanol tolerance is discussed.
MATERIALS AND METHODS
Bacterial strains and cultural conditions
The present studies were performed with the following
strains:
Lact. hilgardii 5 and Lact. hilgardii 28 isolated from
Douro Valley fortified wine and identified as described by
Couto and Hogg (1994); and
Lact. hilgardii NCFB 264 (type
strain) obtained from the National Collection
ofFood Bac-
teria (NCFB), AFRC Institute of Food Research, Reading
Laboratory, Shinfield,
UK. Cells were grown at 25°C in
MRS broth (Lab
M) with p H adjusted to 4.5 at different
concentrations of ethanol: 0, 5,
10, 15 and 18% (v/v) for
Lact. hiIgardii 5; 0,
5,
10 and 15% €or
Lact. hilgardii 28; and
0, 5, 10 and 14% for Lact. hilgardii NCFB 264.
Bacterial fatty acid analysis
Cells (1 ml) from stationary phase cultures were harvested by
centrifugation (8000
g,10 min) and washed twice with sterile
water. The analysis of the fatty acid composition of cells was
carried out as described by Rozes
et al. (1993).
Isolation of membrane vesicles
Membrane vesicles were obtained following the procedure
described by Otto
et al. (1982).
T oachieve proper lysis of
cells the amount of lysozyme was increased from 5 to 20 mg
ml-'.
Differential scanning calorimetry
Cultures were centrifuged at 8000
gfor 10 min, washed twice
in 0.1 mol
1-'potassium phosphate buffer (pH 7) at 4°C
containing 100
pmol l-'
chloramphenicol (Sigma) (to prevent
protein synthesis during harvest and manipulation) and
resuspended in the same solution. Intact cells or membrane
vesicles were weighed (1 5-20 mg wet wt) and hermetically
sealed in aluminium DSC pans.
D S C scans were obtained with a Shimadzu DSC-50 calor-
imeter. Samples were heated at 5°C min-' from about -6 to
80°C, using as reference, a pan containing the phosphate
buffer or cells grown in the absence of ethanol
(LO). After
heating, some of the samples studied were cooled (using
liquid nitrogen) and re-scanned to investigate the reversibility
of the thermograms. Temperature and heat were calibrated
according to the manufacturer's instructions using the melt-
ing of indium as standard.
RESULTS
Previous studies in this laboratory have shown that the strains
used in this work have different tolerances to ethanol;
Lact.
hilgardii
5,
28 and NCFB 264 not being able
togrow at
concentrations higher than 18,16 and 14%, respectively (data
not shown).
128 J . A . COUTO E T A L
Fatty acid composition of Lact. hiigardii and ethanol- induced changes
From Table
1,
an initial observation is that saturated, mono- unsaturated and cyclic fatty acids were encountered in the three strains analysed. 1,actobacillic acid (C19) is present at high levels in all strains. Palmitic acid (C16:O) is the pre- dominant fatty acid in strain5
and is also present at a high level in strain 28. Oleic acid (C18:l cis9) predominates inZACL.
hilgurdii NCFR
264, being identified ata
high level also in strain 28. Vaccenic acid (C18:l cis11)
appearcd at a similar concentration as oleic acid in strain 28 and at lower levels in strains5
and NCFB 264. Luctobacillushilgurdii
NCFB 264 and 28 contain a small amount of cicosenoic acid (C20:l) which was not found in strain5 .
The distribution of the fatty acyl residues was examined in early stationary phase cultures grown at different con- centrations of ethanol and is shown in Fig. 1. The presence of this alcohol in the growth medium results in considerable changes in the Fatty acid composition of the bacteria studied. l o r all strains examined, the percentage of C19 increased with increasing ethanol concentration (except at 14 and 15%
v / v in strains
NCPU 264
and 28, respectively). T h e pro- portion of C16:O decreased in strains5
and 28 with increasing ethanol concentrations whereas it has increased in strainNCFB
264. The percentage of both C18:l cis9 and C18:l cis11 decreased in all strains; particularly noted is the depletion of C18:l cis9 in strains 28 andNCFR
264 as one of the major fatty acids in these organisms. The fatty acid C2O:l decreased and was not detected in cells grown at the higher concentrationsof
ethanol. T h e amounts of the otherfatty acids did not considerably changc with the presence of ethanol.
The influence
of
ethanol on membrane fluidity in Lact. hilgardii 5When whole cells or isolated membranes of
Lact.
hilgardzi
5
grownin
the absence of ethanol were analysed byDSC
withpotassium phosphate buffer
as
reference, two endothermic transitions were observed on the first heating scan (Fig. 2). After cooling the samples, rescanning at the same heating rate yielded DSC curves presenting only one of these two transitions. As similar results were obtained for whole cells and isolated membranes, subsequent experiments were per- formed using whole cells.T o avoid the formation of the initial transient deflection, noted in curves
of Fig.
2 between0
and 10°C, apparently due to different heating capacities between sample and reference, cells grown in the absence of ethanol( L O )
were used as reference in place of buffer. This procedure allows the direct comparison, in the same thermogram, of the position of the gel to liquid-crystalline phase transition of the lipids from cells grown without and in the presence of different con- centrationsof
ethanol. In this way, endothermic events occur- ring in the reference are indicated by peaks while endothermic events in the sample are represented as troughs.No peaks or troughs were noted when
LO
cells were run in both reference and sample positions (Fig. 3A). 'The rescan using cells grown at10%
ethanol (LlO) as sample formed a definite peak (melting temperature [T,J,
26.7"C) (Fig. 3B). T h e formation of a single peak indicates that the lipid tran- sition in bothLO
and L10 cells occurs at about the same temperature, the appearance of the peak being probably due to a higher heat absorption by theL O
cells caused by slight variations in sample mass or by the intrinsic enthalpy of the transition. In Fig. 3C the trough(T,,
22.2"C) represents the lipid phase transitionof
cells grown at 15% ethanol (L15) and the peak( T ,
27.5"C) represents the same event inLO
cells. Figure
3D
also shows two thermal events, the first( T ,
19*SoC) being due to cells grown at l8%0 ethanol (L18) in the sample position. The results from Figs3C and
3D
suggest that L1S and Td18 cells have their lipid phase transitions shifted to lower temperatures. Data concerning these shifts are summarized in Table 2, the overall trend being a pro- gressive lowering of the temperatureof
transition with increasing concentrations of ethanol in growth medium. ThisTable 1 Fatty acid composition (percentagc of total) of three strains of Lactobacillus hilgardii grown at standard conditions (25"C, 0%
ethanol)
Fattj acid as O/n of total
Luilobiii rllus
strain 14:O 16:0 16: 1 17A 18:O 18: lcis9 18:lcisll 19A 20: 1
hrlg~rdir 5 3.60 f 0.89' 39.40 & 2.82 2.65
k
0.87 0.51 0.01 1.39 & 0.60 6.37 f 1.06 9.05 0.72 37.04 1.89 ND hrlgurdri 28 4~50~11.16 25.76f0.35 6.98f0.16 0.31 k0.02 0.48f0.01 15.05kO.15 15.27k0.18 31.06k0.36 0.59+0.03hrlgurdir 10.95 & 0.14 9.48
k
0.08 9.40 0.07 ND 0.93k
0.06 32.15k
0.12 7.76k
0.05 26.45k
0.25 2.87 f 0.03 NCI:B 264+Mean
5 s
D of three measurements. NI), Not detected.ETHANOL TOLERANCE I N LACT. H l L G A R D l l 129 60 r 50;"'
/-/
m 2 0 1 LLP i
10m; 0 40 302oL
l o p d
J-
- 0 5 10 15 20 0 5 10 15 20501
3040Ke
0 5 10 15 20 Ethanol concentration % (v/v)Fig. 1 Fatty acid alterations in (a) Lactobactllus hilgardiz 5, (b) Lact. hrlgardii 28 and (c) Lact. hilgardii NCFB 264 grown at various concentrations of ethanol.
0,
Myristic acid;0,
palmitic acid; x,
palmitoleic acid;f ,
methylenehexadecanoic acid;A,
stearic acid;m,
vaccenic acid;0 ,
oleic acid;0,
lactobacillic acid;A,
eicosenoic acidI I I I I I I
0 10 20 30 40 50 60 70
Temperature ("C)
Fig. 2 Thermograms obtained by differential scanning calorimetry (DSC) of Lactobacillus hilgardii 5 grown at 0%
ethanol. A, Whole cells; B, isolated membranes before protein
denaturation (first scan); C, isolated membranes after protein denaturation (rescan). In all thermograms 0.1 mol I-' potassium phosphate buffer (pH 7) was used as reference. ($) indicates position of lipid transition,
(1)
indicates position of protein denaturation. Bar. 0.2 mWindicates that at high concentrations
ofethanol
(1
5-18%),
cells
ofLact hilgardii
5 produce cytoplasmic membranes with
DSC
(mW)
I I 1 I I
10 20 30 40 50 60
Temperature
("C)
Fig. 3 Thermograms obtained by differential scanning calorimetry (DSC) of whole cells of Lactobacillus hzlgnrdzi 5
grown at (A) O%, (B) 10°/o, (C) 15% and (D) 18% ethanol. All thermograms were obtained using cells grown at 0% ethanol as reference. (+) indicates position of peaks, (+) indicates position of troughs. Bar, 0.2 mW
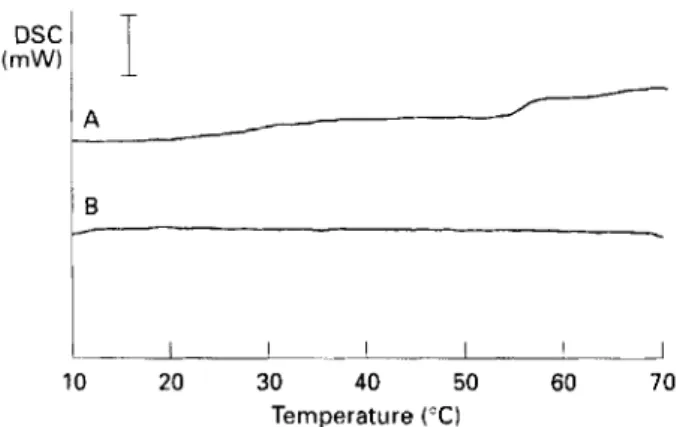
an increased proportion
of lowmelting lipids. From Fig.
4 it
is noted that this is not the case for Lact
hilgardii
NCFB 264
grown at limiting concentrations
ofethanol (14%).
130 J . A . COUTO E T A L .
Table 2 Transition temperatures of whole cells of LactobaczlluA
h i l g u r h 5 grown at different concentrations of ethanol
Temperature transitions Ethanol concentration (00 \ / v ) To
T,,
T, 0 1 i 18I;,, Onset of transition; 7m, melting temperature; 7,, end of
transition. * . l e a n
k
s.11. of three measurements. DSC (rnW) B.
L - u . - L - 10 20 30 40 50 60 70 Te rn per at u re (" C )Fig. 4 Thermograms obtained by differential scanning calorimetry (DSC) of whole cells of L,uctobariIlus hilgardzi NCFB 261 grown at (A) O'% and (B) 14% ethanol. Thermograms
n c r c obtained using cells grown at O'%I ethanol as reference.
Bar, 0.2 mW
DISCUSSION
Microhial resistance to ethanol has often been related to the fatty acid composition of plasma membrane lipids (Ingram and Ruttke
1984). A
review of the literature indicates that it is difficult to find a specific pattern of fatty acids common to organisms showing high ethanol tolerance. From the results of this study it is noted thatLact. hilgurdii
does not showa similar fatty acid composition to other ethanol-tolerant lactobacilli. This species does not contain the very long chain fatty acids
(C20-C30)
(only very small amounts ofC20: 1
were found for two strains) reported to exist in'Lact. heterohiochii'
(current name
I m t .
fructiz.orans), a spoilage bacterium of Japanese rice wine (Saki.) that can grow in media containing more than 20?h ( v / v ) ethanol (Uchida1974).
This organism was found to produce unusually long chain fatty acids and this inherent and unique character was considered responsible for, or at least related to, the high resistance of this species t o ethanol. According to this author, it is likely that the presence of long hydrocarbon chains in membrane lipid com-ponents provides a more fortified hydrophobic barrier regarded as beneficial for survival in the presencc of ethanol. The mechanism for this has been suggested as an increase in the surface area for hydrophobic and van der Waals inter- actions and a decrease of the polarity within the hydrophobic core (Carey and Ingram
1983).
Lactobacillus hilgurdii
5
and28
do not contain large pro- portions of the unsaturated fatty acidsC18:
1
cisl1
orC18: 1
cis9. It was observed for the three strains studied that the amounts of these compounds decreased with increasing etha- nol concentrations. This is not in accordance with the evi- dence found in the literature which largely stresses the importance of membrane lipid unsaturated fatty acids in etha- nol tolerance. Comparing the fatty acid composition of etha- nol-tolerant organisms it is possible to note thatC18:l
is present as a major fatty acyl residue as reported inZ. mohi1i.s
(Carey and Ingram
1983;
Bringer etal. 1985),
CI.
thermo~ellum (Herrero et nl.1992),
S.
cerevzsiue (Giudici and Guerzoni1983)
andSchzz.
pombe (Koukou etal. 1990).
In the caseof
Z.
mobilis, C18:l
cisl1
represents over60%
of the total acyl chains in the membrane lipids (Bringer etul.
1985).
This acid is also the most abundant fatty acid inE.
coli (Ingram1976)
with increasing proportions in cells grown in the presenceof
ethanol. Carey and Ingram(1983)
considered that the fatty acid cornposition of 2. mobilis, an obligately ethanol-pro- ducing organism, represents an extreme of the trend observed inE. coli
and so it may represent an evolutionary adaptation for survival in the presence of ethanol.Referring solely to compositional alterations in the fatty acid complement of the plasma membrane,
a
final observation is that the cyclopropane lactobacillic acid(C19)
is the com- pound which alters most with varying ethanol concentrations in theLact. hilgurdzi
strains analysed (Fig.1).
Potential mech- anistic considerations of this observation are dealt with below. Concerning theDSC
data of whole cells and isolated mem- branes of cells grown in the absence of ethanol, two endo- thermic transitions were detected, the rescanning producing only the lower temperature transition (Fig.2 ) .
The first region of heat absorption, which appeared in both scan and rescan, is consistent with a reversible transition in the lipid component of' the membrane, the second region being prob- ably due to an irreversible denaturation of the protein com- ponent (Melchior et al.1970;
Ashe and Steim1971;
McElhaney1989).
The lipid and protein transitions of whole cells occur at slightly higher temperatures thani.n
the isolated membranes, an observation noted also by Ashe and Steim(1971)
with Micrococcus lysodeikticus. These authors suggested that the interaction between the membrane and the cell wall might be responsible for the higher transitions in whole cells. In this study, cells grown at15%
and18Yo
(v/v) ethanol(L15
andL18
cells) show lipid phase transition at lower temperatures than cells grown in the absence of ethanol, theseresults suggesting that the adaptation of cells after exposure to
E T H A N O L T O L E R A N C E I N LACT. HlLGARDll 131
ethanol produces a more ‘fluid’ membrane. T h e fluidization response can be interpreted as a counteraction to the physico- chemical effect of ethanol o n membranes. Based on the hypothesis of ‘homeoviscous adaptation’ (Sinensky 1974) the production of a more fluid membrane is a compensation for the increase in ‘rigidity’ due to ethanol presence. T h i s behaviour is consistent with ethanol-induced changes occur- ring in
Clostridium
(Herreroet
a/. 1982; Curatoloet al.
1983; Baskaran el al. 1995) and inS. cerevisiae
(Mishra and Prasad 1989; Lloydet
a/. 1993; Alexandre et nl. 1994) but contrary to findings withB. subtilis
(Rigomieret al.
1980) where chan- ges in fatty acids decreased membrane fluidity.Since C19 has physical properties similar to unsaturated fatty acids (Law et al.
1962;
McElhaney 1989), the increase in the fluidity of the membrane seems to be associated with the increase in the proportion of this lipid in the membrane. The-role of cyclopropane fatty acids in the prevention of close packing of lipids in cell membranes, which makes them more elastic and flexible during exposure to environmental conditions, has been proposed by Kodicek (1963). Smittle etal.
(1974) have also reported theC19
fatty acid to be one of the most closely related to the resistance ofLact. bulgaricus
to freezing. Hence, the adaptation mechanism to ethanol could be related to the capacity of the cell to raise the pro- portion of
C19.
L10
cells did not show a detectably different thermogram if compared withLO
cells. T h e alteration in the fatty acid composition induced by the presence of10%
ethanol (Fig. la) may not alter the membrane fluidity to a measurable level. Certainly it has been observed that 10°/o ethanol is not inhibi- tory toLact. hilgardii
5,
indeed growth of this strain is actually stimulated by concentrations u p to10%
(data not shown).As
noted, cells of strainNCFB 264,
even when grown at14%
ethanol, did not show apparent alteration in membrane fluidity (Fig. 4B). T h i s is possibly due to the concomitant relative increase of C16:O andC19. As
a saturated fatty acid,C16:O
would tend to oppose the fluidizing effect ofC19.
T h e ability of strain5
to alter its membrane lipid composition, and thus fluidity, to a greater extent is reflected in its ability to tolerate higher concentrations of ethanol. I t is, according to the literature reviewed by Ingram and Buttke (1984), con- sistent that these two characters are related.Ethanol tolerance among strains of
Lact. hilgardii
appar- ently has some taxonomic relevance. T h e hierarchical level at which it is of importance is an areaof
current study. I t can be observed in Table1
that the amount ofC19
present in the three strains studied in this work, grown under control conditions (absence of ethanol) is proportional to their ethanol resistance. T h e evidence presented in this study suggests that there exists a relationship between membrane fatty acid composition and ethanol tolerance inLuct. hilgardii
in which the important role ofC19
in the response of cells to the presence of ethanol should be stressed.ACKNOWLEDGEMENTS
JAC
was supported by aJNICT
(Junta Nacional d e Invest- iga@o Cientifica e Tecnologica, Portugal) postgraduate stud- entship. T h i s work was made possible by the generous support ofEC-AIR-CT94 2468
project o n the deterioration of fortified wine.REFERENCES
Alexandre, H., Rousseaux, I. and Charpentier, C. (1993) Ethanol adaptation mechanisms in Saccharomyces cerevisiae. Biotechnology
and Applied Biochemistry 20, 173-183.
Alexandre, H., Rousseaux, I. and Charpentier, C. (1994) Relation- ship between ethanol tolerance, lipid composition and plasma membrane fluidity in Saccharom.yces cerevisiae and Kloeckeru apic-
ulata. F E M S Microbiology Letters 124, 17-22.
Ashe, G.B. and Steim, J.M. (1971) Membrane transitions in Gram- positive bacteria. Biochimicu et Bioph,ysica Acta 233, 8 10-814. Baskaran, S., Ahn, H.J. and Lynd, L.R. (1995) Investigation of the
ethanol tolerance of Clostridium thermosaccharo(yticum in con- tinuous culture. Biotechnology Progress 11, 27G281.
Biliaredis, C. (1983) Differential scanning calorimetry in food research - a review. Food Chemistry 10, 239-265.
Bringer, S., Hartner, T., Poralla, K. and Sahm, H. (1985) Influence of ethanol on the hopanoid content and the fatty acid pattern in batch and continuous cultures of Zymomonas mobilis. Archives o/’
Microbiology 140, 312-316.
Buttke, T.M. and Ingram, L.O. (1980) Ethanol-induced changes in lipid composition of Escherichia coli: inhibition of saturated fatty acid synthesis in vitro. Archives of Biochemistry and Bioph,ysics 203, Carey, V.C. and Ingram, L.O. (1983) Lipid composition of Zym-
omonas mobilis: effects of ethanol and glucose. Journal o f Bur-
terinlogy 154, 1291-1300.
Castillo Agudo, L. (1992) Lipid content of Sacchurom,yces cerevisiae strains with different degrees of ethanol tolerance. Applied Micro- biology and Biotechnology 37, 647-65 1.
Couto, J.A. and Hogg, T . (1994) Diversity of ethanol-tolerant lac- tobacilli isolated from Douro fortified wine: clustering and identi- fication by numerical analysis of electrophoretic protein profiles.
Journal of Applied Bacteriology 76, 487491.
Couto, M.M. and Huis in’t Veld, J.H. (1995) Influence of ethanol and temperature on the cellular fatty acid composition of Zygo- saccharom.yces bailii spoilage yeasts. Journal iifApplied Bacteriology Curatolo, W., Kanodia, S. and Roberts, M.F. (1983) The effect of
ethanol on the phase behavior of membrane lipids extracted from
Clostridium thermocellum strains. Biochimica et Bioph,ysica Acta
Dombeck, K.M. and Ingram, L.O. (1984) Effects of ethanol on the
Escherichia coli plasma membrane. Journal of Bacteriology 157, Giudici, P. and Guerzoni, M.E. (1983) Relationship of cellular fatty acid composition to the ethanol productivity in Saccharom,yces
cerevisiae. Vini D’Italia 145, 147-152.
Herrero, A.A., Gomez, R.F. and Roberts, M.F. (1982) Ethanol- 565-571.
78,327-334. 734, 336-341. 233-239.
132 J.A. COUTO E T A L .
induced changes in the membrane lipid composition of Clo-
stridium thermocellum. Biochrmica et Binphysica Acta 693, 195-204. Ingram, L.O. (1976) Adaptation of membrane lipids to alcohols.
journal i f Bacteriology 125,670-678.
Ingram, I..O. (1986) Microbial tolerance to alcohol: role of the cell membrane. Trends zn Biotechnology 4, 4 W 4 .
Ingram, L.O. and Buttke, T. (1984) Effects of alcohols on micro- organisms. Advances in
Microbial
Physiology 25, 253-300. Ingram, L.0. and Vreeland, N.S. (1980) Differential effects ofethanol and hexanol on the Escherzchia cnli cell envelope. journal
Uf'Bacteriology 144, 481-488.
Kandler, 0 . and Weiss, N. (1986) Regular, nonsporing gram-posi- rive rods. In Bergey's Manual of Systematic Bacteriology, Section Kodicek, E. (1963) Aspects of the constitution of bacterial membranes. In Recent Progress zn Microbiology, Vol. 8, ed. Gibbons, N.E. pp. 23-37. Toronto, Ontario, Canada: University of Toronto Press.
Koukou, A.I., Tsoukatos,
I>.
and Drainas, C. (1990) Effect of etha- nol on the phospholipid and fatty acid content of Sch-izosacchnromyces pombe membranes. Journal of General A4icrohiology 136, 1271-1277.
Law, J.H., Zalkin, H . and Kaneshiro, T . (1962) Transmethylation rcactions in bacterial lipids. Binchimica et Bioph,ysica Acta 70,143- 15.1.
Lepock, J.R., Frey, H.E. and Inniss, W.E. (1990) Thermal analysis by differential scanning calorimetry: relationship of protein dena- turation in situ to maxiniuni growth temperature. Biochimica et Binphysica Acti~ 105, 19-26.
Lloyd, D., Morrel, S., Carlsen, H.N., Dcgn, H., James, P.E. and Rowlands, C.K. (1992) Effects of growth with ethanol on fer- mentation and membrane fluidity of Saccharomyces cerevi.ciae.
Yeast 9 , 825-833.
McElhancy, R.N. (1982) The use differential scanning calorimetry and differential thermal analysis in studies of model and biological membranes. Chemistry and Physics qf'Lipids 30, 229-259. McElhancy, R.N. (1989) The influence of membrane lipid com-
position and physical properties of membrane structure and func- tion in Acholeplasmu Iaidlamii. Critical Rcciews in Microbinlogy 17,
1-32.
14. pp. 1208-1234.
Melchior, D.L., Morowitz, H.J., Sturtevant, J.M. and Tsong, T.Y.
(1970) Characterization of the plasma membrane of Mycoplusma
laidlamii. Biochimica et Biophysica Acta 219, 114--122.
Mishra, P. and Prasad, R. (1989) Relationship between ethanol tolerance and fatty acid composition of Sacchuromyces cererisiae.
Applied Microbiology and Biotechnology 30,294-298.
Otto, R., Lageveen, K.G., Veldkamp, H. and Konings, W.N. (1982)
Lactate efflux-induced electrical potential in membrane vesicles of Streptococcus cremoris. Journal of Bacteriolngy 149, 733-738. Reizer, J., Grossowicz, N. and Barenholz, Y. (1985) The effect of
growth temperature on the thermotropic behavior of the mem- branes of a thermophilic Bacillus. Composition-structure-func- tion relationships. Biochimica et Binphysica Acta 815, 268-280. Rigomier, D., Bohin, J.P. and Lubochinsky, B. (1 980) Effects of
ethanol and methanol on lipid metabolism in Bacillus suhtilis. journal of General Microbioloal 121, 139-1 49.
Rozes, N., Garbay, S., Denayrollcs, M. and Lonvaud-Funel, A. (1993) A rapid method for the determination of bacterial fatty acid composition. Letters in '4pplied Microbiology 17, 126-131. Sajbidor, J. and Grego, J. (1992) Fatty acid alterations in Sac.-
charom.yces cerevisiae exposed to ethanol stress. FEMS Micro-
biology Letters 93, 13-16.
Sinensky, M . (1974) Homeoviscous adaptation - a homcostatic pro-
cess that regulates the viscosity of membrane lipids in Escherichiu
coli. Proceedings ofthe National Academ,y ofSciences USA 71, 522Z 525.
Smittle, R.B., Gilliland, S.E., Speck,M.L. and Walter, W.M. (1'974) Relationship of cellular fatty acid composition to survival of
Lactobacillus bulgaricus in liquid nitrogen. Applied Microbiolog,l Thomas, D.S., Hossack, J.A. and Rose, A.H. (1978) Plasma-mem- brane lipid composition and ethanol tolerance in Sacchuromyccs
cereaisiae. Archives of Microbiology 117, 239-245.
Uchida, K. (1974) 1,ipids of alcoholophilic lactohacilli. I1 Occur- rence of polar lipids with unusually long acyl chains in Lucto-
bacillus heterohiochii. Biochimica et Bioph,ysica Actir 369, 146-155. Uchida,