INSTITUTO DE INVESTIGAÇÃO E FORMAÇÃO AVANÇADA
ÉVORA, DEZEMBRO 2014
ORIENTADOR: Professor Doutor António Domingos Heitor da Silva Reis
Tese apresentada à Universidade de Évora para obtenção do Grau de Doutor em Física Especialidade: Física
Carla Alexandra de Castro Carvalho e Silva
OPTIMIZATION AND EVOLUTION
CONTRIBUTION TO THE
PHYSICAL MODELING OF THE
CIRCULATORY SYSTEM
i
Summary
Branched networks are ubiquitous in living systems. The dimensions and the geometry of these branched structures are key aspects of the efficiency of physiological processes. A resistive-capacitive model of an optimized pulsatile flow system based on Constructal Theory is presented, which aims to explain the performance of the human arterial tree. Optimal scaling laws for diameters and lengths emerged that are valid for dichotomous branching. The model together with data of the human arterial tree showed that impedances of some arteries tend to decrease with age. The estimated scaling between diameters of branching arteries is close to optimality. With respect to scaling of arterial length no such agreement was observed. An interpretation of the lifelong elongation of the ascending aorta is proposed. The model together with Starling equation, continuity of blood flow, and the specific properties of the exchanges in capillaries provide an explanation for the observed reduction of arterial distensibility with pulse frequency observed in carotid and radial arteries.
iii
Resumo
Contribuição para a modelação física do sistema circulatório -
Optimização e evolução
As redes ramificadas estão presentes nos sistemas vivos. As dimensões e a geometria dessas estruturas ramificadas são aspectos chave da eficiência dos processos fisiológicos. É apresentado um modelo resistivo-capacitivo de um sistema de escoamento pulsado optimizado com base na Teoria Constructal, com o objectivo de explicar a performance da rede arterial humana. São obtidas leis de escala óptima para diâmetros e comprimentos, válidas para ramificações dicotómicas. A associação do modelo com dados da rede arterial humana revelou que a impedância de algumas artérias tende a diminuir com a idade. A razão das escalas entre os diâmetros estimados das artérias apresenta valores quase optimizados. O mesmo não foi observado relativamente às leis de escala dos comprimentos das artérias. É proposta uma interpretação para o alongamento da aorta ascendente ao longo da vida. O modelo desenvolvido juntamente com a equação de Starling, a continuidade do fluxo sanguíneo, e as propriedades específicas das trocas nos capilares, permitem explicar a redução da distensibilidade arterial com a pulsação observada nas artérias carótida e radial.
v
Acknowledgements
I would like to thank my supervisor Professor António Heitor Reis for his endless support and guidance throughout this thesis.
I acknowledge the support of the Geophysics Centre of Évora (CGE) and of the Physics Department of the University of Évora for providing me the conditions to the development of this work. I also acknowledge the funding provided by the CGE, under the contracts with FCT (the Portuguese Science and Technology Foundation), Pest/OE/CTE/UI0078/2011 and Pest/OE/CTE/UI0078/2014.
I thank my family for the valuable and crucial support. This work would not have been possible without their contribution.
vii
Contents
Nomenclature
...
ix
List of Papers
...
xiii
List of Figures
...
xv
List of Tables
...
xix
1. Introduction
...
1
1.1 Circulatory system as a physical system ... 1
1.1.1 Cardiac cycle ... 2
1.1.2 Vessels physiology ... 3
1.2 Scaling laws ... 4
1.3 Constructal Theory ... 6
1.3.1 Constructal Law ... 6
1.3.2 Constructal Theory and Thermodynamics ... 8
1.4 Murray’s Law ... 11
1.5 Blood flow characteristics ... 12
1.5.1 Blood rheology ... 13
1.5.2 Reynolds number ... 16
1.5.3 Hagen-Poiseuille Equation ... 17
1.6 Models of the circulatory system ... 18
1.6.1 Lumped models (Windkessel model) ... 18
1.6.2 Distributed models and tube models ... 21
1.7 Modelling of the circulatory system used in this thesis ... 23
1.8 Outline of the thesis ... 25
2.1 Introduction ... 32
2.2 Pulsatile flows ... 33
2.3 Minimization of impedance in branching pulsatile flows ... 36
2.3.1 Minimization of global impedance under constant volume ... 37
2.3.2 Minimization of global impedance under constant volume and pressure head ... 41
2.3.3 Scaling of unstrained channel diameters with different distensibilities . 42 2.3.4 Comparison of the results of the models of Murray, WBE and this model ... 45
2.4 Conclusions ... 47
References ... 49
3. Structure and adaption of arteries to pulsatile flow – The case of the
ascending aorta
...
51
3.1 Introduction ... 52
3.2 Blood flow impedance throughout lifetime ... 54
3.3 Pulse frequency and blood flow impedance in the peripheral arteries ... 58
3.4 Optimal design versus actual shape of the arteries ... 59
3.5 The elongation of the ascending aorta ... 62
3.6 Conclusions ... 65
References ... 66
4. Heart rate, arterial distensibility, and optimal performance of the
arterial tree
...
69
4.1 Introduction ... 70
4.2 Microcirculation and Starling forces ... 71
4.3 Heart rate and optimal performance of the arterial tree ... 74
4.4 The cases of the carotid and radial arteries ... 76
4.4.1 Radial artery ... 77
4.4.2 Carotid artery ... 78
4.5 Conclusions ... 78
References ... 79
ix
Nomenclature
A vessel cross sectional area (m2 ) A0, A1, A2 channels parameter (page 38)
aK parameter (page 75)
B parameter (page 38) (m3)
b allometric scaling exponent (Eq. 1.1)
C channel compliance (Pa-1 m3)
D, D0, D1, D2 channels diameter (m)
Dus, D0us, D1us, D2us unstrained channels diameter (page 42 ) (m)
I flow rate (m3 s-1)
ii interstitial space current (m3 s-1)
ici net current from the capillary to the interstitial space (m3 s-1) (page 72)
ilymph lymphatic current (Eq. 4.6) (m3 s-1)
Ir resistive current (Eq. 2.5) (m3 s-1)
Icap capacitive current (Eq. 2.6) (m3 s-1)
Ic capillary current (Eq. 4.2) (m3 s-1)
iv venular end current (Eq. 4.4) (m3 s-1)
K conductance (Pa-1 s-1 m3)
k, k0, k1, k2 channels parameter (Eq. 2.10) (s)
kA constant (page 17) (Pa s)
kB constant (page 24) (Pa-1)
ci
k filtration coefficient from the capillary side (page 72) (Pa-1 m3 s-1)
ic
k filtration coefficient from the interstitial space side (page 73) (Pa-1 m3 s-1) L, L0, L1,L2 channels length (m)
Lc characteristic length (m)
M mass (kg)
N number of branching levels
P pressure (Pa)
Pa pressure at the end of the arteriole (Pa)
Pv pressure at the beginning of the venule (Pa)
R flow resistance ( kg m-4 s-1)
Re Reynolds number
gen
sɺ entropy generation rate (W K-1)
T thermodynamic temperature (K) u mean velocity (m s-1) V channel volume (m3) Vɶ reduced volume V~ =4V/π (m3) Xc capacitive reactance ( kg m-4 s-1) y parameter (page 37)
Y biological parameter (Eq. 1.1)
Y0 normalization coefficient (Eq. 1.1)
x, x0, x1,x2 channels aspect ratio L/D
Z, Z0, Z1, Z2 channels impedance (Pa m-3 s)
Zc capillary impedance (Pa m-3 s)
ZT global impedance (Pa m-3 s)
Greek Symbols
β
,β
0,β
1,β
2 channels distensibility coefficient (Pa-1)γ
parameter (Eq. 4.11a)∆
P pressure drop (Pa)∆
Pc capillary hydrostatic pressure drop (Pa)∆
Pcihydrostatic pressure drop between capillary and interstitial space (Eq.4.1) (Pa)
∆Π
ci oncotic pressure drop (Pa)∆Φ
generic potential difference (Eq. 1.2)η
dynamic viscosity (Pa s)θ
parameter (Eq. 2.22)λ
Lagrange multiplierν
kinematic viscosity (m2 s-1)f heart-rate (s-1)
ξ
asymmetry factorΠ
c capillary oncotic pressure (Pa)xi
ci ic
σ
reflection coefficient from the interstitial space side (page 73)(Pa-1 m3 s-1)τ
characteristic time (s)φ
parameter (Eq. 2.28)χ
parameter (page 40)ω
radial angular frequency (rad s-1)xiii
List of Papers
This thesis includes the following papers:
I. Carla Silva, A. Heitor Reis, ”Scaling relations of branching pulsatile flows”, International Journal of Thermal Sciences, 88, 77-83 (2015).
II. Carla Silva, A. Heitor Reis, ”Structure and adaptation of arteries to pulsatile flow: The case of the ascending aorta”, Medical Physics, 41 (6) 063701 (2014). III.Carla Silva, A. Heitor Reis, ”Heart rate, arterial distensibility, and optimal
performance of the arterial tree”, Journal of Biomechanics, 47, 2878–2882 (2014).
xv
List of Figures
1.1 Simplified scheme representing the organization of the circulatory system (adapted
from [1])... 2
1.2 Simplified scheme representing the organization of blood vessels in the circulatory system (adapted from [1]). ... 3
1.3 (a) dendritic architecture derived from the constructal law. Generation of flow configuration observed in nature: (b) Vegetation – from [16]; (c) Yukon delta (inanimate flow)- adapted from USGS site;(d) blood vessels - adapted from Science Photo Lib; (e) bronchial tree – from [16]; (f) animal locomotion (flying, running and swimming) - adapted from [21]. ... 7
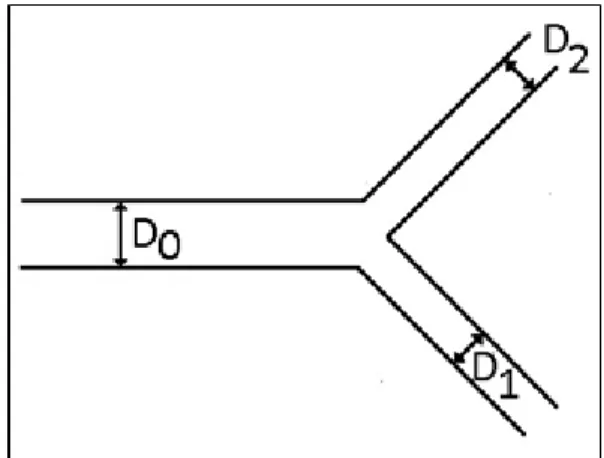
1.4 Representation of a dichotomous branching. ... 12
1.5 Centrifuged Blood Sample (adapted from Wikipédia). ... 12
1.6 Shape of Red Blood Cells at rest (adapted from Wikipédia). ... 14
1.7 Blood viscosity as a function of shear rate (adapted from [34]). ... 15
1.8 Variation of relative apparent viscosity with diameter in microvessel, showing Fahraeus-Lindqvist effect, for different values of hemathocrit (adapted from [3]). ... 15
1.9 Representation of two-element Windkessel model for the arterial system. (a) Conception: peripheral resistance is the sum of the resistances of small arteries, arterioles and capillaries; large arteries (remarkably the aorta) represent compliant part whose total compliance is the sum of the arteries’ compliance [54]; (b) Electrical analog. ... 19
1.10 Aortic Pressure during a heart period ... 19
1.11 Electrical representation of three-element Windkessel model. ... 20
(adapted from [60]). ... 21 1.14 Representation of the effect of the systole and diastole in vessel distensibility. .. 24 1.15 Representation of an RC circuit simulating a vessel. ... 25 2.1 Branching channels with distensible walls (D – diameter; L – length). ... 33 2.2 Channel wall distensibility is accounted for by an analogue to electric capacitance,
while flow resistance is that of Hagen-Poiseuille flow. ... 36 2.3 Pulsatile flow as an analogue to a parallel RC circuit. ... 37 2.4 The effect of the relative characteristic frequencies of parent (
ω
ˆ0) and daughterchannel
( )
ω
ˆ
1 , (withχ ω ω
= ˆ1 ˆ0=0.8, 0.5, 0.3, 1, 1.25, 3.3), on impedance as function of pulse frequency. ... 41 2.5 Daughter to parent unstrained diameter ratios as function of pulse frequency forvarious channel distensibilities for the case when
χ
=
1.25
. ... 43 2.6 Daughter to parent unstrained diameter ratios as function of pulse frequency forvarious channel distensibilities for the case when
χ
=
0.8
... 44 3.1 Impedances of the ascending aorta and the descending aorta between birth andthirty years of age. ... 56 3 2 Impedances of the carotid artery between twenty and sixty years of age. ... 56 3.3 Aorta segments and branches: 95 – ascending aorta; 3 – brachiocephalic; 2 – aortic
arch A; 15 – common carotid; 14 – aortic arch B; 19 – subclavian A; 18 – thoracic aorta A. The numbers identify vessels according to the scheme in ref. [3]. ... 63 4.1 Microcirculation: blood enters the capillary at the arteriolar end (a), water, salts
and colloids are driven into the interstitial space by the capillary gradient, and return into the capillary driven by the oncotic gradient at the venular end (v). .... 72 4.2 Variation of capillary hydrostatic pressure (Pc), interstitial hydrostatic pressure (Pi),
capillary oncotic pressure (ΠΠΠΠc), and interstitial oncotic pressure (ΠΠΠΠi), between
arteriolar (a) and venular (v) ends of the capillary. ΠΠΠΠc increases within the capillary
due to loss of fluid to the interstitial space. Pi and ΠΠΠΠi are constant in the interstitial
xvii
components occurs through the capillary that connects arteriolar and venular ends. ... 74
xix
List of Tables
1.1 Analogy between the concepts, statements, and principles of thermodynamics and constructal theory [26]. ... 10 1.2 Range of blood viscosity values and respective diameter vessel. ... 16 2.1 Diameter scaling between parent and daughter human arterial segments, as observed, and predicted through ψ by the scaling relations defined by Murray's law, WBE model, and present model (see Eq. (2.34))………46 3.1 Arterial impedances (Pa m-3 s) of some peripheral arteries ... 58 3.2 Observed average diameters and lengths of parent (in bold) and daughter vessels
(within brackets), and values of daughter vessels (in italic) for optimal hemodynamic performance. The numbers identify vessels according to the scheme in ref. [3]. (p) -proximal diameter, (d) - distal diameter. ... 61 3.3 Optimal average diameters and lengths of several segments of the aorta taking
thoracic aorta A as the reference. ... 64 4.1 Arterial distensibilities at various heart rates from ref. [6] and parameter <γ> [see.
C
HAPTER
1
Introduction
1.1 Circulatory system as a physical system
The circulatory system consists of a complex network of vessels, organized in a vascular tree, that distribute and drain blood from the different organs and tissues, in order to ensure their respective functions, and maintaining an adequate environment in tissues fluid for optimal survival and function of the cells.
The circulatory system includes the heart that pumps the blood that circulates in a network of vessels covering the entire body allowing for systemic and pulmonary circulations (see Fig 1.1). Its main function is deliver oxygen and nutrients required to sustain metabolism throughout the body and to transport the associated wasted products away. It has to continuously supply blood flow and simultaneously adjust it accordingly to the various demands of the different parts of the organism.
Blood is the fluid that transports the products related to metabolism. It is a complex heterogeneous suspension of blood cells, salts and coloids in liquid plasma, whose physical properties will be developed in §1.5. For more details please see [1].
Heart acts as a pump that creates the pressure gradient necessary to drive blood within vessels. In each contraction it supplies the required energy to maintain blood flow through all tissues in the body. Heart’s left part receives oxygenated blood from the lungs, and pumps it through peripheral organs (systemic circulation), while the right part receives the blood with the wasted products of metabolism and pumps it through the lungs (pulmonary circulation). Heart ensures the connection between systemic and the pulmonary circulations of the cardiovascular system.
Fig. 1.1 Simplified scheme representing the organization of the circulatory system (adapted from [1]).
1.1.1 Cardiac cycle
The network of blood vessels consists of large arteries, smaller arteries, arterioles, capillaries, venules and veins (Fig. 1.2).
Aorta, the largest artery in human body, receives blood under high pressure from the heart’s left ventricle, and delivers it to various part of the organism. Arteries branch into arterioles, which are the last small branches of the arterial system and have the ability to regulate the blood flow through capillaries, accordingly to the needs of the tissues.
It is at the capillary level, that oxygen and nutrients diffuse from the blood into the organs and muscles. As a consequence, blood becomes rich in wasted products (carbon dioxide, urea, creatinine); venules collect it from capillaries, merging gradually together to form veins.
In the last stage of the systemic circulation, the vena cava transports the deoxygenated blood through the heart’s right ventricle, which in turn pumps it into the lungs – pulmonary circulation. Then, at the alveoli, oxygen is exchanged with the carbon dioxide. Blood returns to the left part of the heart, restarting a new cycle. In this mechanism blood passes by both circulations.
Fig. 1.2 Simplified scheme representing the organization of blood vessels in the circulatory system (adapted from [1]).
Cardiac cycle consists then of two phases: the diastole and the systole. During diastole ventricles fill in with blood, while during systole ventricles contract and pump blood out of the heart.
1.1.2 Vessels physiology
Systemic arteries are composed of large arteries, smaller arteries and arterioles. They have a thick wall divided into three concentric layers: the tunicas intima (internal layer), media and adventitia (external layer) [2]. These layers are characterized by their predominant structure and cell types (for more detailed information please see chapter 4 of ref [2]).
Arteries can be subdivided into three groups according to their elastic behavior: elastic, muscular (there are arteries that are intermediate between both types) and arterioles. Elastic arteries, which are the major distributing vessels, have relatively large diameters and are located close to the heart, such as the aorta, the common carotids or the subclavian arteries [3]. They have strong, highly elastic vascular walls, allowing for high velocity blood flow.
Muscular arteries, which comprise the main distributing branches of the arterial tree, are located at the periphery (except in the case of coronary arteries), such as radial or femoral arteries, and are characterized by less elastic walls [2].
Arteriole’s walls are almost rigid and are muscular strong, having the ability of varying blood flow through the variation of the cross-sectional are, accordingly to the different demands of the tissues [1,4].
Arteries’ distensible nature is a fundamental characteristic because it provides the accommodation of heart’s pulsatile cardiac output in systole. The increase in vessel cross section allows for the storage of elastic energy, and consequently a creation of a forward negative pressure gradient, needed to keep blood flow during the diastole.
All along the arterial network, the distensibility of arteries is gradually reduced, leading to a drop in blood pressure. The damping in pulse pressure results then in a smooth continuous blood flow through the arteriolar level.
In contrast to the arteries, capillaries contain no muscle. Their walls are rigid and very thin, having numerous capillary pores permeable to the substances related to metabolism [1,4].
Venous system acts as a reservoir of blood. Because pressure is too low, veins’ walls are thin, but muscular enough to contract or expand, acting as an adjustable reservoir according to the needs of the circulation [1-4].
To conclude this brief introduction, and to make the bridge to the next section, it is important to emphasize that the entire network in the circulatory system is composed of millions of vessels segments with different lengths and diameters, what puts at stake the question that many for long try to answer: is the design of the vascular tree and the way vessels randomly organized, or instead is the result of some kind of optimization that obeys to a physiological or a physical principle, and in such a case calls for quantitative laws to describe the vascular structure?
1.2 Scaling laws
Hereafter, a brief resume is presented that fits these organizations in nature, both from the biological and physiological points of view.
Life is probably the physical system that exhibit more complexity and variety on Earth. It involves more than 27 orders of magnitude, with the metabolic power required to sustain life across that range, covering over 21 orders of magnitude. The variety of forms, processes, and dynamical behaviours found in all living scales, are the result of chemical substances and chemical reactions, common to all living organisms. The processes of synthesis and degradation of nutrients in cells are due to these reactions (cellular metabolism) that are the basis of life, once it allows the growth, maintenance and reproduction of cells, ensuring their structures and adapting to environment [5,6]. In contrast to the variety and complexity of living organisms, is the probably unexpected simplicity of scaling behavior related to fundamental biological processes and covering a wide range of phenomena, and body masses, as well. Scaling laws are the reflection of generic characteristics and physical principles which are independent of specific dynamics or special characteristics of particular systems.
In biology, the observed scaling law obeys to a typically power law of the form [5-8]: = 0 b
Y Y M , (1.1) where Y0 is a normalization coefficient, M is body mass (independent variable), Y is
some observable biological parameter and b represents the allometric scaling exponent. This exponent is verified to be approximately a multiple of ¼. Of the parameters that obey to this scaling law, among others are, metabolic rate, heart rate, growth rate, life span, lengths of aortas, tree height [9-11].
Kleiber (1930) had an important role in the study of basal metabolic rate [12], recoiling data of organisms extending in mass over about four orders of magnitude, concluding in his work that it scales as M¾ for mammals and birds. Since then Kleiber’s Law has been extended to a variety of organisms [7,13].
In order to provide a physical support to the biological empirical laws, the physicist West and the biologists Brown and Enquist, created a model that aims to explain the origin of allometric scaling laws [14]. This model was based in three assumptions: (i) a branching pattern is required along the network, in order to supply the distribution of nutrients through all tissues in the organism; (ii) the size of the smallest element of the network is fixed; (iii) minimization of energy is required in the mechanism of resources
distribution. They argued that “scaling laws arise from the interplay between physical and geometric constraints implicit in these three principles”. The concept of optimizing the pumping power for fluid flow (minimizing resistance to flow) carried out in this model, applied in circulatory and pulmonary systems of mammals resulted in the Kleiber’s Law empirical relation.
Other models have been purposed, based on physical principles namely minimal generation of entropy, maximal generation of entropy, minimization of flow resistance, the three assumptions of West, Brown and Enquist model [15].
1.3 Constructal Theory 1.3.1 Constructal Law
A year before the presentation of West, Bryan and Enquist model, a new theory has been purposed by Adrian Bejan, called Constructal Theory that in its earlier stage was applied to engineering [16].
Interesting here is that for the first time engineers participate in a discussion until then taken between physicists, biologists, zoologists and mathematicians, with a completely different point of view. Bejan says that the basis of his theory has origin in the attempt to solve a problem related to the minimization of thermal resistance between an entire heat generating volume and one point [10]. He found as the optimal solution “a tree network in which every single feature was a result, not an assumption”. He extended his conclusions to every natural (animate and inanimate) tree structure (eg. river basins, lungs, atmospheric circulation) assuming that they are the result of optimization of performance of volume-point flow. This theory somehow suggests that generation of flow configuration in nature (design in nature) is a manifestation of a universal physical phenomenon covered by a principle – Constructal Law – which states that “For a finite-size flow system to persist in time (to live) it must evolve such that it provides greater and greater access to the currents that flow through it” [10]. This means that evolution of the configuration of flow systems is predictable resulting of the way they find to improve their function, distribute imperfections and create geometries, evolving in time to minimum global flow resistance [10]. It is a kind of evolutionary principle based on the increase of flow access in time.
In nature it is not easy to find perfect geometric forms in animate systems. This means that they are far from equilibrium because they are alive. Their physical asymmetry (eg. quasicylindrical channels, quasispherical alveolus) and geometrical asymmetry (unequal distribution of stresses, temperature, pressure), i.e. their imperfections are the proof that they are alive (non-equilibrium) [17]. Despite this, these systems perform well by minimizing and balancing together the resistances found by internal and external streams under the existing global constraints. Therefore the flow system has to be free to morph, i.e. to change its configuration. The evolution of flow architecture is the result of the way that system found to achieve its global purpose under constraints.
The Constructal Law may be useful in two distinct areas: 1) to predict and explain flow configurations in animate and inanimate systems found in nature [see Fig. 1.3(b)-(e)]; 2) to be applied as a physical principle in engineering as a way of creating other architectures [see Fig. 1.3(a)].
Fig. 1.3 (a) dendritic architecture derived from the constructal law. Generation of flow configuration observed in nature: (b) Vegetation – from [17]; (c) Yukon delta (inanimate flow)- adapted from USGS site; (d) blood vessels - adapted from Science Photo Lib; (e) bronchial tree – from [17]; (f) animal locomotion (flying, running and swimming) - adapted from [21].
(c)
(a) (b)
The constructal theory, based on the principle of evolution of configuration generation for greater flow access in time, successfully anticipates the 23-level bifurcation (Fig. 1.3c) of the lung [18], the scaling laws of all river basins [19] and macroscopic features (speed, frequencies, forces) of all types of animal locomotion (running, swimming, flying) [20].
Constructal theory has also been considered in the conception of a model of the long-term behavior of the atmospheric and oceanic circulation (climate), the largest flow system on Earth. For a detailed analysis of the model and results please see [17,22]. This theory has also been considered in an interesting work [23] who aims to describe and predict the formation of different patterns within elements of the same species under distinct hydrodynamics conditions. The study covered stony corals, bacterial colonies and plant roots. Other applications of constructal law to animate and inanimate nature flows and more complete information may be found in refs [10,17,24].
Man-made flow systems (engineering) evolves similarly and are predictable based on the same principle that explains the evolution and architecture of natural flow systems. The increase of heat transfer in systems is one of the most active applications of constructal theory in engineering. A lot of industrial devices, as air conditioners, refrigeration systems, radiators, use a kind of tubes (fined or non-fined) arrangement as heat exchangers. In the design of these heat exchangers some features as the space available in the equipment must be considered. From the constructal theory point of view, the basis of the formulation of the problem is identifying the configuration which provides maximum heat transfer in a confined space.
Other applications of engineering flow configurations with more complete information may be found in refs [10,17,24,25].
1.3.2 Constructal Theory and Thermodynamics
Constructal Law states that if a flow system has freedom to change its configuration, it will show different configurations in time, in order to provide gradually better access routes to the flowing currents. Constructal theory is then assumed as an extension of thermodynamics [26] in the domain of non-equilibrium systems with flow
configuration. Actually let us take the example of an isolated thermodynamic system which has within a partition that suddenly breaks; in the beginning the system is in a state of internal non-uniformity - different parts are submitted to different pressure or temperature. According to the two laws of thermodynamics, this system tends to a state of equilibrium with: 1) no flows of matter or energy; 2) maximum entropy; 3) constant energy. In equilibrium there are no driving forces. Flow configurations in time are unknown. From the thermodynamic point of view the system is a black box. Constructal theory intends to cover the phenomenon of systems’ flow configurations evolution in time, before reaching the state of equilibrium.
Open systems, like biological systems, are permanently in a non-equilibrium state. They are continuously exchanging energy and mass with the environment. Classical thermodynamics does not take in account flow configurations of non-equilibrium systems. From the constructal point of view, currents are organized in order to provide gradually better access routes between inlet and outlet flow currents, making it by minimizing global flow resistance. Bejan and Lorente demonstrated in ref [27] that non-equilibrium flow systems evolve in time toward an equilibrium configuration. They argued that “Equilibrium does not mean that the flow architecture stops changing. On the contrary, it is here at equilibrium that the flow geometry enjoys most freedom to change”.
Thermodynamics studies equilibrium states whereas Constructal Theory studies the evolution of flow configurations towards the equilibrium. Equilibrium states arise from second law whereas equilibrium flow configurations arise from constructal law. This formal analogy between thermodynamics and constructal theory, concerning aspects as their concepts, statements and principles are described in Table 1.1.
Further we can relate entropy generation to constructal law; we note that the common feature shared by flows in nature and engineered systems is that they are both dissipative. These flows generally can be described as:
R=∆Φ
where R is the resistance to flow and
∆Φ
corresponds to the potential driving the current I. These flows generate entropy at the rateS
ɺ
gen= ∆Φ
/
I T
, where T is thermodynamic temperature. The resistance can be expressed asR=Sɺgen2 T
I . (1.3) We can associate the maximization of internal flow access to the minimization of flow resistance. The analysis of Eq. (1.3) allows one to conclude that, at constant I, minimizing flow resistance corresponds to minimizing the entropy generation rate. Conversely, if we fix the forces (
∆Φ
) minimizing the resistance corresponds to maximizing the entropy generation rate [28].In conclusion we can associate generation of entropy to the Second Law, and generation of flow architecture to Constructal Law [17].
Table 1.1 Analogy between the concepts, statements, and principles of thermodynamics and constructal theory [27].
Thermodynamics Constructal Theory
State Flow architecture (geometry, structure)
Process Change of structure
Properties (U, S, Vol, ….) Global objective and global constraints (R, L, V,…)
Equilibrium state Equilibrium flow architecture Fundamental relation U (S, Vol, …) Fundamental relation R (L, V,…) Constrained equilibrium states Nonequilibrium architectures Removal of constraints Increased freedom to morph Energy minimum principle:
U minimum at constant S and Vol S maximum at constant U and Vol
Constructal principle (maximization of flow access):
R minimum at constant L and V V minimum at constant R and L L maximum at constant V and R
To complete §1.3 it should be noted that Constructal Law covers the three postulates of West et al. model [14]. Constructal theory is able to explain a broad diversity of flow architectures found in nature [21] – river basins, animal locomotion, turbulence – that stay out of the domain covered by West et al. model. Murray’s Law (see §1.4), a scaling law applied to dichotomous branching is also consequence of the application of Constructal Law to engineered systems [29].
Constructal Theory can be naturally assumed as a unifying principle that introduces the concept of “designedness” in nature not covered by first physical principles, and reveals be able to explain animate and inanimate flow configurations. Applied progress made based on this theory, with emphasis on the last decade may be found in ref [30].
1.4 Murray’s Law
A special class of scaling laws was studied by Murray. In 1926, he proposed a principle of minimum energy dissipation to explain the relation between diameters (father and daughter channels) in dichotomous branching.
He assumed that the quantitative statement which includes the physiologic organization concept is a principle that states “that the cost of operation of physiological systems tends to be a minimum” [31-33]. Based on the principle of minimum work and balanced cooperation of the organs in the body, Murray’s law states that “the cube of the radius (or equivalently the diameters) of a parent vessel equals the sum of the cubes of the radii of the daughters”, applied to bifurcation channels with non-turbulent flows:
3 3 3
0 1 2
D =D +D (1.4) where D0 is parent vessel diameter and D1 e D2 stands for the diameters of daughter
vessels (Fig. 1.4).
This law was firstly applied to circulatory and respiratory system, but later studies show that it holds for every branching laminar flow [10,29,33].
Based on Constructal theory and considering Murray Law, Reis et al. [18] have successfully anticipated the verified 23-level bifurcation of the lungs. Also Wechsatol et al. [34] used Murray Law to find the optimal tree-shaped networks for fluid flow in a disc-shaped body, related to components of electronic cooling.
This scaling law is also a consequence of Constructal Law [21].
1.5 Blood flow characteristics
As seen before, in the circulatory system blood transports nutrients through the body tissues and then removes the associated waste products. It has to flow through a complex vascular network, in which diameters vary from approximately 3 cm in the aorta, down to about 6 µm at the capillary level.
Fig. 1.5 Centrifuged Blood Sample (adapted from Wikipédia). Fig. 1.4 Representation of a dichotomous branching.
A flow rate has to be kept in circulation in order to guarantee the organism necessities. This rate strongly depends on, among others, the flow properties of the blood and its constituent characteristics.
Blood is a suspension of plasma and cells. Plasma is a dilute electrolyte solution that makes up about 55% of whole blood volume in a normal human body; it contains minerals, glucose, proteins, hormones and carbon dioxide. Plasma serves as a protein reserve of human body. The remaining 45% are occupied by blood cells such as red blood cells (RBC - nearly 95% of whole cells), white blood cells (WBC - less than 0.15%) and platelets (5%) (see Fig. 1.5) [2].
Red blood cells are dominant making up 40% by volume of whole blood. White blood cells and platelets occupy less than 1%.
The high concentration of red blood cells is very important from the rheological point of view, especially due to the properties of these cells [35]. They are small semisolid particles, which are highly deformable [36]. At rest, red blood cells look like biconcave disks with a mean diameter of about 8.5 μm and a thickness of 2.5 μm (see Fig. 1.6) at the thickest point and about 1.0 μm or less in the center [1].
They can pass through capillaries of diameter 5.0 μm, due to the flexibility of their membrane.
1.5.1 Blood rheology
Blood rheological properties are determined by its constituents. Blood viscosity depends on existing shear forces and is a function of: 1) hematocrit (volume percentage of RBC in blood); 2) plasma viscosity; 3) RBC aggregation and 4) RBC mechanical properties [37].
As a consequence of experimental data (see Fig 1.7), it was found that, in healthy conditions, bloods exhibits shear-thinning behavior, i.e. blood viscosity decreases to a minimum value with increasing shear rates, while it is higher at low shear rates [38,39].
Fig. 1.6 Shape of Red Blood Cells at rest (adapted from Wikipédia).
Blood behaves as a Newtonian fluid at high shear rates above 100 s-1, with viscosity of
about 4 to 5 Pa.s ×10-3, at a normal hematocrit of 45% at 37 ºC [37,40]. At shear-rates below 100 s-1, blood viscosity increases exponentially with decreasing shear rate (see
Fig 1.7) [38].
Blood viscosity behavior is explained based on RBC properties. They are highly deformable and therefore might change their shape under shear forces, in order to adapt to flow conditions (bulk flow or microcirculation); they squeeze through capillaries, having the ability to deform in almost any shape [1, 2].
Another property of normal RBCs is their particular tendency to aggregate in rouleaux (linear arrays) disposed like stacks of coins [2,35,41], behaving like a solid. The size of these aggregates is inversely proportional to shear forces having a strong influence in the definition of blood viscosity.
So, at higher shear-rate these aggregates tends to break down and RBCs orient in the direction of the flow and consequently viscosity is lower. On the other hand, at low shear-rate and under low flow or almost static conditions, there is a trend of RBCs to aggregate, resulting in the disturbance of blood flow streamlines, increasing viscosity to higher values [1,2,35].
Some studies concluded another blood property related to the reduction of its apparent viscosity as the tube diameter becomes smaller [42]. Farhaeus and Lindqvist performed experiments with blood at high shear rates and verified that apparent viscosity is lower in small tubes when compared to larger tubes [41,43].
Fig. 1.7 Blood viscosity as a function of shear rate (adapted from [35]).
This reduction in blood viscosity with decreasing vessel diameter reaches a minimum value around 6 to 8 µm; as the diameter becomes even smaller viscosity increases abruptly (see Fig 1.8) [42,44]. This is called Fahraeus-Lindqvist effect, and has its physical reason based on the formation of a cell-free layer near the tube wall, so that RBCs move along the central region, resulting in the decrease of flow resistance [35,41,45].
Actually, since red blood cells are small semisolid particles, they affect the viscosity and the behavior of the fluid. Blood viscosity is not constant at all flow rates and exhibits mostly non-newtonian behavior at the microcirculatory level.
Fig. 1.8 Variation of relative apparent viscosity with diameter in microvessel, showing Fahraeus-Lindqvist effect, for different values of hemathocrit (adapted from [2]).
However, in most arteries, where diameter is large compared to the RBCs size (diameter exceeding 1 mm), blood is usually exposed to high shear-rates (above 100s-1) and hence the non-Newtonian effects which are relevant at low shear-rates, disappear [46,47]. This condition, therefore excludes arterioles, venules, and capillaries, once they are generally considerably less than 1 mm in diameter. In tubes with diameter less than 1 mm, blood viscosity is dependent on shear-rate [2].
It is clear that blood viscosity depends on shear-rate. Since the most available information includes data of blood viscosity as a function of shear-rate, and our modeling of the arterial tree (§3) requires the assignment of a viscosity to each vessel diameter, we adopt the values in table 1.2 based on data in ref [48]. On our work we assign a shear-rate to a diameter and so a diameter to a viscosity.
Table 1.2 was drawn on the basis of an estimate, that introduces little inaccuracy but which doesn’t affect directly the final conclusions, once that with our work we intend to analyse trends of the circulatory system, not to obtain accurate values.
1.5.2 Reynolds number
The Reynolds number (Re) is used in order to predict the flow regime (laminar or
turbulent) that is associated with blood flow in arteries, through the expression:
ρ
η
= e uD R . (1.5)In healthy conditions, we can calculate Re, associated with a large artery, by
considering the order of the values involved: blood density ρ∼103kg m , blood -3 average velocity u∼10−1ms-1, vessel diameter
D
∼
10
-2m
, and blood dynamic viscosityη
∼10-3Pa s. Therefore, Reynolds number is of order Re ∼103.Table 1.2 Range of blood viscosity values and respective diameter vessel.
Diameter (mm) Blood Viscosity (Pa.s×10-3)
> 10 4 – 6
5 – 10 6 – 9
This result enables us to assume that in normal conditions blood flow in large arteries is typically laminar. Downstream in arterial tree, flow regime remains laminar as can be verified through Eq. (1.5). Actually, Reynolds number varies proportionally to D and u, which both decrease as arteries become smaller. Furthermore blood viscosity increases, resulting in a Reynolds number smaller than 103, therefore ensuring a laminar flow regime at almost arteries in healthy conditions.
1.5.3 Hagen-Poiseuille Equation
For simplicity we consider Navier-Stokes equation applied to a unidirectional blood flow:
ν
ρ
∂ + = − + ∂ 1 . grad u grad P u u u lap t . (1.6)We conclude that for the case of pulsatile blood flow in humans, the terms ∂u/∂t and u
grad .
u are about one and two orders of magnitude smaller, respectively, than the remaining terms in Eq. (1.6). Therefore, at a first approximation their contribution may be discarded. For detailed discussion of this point please see §3.2.
Blood flow is then determined by: (i) the pressure gradient developed in the vessel (driving force); (ii) the friction force (brake) developed in the flow within the vessel. From the previous analysis, we may consider the simplest model of steady laminar flow i.e. the Hagen-Poiseuille equation applied to an axisymmetric flow in a circular tube (vessel) of diameter D and length L that reads:
= −1 4 ∆
A D
I k P
L , (1.7) where I is the flow rate,
k
A=
128 /
µ π
is a constant,µ
is dynamic viscosity and ΔP ispressure gradient along the vessel.
Making an analogy to Ohm’s Law I= ∆P/R , one concludes from Eq. (1.7) that the resistance to flow is
R=kA L4
We can verify that blood flow resistance increases with dynamic viscosity and decreases with diameter fourth-power. Clogging of an artery resulting in decrease of diameter leads to enormous increase in flow resistance, with bad consequences to the performance of the circulatory system.
1.6 Models of the circulatory system
In this section we aim to give a brief description of some models that have been developed to simulate blood flow in the cardiovascular system, and also their advantages and disadvantages. As reviewed in §1.1, the cardiovascular system consists of heart, systemic and pulmonary circulations (blood vessels), and has associated nervous and biochemical regulators which may alter vessel parameters (eg. distensibility, vessel diameter) as a way of regulating the variables of the system (pressure blood, flow rate), according to the needs of organism different parts (organs). The study and conception of cardiovascular models is an important tool, which reveals to be helpful in the understanding of the complex interactions and physiological functions permanently occurring in the human body [1].
Over time many models of the cardiovascular system have been developed [2,49] to study either single arteries or the circulatory of specific organs.
These models are usually described by a set of mathematical equations relating some of the variables of the system, which in turn are dependent of the parameters of the system, as blood viscosity, vessel dimensions, distensibility, which are almost impossible to measure.
The arterial system may be modelled by means of lumped models [50,51], distributed models [52,53] and tube models [54].
1.6.1 Lumped models (Windkessel model)
The Windkessel model is the most popular lumped parameter or simplified model. When applied to arterial system it has several applications [49,56,57], namely as a way to understand some functions of the cardiovascular system, to predict some arterial parameters and to derive aortic flow from arterial pressure.
Fig. 1.9 Representation of two-element Windkessel model for the arterial system. (a) Conception: peripheral resistance is the sum of the resistances of small arteries, arterioles and capillaries; large arteries (remarkably the aorta) represent compliant part whose total compliance is the sum of the arteries’ compliance [55]; (b) Electrical analog.
These kind of lumped models describe the whole arterial system as a function pressure - flow rate, staying out of this analysis the phenomena that occur within the arterial system, such as wave travel or reflection of waves [55], see Fig. 1.9.
This model has successfully anticipated some results related to aortic pressure in function of time [55], see Fig. 1.10. More specifically it was found that in the diastole (when the aortic valve is closed) pressure decays exponentially with a characteristic time decay (τ=R C). He succeed to derive cardiac output and to estimate the total
peripheral resistance [56].
This model has the disadvantage of neglecting either the resistance of large arteries either the compliance of the smaller vessels, introducing a rough approximation. It fails to explain the pressure abruptly variation during systole [55].
Fig. 1.11 Electrical representation of three-element Windkessel model.
A few years later (in the 1930s), and as a way to improve the two-element model, some researchers proposed the consideration of a third element, the characteristic impedance of the aorta (Zc). This new term takes in account the local inertia and local
compliance of the proximal ascending aorta, on the bases of wave transmission theory (for more detailed information please see [56]).
Zc is connected in series as represented in Fig. 1.11, where is showed an electrical
analog of three-element Windkessel model.
The consideration of the third element improves the behavior of the model in the range of high frequencies [2,56]. This lumped model is very popular and is often considerate in the modeling of the systemic circulation.
The proposal of introducing a fourth element to this model [58], was intended as a way of reducing some errors introduced by the characteristic impedance at low frequencies. An inertial term (L) was introduced in parallel with the characteristic impedance (see Fig. 1.12).
This element represents the sum of the inertances associated to the arterial segments. Thus, total inertance and total compliance of the arterial system, corresponds to each arterial segment, while in the previous model the characteristic impedance was only associated to proximal ascending aorta [55]. Westerhof et al. [58] concluded that this model was better than the three-element, as a lumped model of the systemic circulation or as a model to estimate vascular properties.
Fig. 1.12 Electrical representation of fourth-element Windkessel model.
1.6.2 Distributed models and tube models
Windkessel models give a general description of the arterial tree as a whole, therefore not allowing the study of pressure or flow wave propagation along the vascular tree. Modelling the phenomena of wave propagation in the arterial system requires the use of tube models or distributed models [56].
Distributed models account to the detailed vascular geometry. Basis of these models is formed by breaking up the arterial tree into several segments (see Fig. 1.13) of known geometry and mechanical properties [59]. The description of the wave transmission characteristics related to each arterial segment, may be described using Womersley oscillatory flow theory or electrical transmission line theory (for more detailed information please see [59] and chapter 8 of [56]). These models can also be based on the Navier-Stokes equations for the conservation of mass and momentum, in one-dimension form, written as a function of pressure, blood flow and cross sectional area, and can be solved by using different numerical techniques [56].
Fig. 1.13 Representation of the human arterial tree. Each segment represents an artery (adapted from [60]).
These models provide good descriptions of the arterial system, for the reason that they consider the geometry of each vessel and the general anatomy. Distributed models enable the study of aortic impedance and the factor determining it [59]. They also allow the understanding of pressures and flows in different parts of the organism [56]. These models have the disadvantage of requiring a wide number of parameters related to geometry and elasticity of each segment, becoming a little limited.
Another kind of model which reveals to be simple and with the advantage of considering the phenomena of wave propagation, is the single tube and the asymmetric T-tube models [56, 60]. They prove to be much easier to translate into a code when compared to the geometrically exact models [59].
Single tube models consider the combination of a tube representing the aorta connected to a peripheral resistance or Windkessel (as a model of the peripheral beds). The simplicity of this model has its main drawback when considering that all distal reflections came from a single point [56].
On the other hand, asymmetric T-tube models seem to better describe the arterial tree in terms of aortic input impedance and wave reflections [56]. They consist of two parallel tubes: a short one accounting the arterial tree related to head and arms, and a long one with larger size representing the thoracic and abdominal aorta and their branches including the legs [56]. The two tubes terminate either with a resistance of the terminal bed.
The choice of the model depends on whether is the detailed required or its main purpose. Distributed models are commonly used as analytical tools once they are realistic in the simulation of a wide of physiological and pathological situations. They allow the estimation of parameters of arterial tree based on in vivo data [61]. Lumped models are adopted namely to understand the influence of total arterial compliance on integrated quantities, as aortic pressure or cardiac output [55].
In next section it is presented our modelling of the circulatory system, as well as its main features and the purpose of its application.
1.7 Modelling of the circulatory system used in this thesis
The definition of our model of the circulatory system is based on Constructal Theory. Constructal method consists of optimization of the system at every scale, i.e. by optimizing performance by vessel to vessel we reach optimization of the overall system. As stated by constructal law, the method proceeds from the simple to the complex, so the starting point is the optimization of the element and then, step by step, towards optimization of the global system.
Our modelling consists of representing each vessel by a RC model. Although some models of the circulatory system referred at §1.5.3 are based on RC models, our purpose is quite different once we intend to optimize the arterial tree by starting from each element (vessel). In almost available models the resistance or capacitance values results of some kind of vessel network, which is distinct from ours in which each single artery is represented by a RC model.
As stated in §1.1, blood vessels are generally more or less distensible, which reveals to be an important property. Actually, due to the high resistance to flow observed in microcirculation (blood flow in capillaries and the interstitial space) a relatively high perfusion pressure is required for the transport of blood, that can be achieved only if the vessels’ walls are elastic therefore avoiding heart´s overloading due to pumping [61,63].
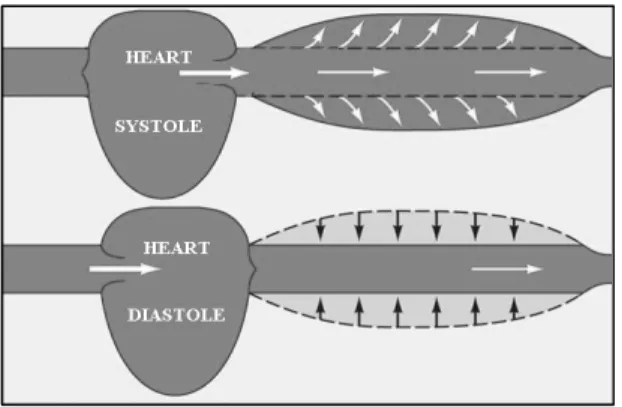
Blood flow in the arterial tree is markedly pulsatile. The cardiac cycle, represented in Fig. 1.14, consists of two distinct parts: 1) systole corresponding to blood pumping out of the heart, while ventricles contract; 2) diastole during which ventricles fill with blood.
The distension of the arterial wall during the propagation of the peak of the pressure wave, thereby increasing the cross section of the vessel and lowering the resistance, also allows storage of elastic energy, which makes it possible the maintenance of a negative pressure gradient along the vessel, needed to keep the flow in the diastole.
Fig. 1.14 Representation of the effect of the systole and diastole in vessel distensibility.
Then, vessel distensibility is a relevant parameter in the formulation of our model. In this way we define the capacitance of storage or vascular capacitance C as the linear relationship between volume variation and pressure variation, i.e.
C=dV
dP (1.9)
We further define the distensibility coefficient
β
=A−1(
dA dP)
, where A stands for the channel cross sectional area.Considering a cylindrical vessel of diameter D and length L, the respective volume is
π
= 2 / 4
V D L . The capacitance or compliance may be expressed asC=( / 2)
π
DL D P(
∂ ∂)
By simplifying the expression, we can writeβ
=( )(
2 D ∂ ∂D P)
. Then the compliance of the vessel [Eq. (1.9)] can be expressed as a function of distensibility coefficient β as:C=k D LB 2 , (1.10)
where kB is a constant (kB=
πβ
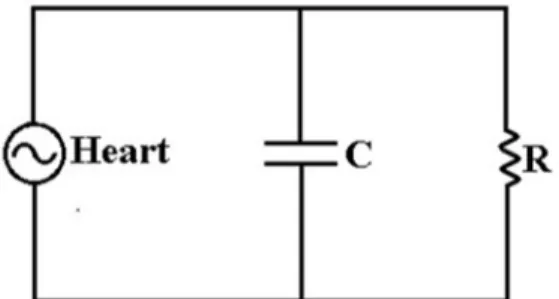
/ 4).Because it combines the effect of the usual resistance with the capacitive effect of the vessel walls, we found that an equivalent parallel RC circuit, Fig. 1.15, is the most suitable model for describing pulsating flow.
Following the discussion in §1.5.3, we identify the value of resistance with that of Poiseuille flow [Eq. (1.8)] while the capacitance part is defined by Eq. (1.10). In the representation of Fig. 1.15 the capacitor discharge corresponds to the artery elastic recoil that “pushes” the flow at diastole.
Fig. 1.15 Representation of an RC circuit simulating a vessel.
The RC circuit total impedance Z is given by,
1 = +1 1
c
Z R X , (1.11)
where R is resistance to flow and Xc =1 / ( iωC ) is capacitive reactance (C is
capacitance and
ω
angular pulse frequency). Therefore Eq. (1.11) reads,1 = +1 i Cω
Z R . (1.12)
The modulus of the impedance is then, ω = + 2 2 2 1 R Z R C , (1.13) where = −4 A R k L D , C=k D LB 2 with kA=128 /
µ π
and kB=πβ
/ 4.Though D is a function of time, here it stands for the average of D over a cycle.
This model will be applied to the human arterial tree to enable the study of the arteries’ behavior under pulsatile flow.
1.8 Outline of the thesis
This thesis is composed of five chapters, and includes three papers that have been submitted to scientific journals. Chapter 1 is a general introduction to the thesis, where concepts and theories related to the circulatory system, blood rheology, Constructal Theory and some cardiovascular system models, are briefly presented. Chapter 2 presents the development of a model of a pulsatile flow system aiming at finding the respective scaling laws viewed as extensions of Murray’s Law for continuous flow. Each channel in the system network is represented as a
resistive-capacitive model (RC), and its resistance to flow is approached in terms of a mean impedance (impedance modulus). Hereafter, we define the total impedance modulus to flow of a dichotomous branching of cylindrical channels. Based on Constructal theory, the global impedance of the channels that converge in a bifurcation is minimized under constant global volume of the flow tree, and then with the additional condition of minimization under constant pressure head. The main objective is to define the optimal scaling laws of diameters and lengths of branching cylindrical channels, and to interpret the results both by comparing with Murray’s law, and by analysing the effects of distensibility on the optimal performance of the system.
In chapter 3 the previous developed model will be applied specifically to the human arterial tree with the aim of understanding the behaviour of some arteries in different aspects, namely their impedance during lifetime and the influence of heart rate on impedance. In the light of the developed model, it will be also carried out the study of some arterial segments, namely to investigate if its structure is optimized relatively to blood flow, and then comparing the results with observed data. Finally an interpretation of the verified lifelong elongation of the ascending aorta is presented. The whole study is carried out with data of healthy subjects.
Chapter 4 presents an explanation to the observed reduction of arterial distensibility with heart rate, in the radial and carotid arteries, based on the model developed in chapter 2. The main purpose is actually to explore once again the applicability of this model to the human arterial tree, by using observed physiological data found in literature.
Chapter 5 presents the general conclusions of the work developed in this thesis. In the end of each chapter of this thesis the respective bibliography is presented.
References
[1] A. C. Guyton, and J. E. Hall, Textbook of Medical Physiology, 11th ed., Elsevier Saunders, Pennsylvania (2006).
[2] W. W. Nichols, M. F. O’Rourke, C. Vlachopoulos, McDonald’s Blood Flow in
Arteries Theoretical - Experimental and Clinical Principles, 6th ed., Hodder Arnold,
[3] Lauralee Sherwood, Fundamentals of Human Physiology, 4th ed., Brooks/Cole, Cengage Learning (2012).
[4] J. R. Levick, An Introduction to Cardiovascular Physiology, 2nd ed, Butterworth-Heinemann Ltd., Oxford (1995).
[5] G. B. West, “The Origin of Universal Scaling Laws in Biology”, Physica A, 263: 104 – 113 (1999).
[6] K. Schmidt-Nielsen, Scaling: Why is Animal Size so Important, Cambridge University Press, Cambridge, (1984), 7-29.
[7] K. J. Niklas, Plant Allometry: The Scaling of Form and Process, Univ. of Chicago Press, (1994), chapter 1.
[8] V. M. Savage, J. F. Gilooly, W. H. Woodruff, G. B. West, A. P. Allen, B. J. Enquist and J. H. Brown, “The predominance of quarter-power scaling in biology”, Functional Ecology, 18: 257–282 (2004).
[9] G.B. West, J. H. Brown, “Life’s universal scaling laws”, Physics Today, 36–42 (2004).
[10] A. Bejan, Shape and Structure, from Engineering to Nature, Cambridge University Press, (2000).
[11] G. B. West, W.H. Woodruff, J.H. Brown, “Allometric scaling of metabolism from molecules and mitochondria to cells and mammals”, Proc. Nat. Ac. Sci. U. S. A., 99: 2473-2478 (2002).
[12] Max Kleiber, “Body size and metabolism”, Hilgardia 6: 315–353 (1932).
[13] John Prothero, “Scaling of energy metabolism in unicellular organisms: a re-analysis”, Comp. Biochem. Physiol., 83A (2), 243-248 (1986).
[14] G.B. West, J. H. Brown, B. J. Enquist, “A general model for the origin of allometric scaling laws in biology”, Science, 276: 122–126 (1997).
[15] A. Bejan, S. Lorente, “The constructal law of design and evolution in nature”, Phil. Trans. R. Soc. B, 365: 1335–1347 (2010).
[16] A. Bejan, “Constructal-theory network of conducting paths for cooling a heat generating volume”, Int. J. Heat Mass Transfer, 40: 799–816 (1997).
[17] A. H. Reis, “Constructal Theory: From Engineering to Physics, and How Flow Systems Develop Shape and Structure”, Appl. Mech. Rev, 59: 269-282 (2006). [18] A. H. Reis, A. F. Miguel, M. Aydin, “Constructal theory of flow architecture of the
[19] A. H. Reis, “Constructal view of scaling laws of river basins”, Geomorphology 78: 201–206 (2006).
[20] A. Bejan, J. H. Marden, “Unifying constructal theory for scale effects in running, swimming and flying”, Journal Theoretical Biology, 209: 238–248 (2006).
[21] A. Bejan, J. H. Marden, “The constructal unification of biological and geophysical design”, Physics of Life Reviews, 6: 85-102 (2009).
[22] A. H. Reis, A. Bejan, “Constructal theory of global circulation and climate”, Int. J. of Heat and Mass Transfer, 49: 1857–1875 (2006).
[23] A. F. Miguel, “Constructal pattern formation in stony corals, bacterial colonies and plant roots under different hydrodynamics conditions”, Journal of Theoretical Biology, 242: 954-961 (2006).
[24] A. Bejan and S. Lorente, Design with Constructal Theory, Wiley Hoboken (2008). [25] A. Bejan, S. Lorente, “Constructal theory of generation of configuration in nature
and engineering”, Journal of Applied Physics, 100: 041301-1 - 041301-23 (2006). [26] A. Bejan, Advanced Engineering Thermodynamics, 2nd ed. Wiley, New York
(1997).
[27] A. Bejan, S. Lorente, “The constructal law and the thermodynamics of flow systems with configuration”, Int. J. of Heat and Mass Transfer, 47: 3203–3214 (2004).
[28] A. H. Reis, “Use and validity of principles of extremum of entropy production in the study of complex systems”, Annals of Physics, 346: 22-27 (2014).
[29] A. Bejan, L. A. O. Rocha, S. Lorente, T- and Y-shaped constructs of fluid streams, International Journal of Thermal Sciences, 39: 949–960 (2000).
[30] A. Bejan and S. Lorente, “Constructal law of design and evolution: Physics, biology, technology, and society”, J. Appl. Phys., 113, 151301 (2013).
[31] C. D. Murray, “The Physiological Principle of Minimum Work. I. The vascular system and the cost of blood volume”, Proc. Nat. Ac. Sci. U. S. A., 12 (3): 207–214 (1926).
[32] C. D.Murray, “The Physiological Principle of Minimum Work. II. Oxygen exchange in capillaries”, Proc. Nat. Ac. Sci. U. S. A., 12 (5): 299–304 (1926).
[33] T. F. Sherman, “On connecting large vessels to small: The meaning of Murray's Law”, The Journal of General Physiology, 78 (4): 431–453 (1981).
[34] W. Wechsatol, S. Lorente, A. Bejan, “Optimal Tree-Shaped Net- works for Fluid Flow in a Disc-Shaped Body”, Int. J. of Heat and Mass Transfer, 45(25): 4911– 4924 (2002).
![Fig. 1.1 Simplified scheme representing the organization of the circulatory system (adapted from [1])](https://thumb-eu.123doks.com/thumbv2/123dok_br/15200515.1018049/26.892.339.520.88.474/fig-simplified-scheme-representing-organization-circulatory-adapted.webp)
![Fig. 1.2 Simplified scheme representing the organization of blood vessels in the circulatory system (adapted from [1])](https://thumb-eu.123doks.com/thumbv2/123dok_br/15200515.1018049/27.892.320.569.82.484/simplified-scheme-representing-organization-blood-vessels-circulatory-adapted.webp)
![Table 1.1 Analogy between the concepts, statements, and principles of thermodynamics and constructal theory [27]](https://thumb-eu.123doks.com/thumbv2/123dok_br/15200515.1018049/34.892.118.781.642.1051/table-analogy-concepts-statements-principles-thermodynamics-constructal-theory.webp)
![Fig. 1.8 Variation of relative apparent viscosity with diameter in microvessel, showing Fahraeus-Lindqvist effect, for different values of hemathocrit (adapted from [2])](https://thumb-eu.123doks.com/thumbv2/123dok_br/15200515.1018049/39.892.256.697.725.1077/variation-relative-viscosity-microvessel-fahraeus-lindqvist-different-hemathocrit.webp)


![Fig. 1.13 Representation of the human arterial tree. Each segment represents an artery (adapted from [60])](https://thumb-eu.123doks.com/thumbv2/123dok_br/15200515.1018049/45.892.362.553.867.1130/fig-representation-human-arterial-segment-represents-artery-adapted.webp)