WORKING PAPER SERIES
CEEAplA WP No. 29/2011
A Dynamic Analysis of Repeat Visitors
Ana Isabel Moniz
A Dynamic Analysis of Repeat Visitors
Ana Isabel Moniz
Universidade dos Açores (DEG e CEEAplA)
Working Paper n.º 29/2011
Dezembro de 2011
CEEAplA Working Paper n.º 29/2011 Dezembro de 2011
RESUMO/ABSTRACT
A Dynamic Analysis of Repeat Visitors
This paper introduces the Dynamic Probit model to analyse the underlying reasons behind repeat visits to the Azores Islands. The advantage of the model is that it allows investigating for lags in the covariates as well as for endogeneity in the covariates enabling a more accurate view of the repeat visits phenomenon in a specific tourism island destination. From the model estimation it is clear that the number of visits to the Azores Islands is a time effect that should be analyzed only with dynamic models permitting to identify persistent variables that attract the repeat tourists. The repeat tourist is supported by multiple variables such as overall satisfaction with the destination and specific satisfaction with destination attributes. However, the most important covariates are the destination attributes that are the persistent attractors of the repeat visitor. Related policy implications are derived.
KEYWORDS: repeat visitor; dynamic probit model; destination attributes; tourist
satisfaction; destination management.
Ana Isabel Moniz
Universidade dos Açores
Departamento de Economia e Gestão Rua da Mãe de Deus, 58
A Dynamic Analysis of Repeat Visitors
Ana Isabel Moniz
University of the Azores and Centre of Applied Economics Studies of the Atlantic (CEEAplA), Rua da Mãe de Deus, 9501-801 Ponta Delgada, Portugal. Email: [email protected].
ABSTRACT: This paper introduces the Dynamic Probit model to analyse the
underlying reasons behind repeat visits to the Azores Islands. The advantage of the model is that it allows investigating for lags in the covariates as well as for endogeneity in the covariates enabling a more accurate view of the repeat visits phenomenon in a specific tourism island destination. From the model estimation it is clear that the number of visits to the Azores Islands is a time effect that should be analyzed only with dynamic models permitting to identify persistent variables that attract the repeat tourists. The repeat tourist is supported by multiple variables such as overall satisfaction with the destination and specific satisfaction with destination attributes. However, the most important covariates are the destination attributes that are the persistent attractors of the repeat visitor. Related policy implications are derived.
KEYWORDS: repeat visitor; dynamic probit model; destination attributes; tourist satisfaction; destination management.
Introduction
Repeat visits are a main issue in tourism destination management, since they represent client destination loyalty. Repeat tourists are generally those who are satisfied with the destination (Kozak, 2001), insensitive to price (Alegre and Juaneda, 2006), familiar and comfortable with the destination, and have a positive image towards the destination (Milman and Pizam, 1995; Hong et al., 2009). Over the past three decades, considerable research has dealt with the topic of repeat visitation (Mazursky, 1989; Milman and Pizam, 1995; Court and Lupton, 1997; Sönmez and Graefe, 1998; Oh, 1999, Baker and Crompton, 2000; Kozak and Rimmington, 2000; Kozak, 2001; Bigné et al., 2001; Bowen, 2001; Caneen, 2003; Pritchard, 2003; Um et al., 2006). In general, most studies indicate that repeat visitation is positively explained by tourist satisfaction, since a satisfied tourist is more likely to return to a particular destination, or to recommend it to others (Kozak and Rimmington, 2000; Kozak, 2001). The present research aims to analyze repeat visits in the Azores islands using data from a questionnaire to tourists who visited the Azores that enables to analyze repeat tourists satisfaction with a dynamic probit model (Stewart, 2006).
The motivation for the present research is the following. First, it aims to contribute to the above literature by analyzing the sources of repeat visits to the Azores Islands. This archipelago of nine islands is an autonomous region of Portugal and one of the seven ultra-peripheral regions of the European Union. It focuses on different covariates, including the tourists’ socio-demographic characteristics and income, destination attributes and trip satisfaction. Second, the methodology used in this paper also innovates on other related studies in the literature since it adopts a dynamic probit model not previously adopted in tourism research. The paper estimates two probit models for comparative purpose, a static and a dynamic one. Finally, the present
research aims to call the attention of the research for the importance to adopt dynamic models in tourism research enabling a more accurate characterization of the process analyzed.
Literature Review and Methodology
Literature Review
Repeat visitation is a persistent issue in tourism research (Mazursky, 1989; Milman and Pizam, 1995; Court and Lupton, 1997; Sönmez and Graefe, 1998; Oh, 1999, Baker and Crompton, 2000; Kozak and Rimmington, 2000; Kozak, 2001; Bigné et al., 2001; Bowen, 2001; Caneen, 2003; Pritchard, 2003; Um et al., 2006; Barros and Assaf, 2011; Assaf et al., 2011). In general, most studies indicate that repeat visitation is positively explained by tourist satisfaction, since a satisfied tourist is more likely to return to a particular destination, or to recommend it to others (Kozak and Rimmington, 2000; Kozak, 2001). The intention to return can also be influenced by motivation factors such as comfortability or familiarity with a particular destination (Mannell and Iso-Ahola, 1987, Dunn Ross and Iso-Ahola, 1991). Being a repeat visitor is an important criterion to identify tourists who are likely to experience longer stays (Menezes et al., 2008; Barros and Machado, 2010). With a more favorable destination image, the likelihood that a visitor will be satisfied with a destination and consider future visits is higher (Cooper et al., 1993; Ashworth and Goodall, 1988; Bigné et al., 2001; Lee et al., 2005). Other factors identified as important in explaining a visitor’s intention to return include the attributes and facilities of a particular destination (Woodside and MacDonald, 1994).
The literature is also rich in terms of the methodologies proposed to analyse repeat visitors. The model used in this paper aims to explain the concept of repeat visitation as
expressed by the number of times a tourist has visited the destination. Our model is part of the choice set models’ family, originally proposed by Spiggle and Sewall (1987) in the consumer behavior literature, and introduced to the tourism literature by several studies (Crompton, 1979; Woodside and Lysonski, 1989; Um and Crompton, 1992; Crompton and Ankomah, 1993; Woodside and MacDonald, 1994; Opperman, 1997, 1998; Kozak and Rimmington, 2000; Petrick et al., 2001; Woodside and Dubelaar, 2002; Sirakaya and Woodside, 2005; Alegre and Cladera, 2006; Alegre and Juaneda, 2006; Chen and Tsay, 2007; Weaver et al., 2007 and Hong et al., 2009).
Examples of tourism studies that use the binomial logit model include Fleischer and Pizam (2002) who determined the constraints of senior Israeli tourists; De la Viña and Ford (2001) who described the demographic and trip factors of potential cruise passengers based on a sample of individuals who previously requested travel information; Costa and Manente (1995) who investigated the characteristics of visitors to the city of Venice with respect to their origin and socio-economic profile, their preferences and their holiday decisions; Sheldon (1995), who examined the travel incentive among U.S. corporations; and Stynes and Peterson (1984), who proposed a logit model to estimate recreational choices. Kockelman and Krishnamurthy (2004) proposed a micro-economically rigorous method to characterize travel demand across a great variety of choice dimensions, including trip generation. Their study applied a multivariate negative binomial model for trip demand functions derived from an indirect underlying translogarithmic utility function. Both time and money budgets were incorporated into the model structure via an effective or generalized budget constraint. A nested logit model of trip mode and destination was used to calculate the effective prices for each trip proposed via nested logsum expressions.
More in line with the present research, Ledesma et al. (2005) used a left truncated Poisson and a binomial logit model to analyse the repeat visitation in the Island of Tenerife, and Hellström (2006) used an inflated truncated bivariate Poisson lognormal model to analyse the households’ choice of overnight stays. Other related studies include Palmer-Tous et al. (2007) who used several count data models (Poisson, negative binomial, zero-inflated Poisson, zero-inflated negative binomial, truncated Poisson, zero-truncated negative binomial) to analyse the use of hire cars by tourists in Mallorca, Spain, and Moran et al. (2006) who also presented several count data models (negative binomial model, zero truncated negative binomial, negative binomial with truncation and endogenous stratification) to estimate the recreational value of mountain biking sites in Scotland. The authors concluded that correcting for endogenous stratification in addition to over-dispersion and truncation is needed to avoid biased results.
From our review of the literature, it is clear that the endogenous switching Poisson model has not been used before in tourism related studies. This is despite its clear advantage over the traditional Poisson model, particularly as it can account for unobserved heterogeneity and endogeneity in the covariates. This paper also innovates by focusing on the Azores Islands. More details about the methodology and the sample under analysis are provided in the next sections.
Dynamic Probit Model
The equation for the latent dependent variable defined on individuals and time is specified as a classic regression:
it i it it it y x y 1 ' *
with i = 1, . . . , N individuals and t = 2, . . . , T time periods, where *
it
y is the latent dependent variable and yit is the observed binary outcome variable, defined as: yit =1 if
0 *
it
y or yit = 0 else and where xit is a vector of explanatory variables and it~ N(0,
σ2
u). The subscript i indexes individuals and the subscript t indexes time periods. N is
taken to be large, but T is typically small and regarded as fixed, so that asymptotic are on N alone. Even when the errors it are assumed serially independent, the composite
error term, vit it it, will be correlated over time due to the individual-specific time-invariant αi terms, justifying the adoption of the dynamic probit model (Heckman,
1981; Orme, 1996; Wooldridge, 2005; Stewart, 2006).
Following Stewart (2006), the individual-specific random effects specification adopted implies equi-correlation between the vit in any two (different) periods:
2 2 2 , ) ( u is itv v Corr with t, s = 2, …, T; t ≠ s.
The standard (uncorrelated) random effects model also assumes αi uncorrelated with xit.
Alternatively, following Mundlak (1978) and Chamberlain (1984), correlation between αi and the observed characteristics in the model can be allowed for by assuming a
relationship between α and either the time means of the x-variables or a combination of their lags and leads, e.g.: αi = 𝑥 ′ia + ζi, where ζi ~ iid Normal and independent of xit and
it
for all i, t (Stewart, 2006).
In the case of the correlated random effects model, since y is a binary variable, a normalization is required. A convenient one is that u2 1. If it is normally distributed, the transition probability for individual i at time t, given αi, is then given by:
yit/xit,yit1, i
( yit1xit' i)(2yit1
P
Estimation of the model requires an assumption about the initial observations (Stewart, 2006).
Research Hypotheses
The tourism return choice can be explained by several factors. The theoretical framework supporting the present research is Fishbein and Ajzen’s (1980) theory of reasoned action (Baker and Crompton, 2000), as applied in management and economics research, and the role theory of tourism behavior (Pearce, 1982; Yannakis and Gibson, 1992) from the perspectives of sociology and ethnography. Both theories take into account different variables to explain tourism choice, namely destination attributes and travel characteristics. The tourist is regarded as a rational individual who decides to visit a location according to its attributes, conditioned by previous experience (Howard and Sheth, 1969). This assumptions highlights the importance of travel characteristics and destination attributes in the returning choice.
The survey questionnaire therefore gathered data pertaining to: 1) socio-economic demographic variables including income; 2) destination attributes, and 3) satisfaction (overall satisfaction and specific satisfaction). Using the survey data on these characteristics, we tested the following hypotheses:
Hypothesis 1(lagged dependent variable): the return choice is a positive function of
lagged repeat choice, signifying that there exists a persistence effect in return choice behavior. This hypothesis has not yet been tested in tourism research and consitutes an innovation of the present research.
Hypothesis 2 (Socio-economic characteristics): the return choice is a positive function
of individual socio-demographic characteristics such as age, gender, education and working status (Goodall and Ashworth, 1988; Woodside and Lysonski, 1989; Weaver et
al., 1994; Zimmer et al., 1995).
Hypothesis 3 (Income): the return choice is a positive function of the individual’s
income. This is a traditional hypothesis in tourism demand models, in which price, income and budget constraints define the frontier of consumption possibilities for travel (Hay and McConnel, 1979; Aguiló and Juaneda, 2000; De la Viña and Ford, 2001; Nicolau and Más, 2005).
Hypothesis 4 (Destination attributes and activities): the return choice is a positive
function of a destination’s attributes and activities experienced such as events, food quality, nightlife, beach and whale-watching, bird-watching and walking tours. Woodside and Lysonski (1989) argue that a destination’s image and its choice are influenced by destination attributes such as those considered in this study (Lundtorp and Wanhill, 2001).
Hypothesis 5 (satisfaction): Repeat visitation is affected by the level of tourists’
satisfaction with the destination. Several studies in the literature indicated that customer satisfaction results in repeat purchase and positive word of mouth (Oliver, 1980; Taylor and Baker, 1994; Zeithaml et al., 1996, Heung, 1999). In the tourism literature, it is also accepted that satisfaction has a positive influence on the revisit intention (Ross, 1993; Juaneda, 1996; Keane, 1997; Kozak and Rimmington, 2000; Baker and Crompton, 2000; Kozak, 2001; Caneen, 2003; Petrick, 2004; Yoon and Uysal, 2005; Alegre and Cladera, 2006; Um et al., 2006; Rojas and Camarero, 2008), particularly in highly competitive environment, where tourists are mainly paying for products that are cost
effective and leads to high value and satisfaction. The variable used to test this hypothesis is satisfaction.
Research Design
The survey was undertaken from April 2008 to September 2009, by the Observatório do Turismo dos Açores, using nonprobability quota sampling. Several waves of questionnaires were undertaken by direct interview of the tourists departing from São Miguel, Terceira and Faial airports, in the Azores, who were randomly approached to answer the questionnaire. The sample was defined by the confidence interval approach (Burns and Bush, 1995). The formula used to estimate a 95% confidence level was:
97 . 300 0562 . 0 ) 5 . 0 x 5 . 0 ( 95 . 1 e ) pq ( z n 2 2 2 2
Where z is the standard error associated with the chosen level of confidence (95%); p is the estimated variability in population (50%); q =1-p; and e is the acceptable sample error 5.62% (desired accuracy 95%). The amount of variability in the population is assumed to be 50%, which is frequently the case in social research (Chi and Qu, 2008). The interviewer approached the randomly-selected tourist while he/she was waiting in the departure lounge to board the flight home. The number of questionnaires to 300 and 16 waves were performed at regular 1-month intervals, reaching a total amount of 4800; assuming a response rate of 93.3%, gives 4800/0.993 = 4768 (Dillman, 1978).
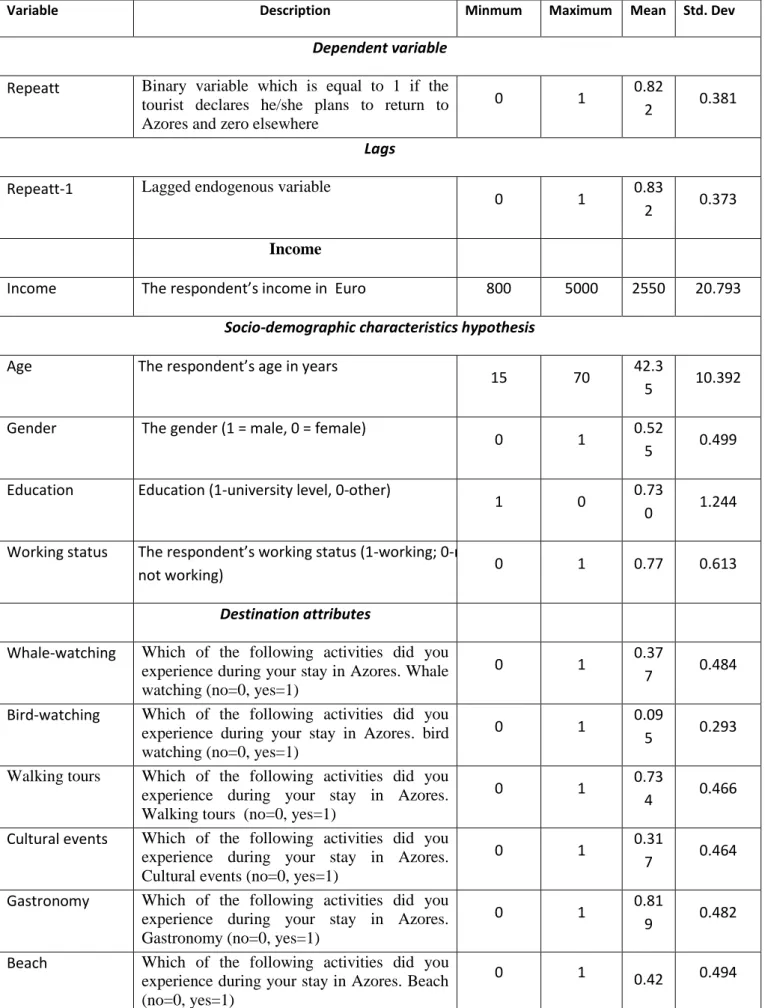
Most of the respondents were male (52%) with an average age of 33. On average, they were middle-class, with a family that includes one child. Other characteristics of the sample are summarised in Table 1.
Results
Table 1 shows also the observed variables in the questionnaire that assumed statistical significance in this model, the proposed questions and the corresponding scales. Respondents were asked to complete the questionnaire, which included questions concerning tourist socio-economic characteristics, destinations attributes and activities, and tourist satisfaction. Items described in each of these questions are in line with previous studies in the area (Sirakaya et al., 1996).
Insert Table 1 Here
Table 2 presents the results of the probit models estimated using the method of Stewart (2006) without initial conditions. Two models are estimated: a static probit panel data model and a dynamic probit model. The reference model is the dynamic probit model (Stewart, 2006). The other static probit model is estimated for comparison purpose.
Insert Table 2 Here
There is evidence that endogeneity is present in the data. Therefore, the dynamic probit with endogeneity accounts for endogeneity estimating the model with instrumental variables. No changes of sign are detected once endogeneity is considered, but we found important differences in the magnitude of the coefficients.
The log-likelihood value of the estimated standard probit is the higher among the estimated models, suggesting thus a better fit for the dynamic probit with endogeneity. This estimator allows for the endogeneity of the initial conditions but assumes no autocorrelation in the it. The overall fit of the model is reasonably good, with a Wald
test of 126.63. Taking the dynamic probit as reference, it is verified that the lambda (composite error variance) is positive and statistical significant and equal to 0.53 signifying that 53% of the composite error variance is attributed to the individual-specific effects; AR1 (first-order autoregressive process) is also positive and statistical significant implying that successive realizations of it are positive and correlated and theta (correlation between the error term and the exogenous parameters) is also positive and statistical significant implying that the error terms are correlated with the parameters and therefore endogeneity is present in the standard probit model. No change of sign is detected once endogeneity is considered, but important differences in the magnitude of the coefficients are found. Therefore results not accounting for endogeneity achieve biased inference.
The results show that the number of visits to the Azores Islands is explained by multiple variables. Particular interest resides in overall satisfaction, which validates previous research in repeat visitation (Opperman, 2000). Additionally, motivation issues, such as gastronomy appear to play a positive role on repeat visitors, validating previous results by Hong et al. (2009). Finally, some destination attributes such as whale-watching and bird-watching are negative and statistically significant.
Discussion and Conclusions
The paper analysed the determinants of repeat visits to the Azores Islands using two probit models, a static probit model and a dynamic probit model. From the results it was clear that Hypothesis 1 is not accepted because the lagged variable is negative and statistical significant. This result is the most innovative and important in the present research, signifying that despite positive signs of some variable, the lag variable is
negative and statistical significant signifying a persistent lagged declaration of no return. All published papers on return hypothesis have not presented such lagged effect and therefore none comparison can be done.
Hypothesis 2 is accepted as age and working status are positive and statistically significant, validating previous research using other modeling approaches (Barros and Assaf, 2011; Assaf et al., 2011) . This result signifies return tourism in Azores is done by older tourists and those that are working. Hypothesis 3 is not accepted as income is negative and statistical significant, which contradicts previous research on islands (Assaf et al., 2011). This result signifies that higher income tourists don’t return, which is also a specific conclusion that adds to hypothesis 1, signifying that, on average, tourists don’t return to Azores and those that return tend to be the oldest and those with lower income. Additional, we also accept Hypotheses 4 and 5 as both destination attributes and satisfaction seem to have a positive and significant impact on tourism return. This validates previous results on return (Alegre and Juaneda, 2006; Alegre and Cladera, 2006; Assaf et al., 2011). This result is the one this paper has in common with published papers in return hypothesis.
The general conclusion is that although destination attributes and satisfaction increase tourism return on Azores, the lagged variable and the negative effect of income are the distinct characteristics of this destination, signifying that, on average, the tourists do not return to the Azores and those that return are aged and less affluent.
Thus, it seems clear that future policies in the Azores should focus on upgrading hotel specific satisfaction attributes and on increasing other destination attributes. Targeting aged tourists that have a significant impact should also be included in a policy to attract desired types of tourists. Thus, by combining and acting on these results, it is clear that
there is an opportunity to refine policies to help increase repeat visits. However, new marketing strategies are needed to re-positioning this tourism destination on wealthier tourists and to increase the average number of those which want to return.
It might be also of potential value for tour operators to have a deeper insight into the variables that shape the decisions and actions of repeat tourists in the Azores. With a greater awareness of what these consumers require from a vacation, operators and organisations can focus on those statistically significant variables determined in the model when targeting their potential customers. The variables that increase repeat visits should also be the focus of future promotional campaigns. Similarly, the variables that decrease the repeat visitation should be controlled and addressed in order to minimise their potential effect.
How does this paper compare with previous research? While this paper supports some traditional results such as destination attributes, satisfaction (Opperman, 2000), it presents a negative income effect and the lagged effect is negative. This last result is the most distinctive result of this paper signifying that papers based in cross-section data are unable to obtain lagged effects and therefore unable to give a clear view of the destination effect.
A general conclusion is that tourists seem to behave similarly in different contexts relative to some variables, but not necessarily relative to other variables. Based on the lagged effect detected in the sample, the idea of simple probit models should be abandoned in favour of dynamic models allowing for lags and leads. This result implies that each destination has its own specificity, which justifies the existence of several studies and lagged effects seems to be of paramount importance.
References
Aguiló, E., and Juaneda, C. (2000), ‘Tourist expenditure for mass tourism markets’,
Annals of Tourism Research, Vol 27, No 3, pp 624-637.
Alegre, J. and Juaneda, C. (2006), ‘Destination Loyalty: Consumers’ Economic Behavior’, Annals of Tourism Research, Vol 33, No 3, pp 684-706.
Alegre, J. and Cladera, M. (2006), ‘Repeat Visitation in Mature Sun and Sand Holiday Destinations’, Journal of Travel Research, Vol 44, No 3, pp 288-297.
Assaf, A., Barros, C.P. and Machado, L.P. (2011), ‘Covariates of Repeat Tourism’,
Tourism Economics (forthcoming)
Ashworth, G. and Goodall, B. (1988), ‘Tourist images: Marketing considerations’ in Goodall, B. and Ashworth, G., eds, Marketing in the Tourism Industry: The Promotion
of Destination Regions, Croom Helm, London.
Baker, D.E. and Crompton, J. (2000), ‘Quality, satisfaction and behavioral intentions’,
Annals of Tourism Research, Vol 27, No 3, pp 785–804.
Barros, C.P. and Assaf, A. (2011), ‘Analyzing Tourism Return Intention to an Urban Destination’, Journal of Hospitality & Tourism Research (forthcoming)
Barros, C.P. and Machado, L.P. (2010), ‘The Length of Stay in Tourism’, Annals of
Tourism Research, Vol 37, No 3, pp 692-706.
Bigné, J.E., Sánchez, M.I. and Sánchez, J. (2001), ‘Tourism image, evaluation variables and after purchase behavior: inter-relationship’, Tourism Management, Vol 22, No 6, pp 607–616.
Bowen, D. (2001), ‘Antecedents of consumer satisfaction and dis-satisfaction(CS/D) on long-haul inclusive tours - a reality check on theoretical considerations’, Tourism
Management, Vol 22, No 1, pp 49–61.
Burns, A.C. and Bush, R.F. (1995), Marketing Research, Prentice-Hall, New Jersey. Caneen, J.M. (2003), ‘Cultural determinants of tourist intention to return’, Tourism
Analysis, Vol 8, No 2/4, pp 237-242.
Chamberlain, G. (1984), ‘Panel data’, in Griliches, Z. and Intriligator, M.D., eds,
Handbook of Econometrics, Vol. 2, No 2, North-Holland, Amsterdam, pp 1247-1318.
Chen, C.F. and Tsai, D.C. (2007), ‘How destination image and evaluative factors affect behavioral intentions?’, Tourism Management, Vol 28, No 4, pp 1115-1122.
Chi, G.Q.C. and Qu, H.L. (2008), ‘Examining the structural relationship of destination image, tourist satisfaction and destination loyalty: an integrated approach’, Tourism
Management, Vol 29, No 4, pp 624-636.
Cooper, C., Fletcher, J., Gilbert, D. and Wanhill, S. (1993), Tourism: Principles and
Practice, Pitman Publishing, London.
Costa, P. and Manente, M. (1995), ‘Venice and its visitors: A survey and a model of qualitative choice’, Journal of Travel and Tourism Marketing, Vol 4, No 3, pp 45-69. Court, B. and Lupton, D. (1997), ‘Customer Portfolio Development: Modeling Destination Adopters, Inactives, and Rejecters’, Journal of Travel Research, Vol 36, No 1, pp 35–43.
Crompton, J.L. (1979), ‘Motivations for Pleasure Vacation’, Annals of Tourism
Crompton, J.L. and Ankomah, P.K. (1993), ‘Choice Set Propositions in Destination Decisions’, Annals of Tourism Research, Vol 20, No 3, pp 461-476.
De La Viña, L. and Ford, J. (2001), ‘Logistic Regression Analysis of Cruise Vacation Market Potential: Demographic and Trip Attribute Perception Factors’, Journal of
Travel Research, Vol 39, No 4, pp 406-410.
Dillman, D.A. (1978), Mail and Telephone Survey: The Total Design Method, Wiley, New York.
Dunn Ross, E.L. and Iso-Ahola, S.E. (1991), ‘Sightseeing tourists’ motivation and satisfaction’, Annals of Tourism Research, Vol 18, No 2, pp 226-237.
Fishbein, M. and Ajzen, I. (1980), ‘Predicting and understanding consumer behavior: attitude-behavior correspondence’, in Ajzen, I. and Fishbein, M., eds, Understanding
Attitudes and Predicting Social Behavior, Prentice-Hall, Englewood Cliffs, New Jersey,
pp 148-172.
Fleischer, A. and Pizam, A. (2002), ‘Tourism Constraints among Israeli Seniors’,
Annals of Tourism Research, Vol 29, No 1, pp 106-123.
Goodall, B. and Ashworth, G., eds, (1988), Marketing in the Tourism Industry: The
Promotion of Destination Regions, Croom Helm, London.
Hay, M.J. and McConnel, K.E. (1979), ‘An Analysis of Participation in Nonconsumptive Wildlife Recreation’, Land Economics, Vol 55, No 4, pp 460-471. Heckman, James J. (1981), ‘The Incidental Parameters Problem and the Problem of Initial Conditions in Estimating a Discrete Time Discrete Data Stochastic Process’, in
Manski, C. and McFadden, D., eds, Structural Analysis of Discrete Data with
Econometric Applications, MIT Press.
Hellström, J. (2006), ‘A Bivariate Count Data Model for Household Tourism Demand’,
Journal of Applied Econometrics, Vol 21, No 2, pp 213-226.
Heung, V.C.S. (1999), A Study of Visitors Evaluation of Airport Restaurant Service
Quality in Hong Kong, Unpublished doctoral dissertation, University of Hong Kong,
Hong Kong.
Hong, S.K., Lee, S.W., Lee, S. and Jang, H. (2009), ‘Selecting revisited destinations’,
Annals of Tourism Research, Vol 36, No 2, pp 268-294.
Howard, J.A. and Sheth, J.N. (1969), A Theory of Buyer Behavior, John Wiley and Sons, New York.
Juaneda, C. (1996), ‘Estimating the probability of return visits using a survey of tourist expenditure in the Balearic Islands’, Tourism Economics, Vol 2, No 4, pp 339-352.
Keane, M.J. (1997), ‘Quality and pricing in tourism destinations’, Annals of Tourism
Research, Vol 24, No 1, pp 117-130.
Kockelman, K.M. and Krishnamurthy, S. (2004), ‘A new approach for travel demand modeling: linking Roy’s Identity to discrete choice’, Transportation Research Part B
Methodological, Vol 38, No 5, pp 459-475.
Kozak, M. and Rimmington, M. (2000), ‘Tourist Satisfaction with Mallorca, Spain, as an Off-Season Holiday Destination’, Journal of Travel Research, Vol 38, pp 260-269. Kozak, M. (2001), ‘Repeaters’ behavior at two distinct destinations’, Annals of Tourism
Ledesma, F.J., Navarro, M. and Pérez-Rodríguez, J.V. (2005), ‘Return to tourist destination. It is reputation after all?’, Applied Economics, Vol 37, No 18, pp 2055-2065.
Lee, C.K., Lee, Y.K. and Lee, B. (2005), ‘Korea's destination image formed by the 2002 World Cup’, Annals of Tourism Research, Vol 32, No 4, pp 839–858.
Lundtorp, S. and Wanhill, S. (2001), ‘The resort lifecycle theory: Generating Processes and Estimation”, Annals of Tourism Research, Vol 28, No 4, pp 947-964.
Mannell, R.C. and Iso-Ahola, S.E. (1987), ‘Psychological nature of leisure and tourism experience’, Annals of Tourism Research, Vol 14, No 3, pp 314-331.
Mazursky, D. (1989), ‘Past experience and future tourism decisions’, Annals of Tourism
Research, Vol 16, No 3, pp 333–344.
Menezes, A.G., Moniz, A. and Vieira, J.C. (2008), ‘The determinants of length of stay of tourists in the Azores’, Tourism Economics, Vol 14, No 1, pp 205-222.
Milman, A. and Pizam, A. (1995), ‘The Role of Awareness and Familiarity with a Destination: The Central Florida Case’, Journal of Travel Research, Vol 33, No 3, pp 21-27.
Moran, D., Tresidder, E. and McVittie, A. (2006), ‘Estimating the recreational value of mountain biking sites in Scotland using count data models’, Tourism Economics, Vol 12, No 1, pp 123-135.
Mundlak, Y. (1978), ‘On the pooling of time series and cross section data’,
Nicolau, J.L. and Más, J.F. (2005), ‘Stochastic Modeling: A Three-Stage Tourist Choice Process’, Annals of Tourism Research, Vol 32, No 1, pp. 49-69.
Oh, H. (1999), ‘Service quality, customer satisfaction, and customer value: A holistic perspective’, International Journal of Hospitality Management, Vol 18, No 1, pp 67– 82.
Oliver, R.L. (1980), ‘A cognitive model of antecedents and consequences of satisfaction
decisions’, Journal of Marketing Research, Vol 17, No 4, pp 460-469.
Oppermann, M. (1997), ‘First-time and repeat visitors to New Zealand’, Tourism
Management, Vol 18, No 3, pp 177-181.
Oppermann, M. (1998), ‘Destination Threshold Potential and the law of Repeat Visitation’, Journal of Travel Research, Vol 37, No 2, pp 131-137.
Oppermann, M. (2000), ‘Tourism destination loyalty’, Journal of Travel Research, Vol 39, No 1, pp 78-84.
Orme, C.D. (1997), ‘The initial conditions problem and two-step estimation in discrete panel data models’, Discussion Paper No. 9633, School of Social Sciences, University of Manchester.
Palmer-Tous, T., Riera-Font, A. and Rosselló-Nadal, J. (2007), ‘Taxing tourism: The case of rental cars in Mallorca’, Tourism Management, Vol 28, No 1, pp 271-279. Pearce, P.L. (1982), ‘Perceived changes in holiday destinations’, Annals of Tourism
Petrick, J.F., Morais, D.D. and Norman, W.C. (2001), ‘An Examination of the Determinants of Entertainment Vacationers’ Intentions to Revisit’, Journal of Travel
Research, Vol 40, No 1, pp 41-48.
Petrick, J.F. (2004), ‘Are loyal visitors desired visitors?’, Tourism Management, Vol 25, No 4, pp 463-470.
Poria, Y., Reichel, A. and Biran, A. (2006), ‘Heritage site management: Motivations and Expectations’, Annals of Tourism Research, Vol 33, No 1, pp 162-178.
Pritchard, M.P. (2003), ‘The attitudinal and behavioral consequences of destination performance’, Tourism Analysis, Vol 8, No 1, pp 61-73.
Rojas, C. and Camarero, C. (2008), ‘Visitors’ experience, mood and satisfactionin a heritage context: Evidence from an interpretation center’, Tourism Management, Vol 29, No 3, pp 525-537.
Ross, G.F. (1993), ‘Destination evaluation and vacation preferences’, Annals of Tourism
Research, Vol 20, No 3, pp 477–489.
Sheldon, P.F. (1995), ‘The Demand for Incentive Travel: An Empirical Study’, Journal
of Travel Research, Vol 33, No 4, pp 23-28.
Sirakaya, E., McLellan, R.W. and Uysal, M. (1996), ‘Modeling Vacation Destination Decisions: A Behavioral Approach’, Journal of Travel & Tourism Marketing, Vol 5, No 1-2, pp 57-75.
Sirakaya, E. and Woodside, A.G. (2005), ‘Building and testing theories of decision making by travellers’, Tourism Management, Vol 26, No 6, pp 815-832.
Spiggle, S. and Sewall, M.A. (1987), ‘A choice sets model of retail selection’, The
Journal of Marketing, Vol 51, No 2, pp 97-111.
Stewart, M.B. (2006), ‘Maximum Simulated Likelihood Estimation of Random Effects Dynamic Probit Models with Autocorrelated Errors’, The Stata Journal, Vol 6, No 2, pp 256-272.
Stynes, D.J. and Peterson, G.L. (1984), ‘A Review of Logit Models with Implications for Modeling Recreational Choices’, Journal of Leisure Research, Vol 16, No 4, pp 295-310.
Sönmez, S.F. and Graefe, A.R. (1998), ‘Determining Future Travel Behavior from Past Travel Experience and Perceptions of Risk and Safety’, Journal of Travel Research, Vol 37, No 2, pp 171-177.
Taylor, S.A. and Baker, T.L. (1994), ‘An assessment of the relationship between service
quality and customer satisfaction in the formation of customers’ purchase intentions’,
Journal of Retailing, Vol 70, No 2, pp 163-178.
Wooldridge, J.M. (2005), ‘Simple solutions to the initial conditions problem in dynamic, nonlinear panel data models with unobserved heterogeneity’, Journal of
Applied Econometrics, Vol 20, No 1, pp 39-54.
Um, S. and Crompton, J.L. (1992), ‘The Roles of Perceived Inhibitors and Facilitators in Pleasure Travel Destination Decisions’, Journal of Travel Research, Vol 30, No 3, pp 18-25.
Um, S., Chon, K. and Ro, Y. (2006), ‘Antecedents of revisit intention’, Annals of
Weaver, P.A., Weber, K. and McCleary, K.W. (2007), ‘Destination evaluation: The role of previous travel experience and trip characteristics’, Journal of Travel Research, Vol 45, No 3, pp 333-344.
Weaver, P.A., McCleary, K.W., Lapisto, L. and Damonte, L.T. (1994), ‘The Relationship of Destination Selection Attributes to Psychological, Behavioral and Demographic Variables’, Journal of Hospitality Marketing and Management, Vol 2, No 2, pp 93-109.
Woodside, A.G. and MacDonald, R. (1994), ‘General system framework of customer choice processes of tourism services’, in Gasser, R. and Weiermair, K., eds, Spoilt for
Choice, Kultur Verlag, Vienna, pp 30-59.
Woodside, A.G. and Lysonski, S. (1989), ‘A General Model of Traveler Destination Choice’, Journal of Travel Research, Vol 27, No 4, pp 8-14.
Woodside, A.G. and Dubelaar, C. (2002), ‘A General Theory of Tourism Consumption Systems: A Conceptual Framework and an Empirical Exploration’, Journal of Travel
Research, Vol 41, No 2, pp 120-132.
Yannakis, A. and Gibson, H. (1992), ‘Roles tourist play’, Annals of Tourism Research, Vol 19, No 2, pp 287-303.
Yoon, Y. and Uysal, M. (2005), ‘An examination of the effects of motivation and satisfaction on destination loyalty: a structural model’, Tourism Management, Vol 26, No 1, pp 45-56.
Zeithaml, V.A., Berry, L.L. and Parasuraman, A. (1996), ‘The Behavioral
Zimmer, Z., Brayley, R.E. and Searle, M.S. (1995), ‘Whether to Go and Where to Go: Identification of Important Influences on Seniors’ Decisions to Travel’, Journal of
Table 1. Variable Characteristics
Variable Description Minmum Maximum Mean Std. Dev
Dependent variable
Repeatt Binary variable which is equal to 1 if the tourist declares he/she plans to return to Azores and zero elsewhere
0 1 0.82
2 0.381
Lags
Repeatt-1 Lagged endogenous variable
0 1 0.83
2 0.373
Income
Income The respondent’s income in Euro 800 5000 2550 20.793
Socio-demographic characteristics hypothesis
Age The respondent’s age in years
15 70 42.3
5 10.392 Gender The gender (1 = male, 0 = female)
0 1 0.52
5 0.499 Education Education (1-university level, 0-other)
1 0 0.73
0 1.244 Working status The respondent’s working status (1-working; 0-not
not working) 0 1 0.77 0.613
Destination attributes
Whale-watching Which of the following activities did you experience during your stay in Azores. Whale watching (no=0, yes=1)
0 1 0.37
7 0.484 Bird-watching Which of the following activities did you
experience during your stay in Azores. bird watching (no=0, yes=1)
0 1 0.09
5 0.293 Walking tours Which of the following activities did you
experience during your stay in Azores. Walking tours (no=0, yes=1)
0 1 0.73
4 0.466 Cultural events Which of the following activities did you
experience during your stay in Azores. Cultural events (no=0, yes=1)
0 1 0.31
7 0.464 Gastronomy Which of the following activities did you
experience during your stay in Azores. Gastronomy (no=0, yes=1)
0 1 0.81
9 0.482 Beach Which of the following activities did you
experience during your stay in Azores. Beach (no=0, yes=1)
6 Night life Which of the following activities did you
experience during your stay in Azores. Night life (no=0, yes=1)
0 1 0.29
7 0.457
Satisfaction
Overall Overall satisfaction (1-satisfied, 0-not
satisfied) 0 1
0.86
9 0.086 Accommodation Specific satisfaction with accommodation(1
hotel, 0-other) 0 1
0.90
1 0.924
Table 2. Parameter Estimates (dependent variable: Repeat) Panel data Probit Model Dynamic Probit model Variables Coefficients (z-statistic) Coefficients (std-error) Repeatt-1 _ -0.010 (-0.70) Repeatt-2 _ -0.108 (-7.68)* Income -0.042 (-3.32)* -0.072 (-7.93)* Income t-1 _ -0.014 (-1.69) Age 0.056 (2.60)* 0.016 (2.91)* Gender -0.044 (-1.08) -0.006 (-0.46) Education -0.012 (-0.65) 0.0007 (0.12) Working status 0.076 (2.99)* 0.039 (3.43)* Whale-watching -0.210 (-4.30)* -0.085 (-5.55)* Bird-watching -0.210 (-2.92)* -0.105 (-4.00)* Walking tours -0.054 (-1.08) -0.004 (-0.29)
Cultural events -0.171 (-3.41)* -0.082 (-5.19)* Gastronomy 0.340 (6.02) 0.140 (6.95)* Beach 0.006 (0.14) -0.033 (-2.21) Night life 0.146 (2.70)* 0.025 (1.57) Overall 0.063 (3.02)* 0.032 (4.64)* Accommodation 0.018 (1.52) 0.008 (2.00) Constant 0.070 (0.31) 0.992 (9.98)* Lambda 0.531 (4.121)* AR1 0.992 (3.218)* Theta 1.132 (6.219)* Nobs 4768 4768 Log Likelihood -2090.26 -3012.14 LR Chi(29) Proba>chi2 243.43 0.0000 394.75 (0.000) *Means statistically significant at 1%;