ON THE TRAILS OF THE GENDER “LIFE SATISFACTION” GAP: A MIXED LEVEL
ANALYSIS
DUMBRAVEANU ANDRADA
PHD STUDENT, WEST UNIVERSITY OF TIMISOARA, FACULTY OF ECONOMICS AND
BUSINESS ADMINISTRATION
e-mail:dumbraveanu.andrada@gmail.com
Abstract
Over the past few decades the growing focus on wellbeing has researchers questioning whether policies oriented solely towards economic growth will provide increases in citizen subjective wellbeing. The current paper aims to highlight that economic growth isn’t the only contributor to increases in life satisfaction within a country, but also social inequality and good governance play a key role in the wellbeing of an individual. With regards to social inequality, the research is focused particularly on the gender life satisfaction, highliting discrepancies in subjective wellbeing between men and women. Our findings suggest that women are less satisfied with their lives as opposed to the their male counterparts. Moreover, we observe that factors linked to good governance have strong and significant impact on life satisfaction and the increases in income provide increases in life satisfaction only to a certain point.
Cuvinte cheie: gender differences, life satisfaction, World Governance Indicators
Clasificare JEL : J16, I31, I38
1.Introduction and the context of the study
Over the course of the last 2 decades there has been noticeable progress with regards to the topic of gender equality from an objective measure perspective: the gender wage gap has reduced it’s dimensions, educational attendance has increased and the women’s freedoms regarding labour and family have increased significantly, the women’s right movement, the development and availability of oral contraceptive solutions, the decline in the male -female wage gap, the increase in women’s educational attendance and increased participation in the labour market. (Rouseau, 2009; Stevenson and Wolfers, 2009)
Based on data from Eurostat, over the recent years female labour participation has increased compared with that of men. On the other hand, positive market conditions for women have likely improved their bargaining power in the home by raising their opportunities outside of marriage. (Stevenson and Wolfers, 2009)
Given these shifts one would expect to see movement in life satisfaction towards women and away from men. However, results present in this paper indicate that it is quite the opposite, as men’s subjective wellbeing is increasing as compared to that of women. Stevenson and Wolfers (2009) demonstrate that women’s happiness declined both absolutely and relative to men’s in a consistent manner amid groups, in the way that women no longer report being than men, in many cases, they now report happiness that under that of men. Furthermore, literature shows that this change has occurred throughout the better part of the industrialised world.
Using data from the Eurobarometer survey on 27 EU countries over a time span of 10 years we find that on average life satisfaction for men has decreased by 0.97% over the analysed period while for women it has witnessed a decline on average of 1.05%.
The paper aims to contribute to the current strand of literature two-fold. Firstly, we aim to assess the impact of gender on life satisfaction, by analysing the the evolution of life satisfaction for all 27 EU countries over a time span of 10 years. In order to do so, we will build an econometric model on two levels using a multi-level mixed linear framework. The first level will contain the macroeconomic data, while the second level will contain the microeconomic data. One of the reasons for this approach is to highlight that despite increased labour participation and more “open” job markets, women’s subjective wellbeing has not improved despite the apparent improved conditions they may benefit from. Secondly, we want to understand how various governance indicators such as control of corruption, government effectiveness and regulatory quality impact life satisfaction. The rationale for this approach is to demonstrate that policy frameworks focused on economic growth do not necessarily lead to increases in citizen’s life satisfaction.
reported a nonsignificant trend in that direction. Nolen-Hoeksema and Rusting (1999) report that “a number of studies have found that women report experiencing greater happiness and more intense positive emotions than men” (p. 333). Studies yielding similar results are those of Blanchflower and Oswald (2001), DiTella, MacCulloch, and Oswald (2001) and Oswald (1997). Esterlin (2003) used data from the General Social Survey and cohort analysis (also called a synthetic panel) to follow the same people as they age. The author finds that reversal takes place in the relative wellbeing of women and men as they age from around 60 years old onward. The results of the study indicate that before the previously mentioned age, women are usually happier than men. However, during their sixties, men’s subjective wellbeing becomes greater than those of their female counterparts.
According to Rousseau (2009) the gender happiness gap favoured women in the mid seventies, and reversed by the mid-two-thousands. The author studies three dimensions through which women may differ from men in terms of happiness: life cycle, effect of time spent working and the effect of labour force status. The results of the study suggest that women tend to be happier than men at a young age but a reversal happens after retirement.
The second point of focus of the current paper is to highlight that policies focused solely on economic growth do not necessarily yield increases in life satisfaction. We use the Governance Matters indicators to assess how these variables play a role in influencing life satisfaction. According to the World Bank (1992), governance can be defined as the “manner in which power is exercised in the management of a country's economic and social resources for development”. A definition provided by Peters (1995) states that governance refers to leading and involves the ability of human institutions to control their societies. For our current paper we take into account the following indicators: political stability and absence of violence, government effectiveness, regulatory quality, rule of law and control of corruption. The first indicator, political stability indicates perceptions regarding the possibility that the government will de destabilised or overthrown as a result of unconstitutional or violent actions such as terrorism. The second indicator, government effectiveness reflects the perceptions regarding the quality of civil and services and the perceived independence from political pressures, the quality of policy and design and implementation and the credibility of the government’s commitment to follow through such policies. The regulatory quality indicator showcases a government’s ability to design and apply strong policies and regulations that allows and private sector development. The rule of law indicator highlights the confidence individuals have in the rules of society and whether they abide them or not. Particular emphasis is placed on the quality of police service, contract enforcement, the judicial system and the likelihood of crime and violence. Lastly, the control of corruption indicator highlights the limit towards which public power is exercised for private gain.
According to Hirschman (1970), declining government performance will have negative effects on a country’s citizens and determine them to utilise their possibilities for exit (e.g. not paying taxes) or voice their concerns (e.g. voting for the other party). The extent to which the previous two options are used is likely to depend on the degree of loyalty towards the government. Uslaner and Brown (2005) demonstrate the existence of strong independencies between socio-economic equality, good governance and trust. The authors argue that a high level of inequality coupled with a lack of social trust can make it almost impossible for governments to be effective. Lastly, Ott (2010) finds that there is high correlation between the quality of government and average happiness. Additionally, the author finds that the quality of government and inequality in happiness is lower, in particular for democratic quality.
2. Data and Methodology
A theoretical formulation of our research hypothesis would be as following:
�
=
1�
+
2���
+
3���
2+
4�
�
�
+
5�
�
�
2+
6� �
� �
+
7� �
� �
2+
8�
+
9�
2+
10�
+
11�
2+
12�
�
�
�
+
13�
+
14�
2(1)
For our current study we use a two-level model, where the outcome, life satisfaction, was expressed as a function of gender, corruption, political stability, government effectiveness and regulatory quality. The data for this study was obtained from waves of the EuroBarometer, a public opinion survey conducted by the European Commission since 1973, for a time span between 2001-2011. The survey was conducted using face to face interviews. The entire sample used in the current study consists of 491,926 individuals, out of which 266,642 female and 225,284 male. Apart from different demographic questions (including sex, age education ended and employment status), participants were also asked how satisfied they were with their lives at the time of the survey using a scale from 1 to 4, where 1 is “Very Satisfied” and 4 is “Not at all Satisfied”. As we aimed to assess gender differences in life satisfaction we coded with 1 female and 2 male. Hence, given the above mentioned framework the estimated parameter will highlight whether life satisfaction differs by gender.
The analysis starts at a macroeconomic level examining the connection between life satisfaction and GNI, Corruption, Political Stability, Regulatory Environment and Rule of Law.
�
=
2���
+
3���
2+
4�
�
�
+
5�
�
�
2+
6� �
� �
+
7� �
� �
2+
8�
+
9�
2+
10�
+
11�
2(2)
We use GNI in both it’s simple and quadratic form to search for non-linear relationships between life satisfaction and GNI, as the literature on the subject is ambiguous, with papers highlighting both linear and non-linear relationships between subjective wellbeing and income. The subject of linking subjective wellbeing to income has gained increased attention with Easterlin’s paper (1974) where the author finds that increases in average income did not lead to growth in average wellbeing. On the other hand, authors such as Stevenson and Wolfers (2008) find positive relationships between income and life satisfaction. Lastly, another hypothesis accompanying the income - subjective wellbeing relationship is that of the existence of a “satiation point”, which acknowledges the existence of a relationship between income and SWB for those for which the basic needs have not been met, however beyond a certain income threshold increases in this variable are unrelated to SWB (Stevenson, Wolfers, 2013). From an empirical standpoint literature is less clear. Some authors, such as Veenhoven (1991), using data from the World Values Survey and curvilinear functions to explore this subject. On the other hand, other authors, (e.g. Schyns, 2002) believe there is not sufficient evidence to sustain a non-linear relationship.
As the paper aims to explore the connection between life satisfaction social / political capital we have included the World Bank’s Governance Matters Indicators. For the purpose of our paper we take into consideration the following:
- Political Stability
- Government Effectiveness - Regulatory Quality - Rule of Law
- Control of Corruption
The inclusion of the corruption variable is based on the premise that individuals living in countries with corrupt and unreliable government institutions display lower levels of subjective wellbeing (Helliwell, Huang, 2008). Also, Helliwell and Huang (2006) found that governance has a significant importance on life satisfaction. Lastly, Helliwell (2008) demonstrated that perception of corruption has a negative impact on life satisfaction. While most the previously mentioned studies describe a linear relationship between corruption and life satisfaction, we use a quadratic shape for the corruption variable to check for the existence of nonlinearities. Additionally, institutions exert a direct effect on economic growth and it is perceived that any association with life satisfaction is biased. This issue has been addressed by Welsch (2008) by using a system of equations: one of GDP and corruption on happiness and another corruption on happiness. The authors find that the direct welfare effect of corruption is much larger than the indirect effect via income. The introduction of political stability as an explanatory variable in our paper is based on the premise that citizen’s living in a stable country are likely to have a higher life satisfaction. We use a similar approach for the other remaining macroeconomic variables including their quadratic forms in order to assess the existence of any non-linear relationships between them.
For the second level of the model we have the following equation:
�
=
1�
+
12�
�
�
�
+
13�
+
14�
2(3)
for this change presented in the literature related to this topic is the fact that from the 70’s onwards there has not been any real reform in fighting again female discrimination. Another paradigm that would explain this shift is the change in woman’s position in society and in the family, as she is no longer regarded as strictly the “guardian of the home, but a direct competitor on the labour market that can provide for herself and the family. A stream of literature regards the increasing aspirations as one of the main factors probably to mediate between education and life satisfaction (Clark and Oswald 1994, Frey and Stutzer 2002, Ferrante 2009). Hence, education is perceived to be neutral in terms of life satisfaction. However, there is increasing evidence that education is associated with higher levels of life satisfaction apart from its indirect association through health, employment status and income. In his study, Helliwell (2003) highlights two other channels: social participation and social capital. While the literature on job satisfaction and the connection between life satisfaction and unemployment has seen exponential growth, there are still few studies showing how career advancement or the sector one works in has an impact on life satisfaction. This is the reason why we add employment type to the equation together with its squared form in order to see whether is a non-linear relationship between the level of career advancement and life satisfaction.
3. Results
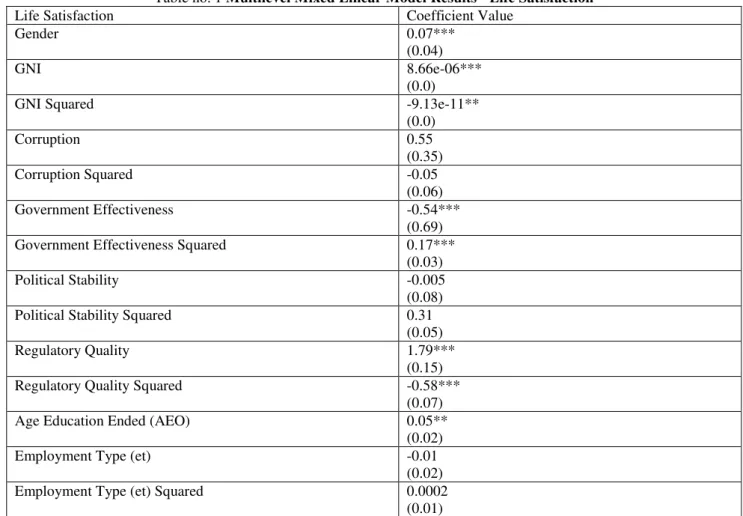
As one of the main objectives is to assess the impact of the World Governance Indicators on life satisfaction, we use a multi-level modelling framework. As previously mentioned, we have included squared variables in order to search for existing non-linear relationship between the dependent and the explanatory variables. The results for the multilevel model are reported in Table 1.
Table no. 1 Multilevel Mixed Linear Model Results - Life Satisfaction
Life Satisfaction Coefficient Value
Gender 0.07***
(0.04)
GNI 8.66e-06***
(0.0)
GNI Squared -9.13e-11**
(0.0)
Corruption 0.55
(0.35) Corruption Squared -0.05
(0.06) Government Effectiveness -0.54***
(0.69) Government Effectiveness Squared 0.17***
(0.03) Political Stability -0.005
(0.08) Political Stability Squared 0.31
(0.05) Regulatory Quality 1.79***
(0.15) Regulatory Quality Squared -0.58***
(0.07) Age Education Ended (AEO) 0.05**
(0.02) Employment Type (et) -0.01
(0.02) Employment Type (et) Squared 0.0002
(0.01)
Source: Eurobarometer (2001 – 2011), World Bank (2001 – 2011); Coeffiecients were obtained via using the multi-level mixed linear regression model in Stata 12 (own calculations)
that after a certain age, men become more happier than women as the latter tend to suffer a lot more from widowhood. Also, similar results appeared in the study from Wood, Rhodes and Whelan (1989), where studies recent for that period yielded a stronger sex difference favoring men. Additionally, the authors used general evaluation measures to assess gender differences in life satisfaction, favouring men as opposed to women. however, when the authors used happiness and life satisfaction measures are used women appear to be happier / more satisfied than men. Also, results are in line with research on negative aspects of wellbeing, highlighting higher levels of depression, personal discomfort and mental disorganization in women than in men (Gove, Tudor, 1973). Also, Stevenson and Wolfers (2009) find that men are happier than women. An argument provided by the authors was that decreases in gender discrimination did not improve since 1970, or at least have not been perceived at a subjective level by women. Additional explanations provided by the authors were: decreased social cohesion, increased anxiety and neuroticism and increased household risk. Lastly, Rousseau (2009) finds that there has been a decline in women’s happiness levels since 1975. Additionally, the findings within that paper highlighted that in 2006 there has been about a 5% gender happiness gap.
With regards to the relationship between life satisfaction and GNI we observe the relationship takes the form of an inverted U-shape and is statistically significant at 5% level. This results suggests that beyond a certain threshold life satisfaction is no longer influenced by increases in average income, and that the latter variable is more likely to be influenced by other socio-political factors such as the effectivenes of government policies and political stability. This is in line with the argument postulated by Zimmerman et. al (2012) which provides an answer on why a poor and a rich country can have identical happiness indices: as income increases happiness takes an inverted U-shaped pattern. For the situations where per capita incomes are low enough, individuals become happier if incomes increase. The authors argue, that after a certain level of per-capita incomes is reached, the variable becomes less important and one’s happiness is in fact determined by society’s lag with respect to income distribution as mediated by the unemployment rate. They results indicate that in low income countries, per-capita income significantly increases happiness while unemployment does not have a negative impact. For the high-income countries, however, the authors find that unemployment rate drives income into insignificance and becomes significant, exerting a negative effect. Similarly, a study from Desmeules (2002) highlights an inverted U-shape relationship between variety and the positiveness of consumption experience. The author finds that happiness increases with few options, however once a certain level is reached, more options mean less happiness. Another study, from Diener and Seligman (2004) showcases that there will be only small increases in wellbeing once a income threshold is reached. In a similar manner, Clark et. al (2008), and DiTella and MacCulloch (2008) claim that beyond a certain level increases in economic growth stop generating increases in happiness. Layard (2003) attempts to obtain the threshold level beyond which further income no longer generates increases in well-being. The author finds that the turning point is above $15,000 per head.
With regards to the corruption variable we see that the model does not find it statistically significant. This may be also caused by the connection between the variables used in the Governance Matters indicators. Abdallah et. al (2007) tested six variables from the World Bank’s Governance Matters reports. The author finds that these variables show strong inter-correlations, highlighting the possibility that the inclusion of one the six may exclude the other five from the model. However, the author emphasises that this does not mean that one variable is more important the the other, but that overall quality of governance matters to life satisfaction for the analysed group of countries and that it was best captured by the “control of corruption” indicators. On the other hand we find that government effectiveness, together with its squared form are statistical significant at a 1% level. This highlights that up to a certain point increases in government effectiveness are likely to lead to an increase in life satisfaction. Such a result can be explained by the idea that initially citizens are likely to oppose new stringent government regulations meant to reduce issues such as crime and corruption due to the fact they are used to such environments. Post this point we see that increases in effectiveness actually has a beneficial effects on a an individual’s life satisfaction. Similarly to the control of corruption variable, the political stability variable turns up as statistically insignificant. The requlatory quality variable turns up to be statistical significant at 1% level. The relationship between the previously mentioned and life satisfaction takes the form of a inverted U-shape, with the positive effects exceeding the negative impacts. Similar to the study by Abdallah et. al., we analyse the correlation between the control of corruption variable and regulatory quality (Table 2). Findings suggest a positive correlation between the two variables that could be one the reasons why the control of corruption variable is not showing statistically significant results. We find similar results for the case of political stability and regulatory quality (positive correlation).
Table no. 2 Correlation Matrix
Selected Variable Regulatory Quality Control of Corruption 0.72
Political Stability 0.73
Source: Eurobarometer (2001 – 2011), World Bank (2001 – 2011); Coeffiecients were obtained via using the multi-level mixed linear regression model in Stata 12 (own calculations)
education the more satisfied they are with their lives. This aspect can be explained by the fact that in general, people with higher education are perceived as having better jobs, improved working conditions, higher incomes and more benefits. For the employment type we find that the variable is not statistically significant.
4. Conclusions
The current paper aims to analyse the gap in life satisfaction between men and women using a sample of 27 EU countries over a time span of 10 years. Results suggest that men seem to present an increased life satisfaction as opposed to women. More over, it would seem that despite the apparent movements against female discrimination this phenomena is still persistent leaving a dent in women’s life satisfaction. These results are in online with the more recent literature on this topic, displaying a radical change in results as opposed to the first studies on “gender happiness gap” that took place in the ’70’s, where women appeared to have a higher life satisfaction than men. As highlighted by authors such as Stevenson and Worlfers (2013), the paper showcases that during the analyzed period men have shown higher life satisfaction than their female counterparts. This outcome can be the resulting impact of multiple forces (socio-economic – declining social cohesion, increased anxiety and change of role of women in society – they are aggregating satisfaction over a broader domain). Secondly, with regards to the impact governance on life satisfaction. From here there arises the question of whether policy makers should target increased female labour participation, and through that life satisfaction, or they should target life satisfaction separately.
Regarding the relationship between the World Bank’s Governance Indicators and life satisfaction we find that there a few non-linear relationships between some of these indicators and life satisfaction. For instance we find an inverted U-shape between GNI and life satisfaction, this indicates that after a certain threshold increases in income do not lead to increases in life satisfaction. Additionally, we find that government effectiveness indicates towards a U-shaped relationship with life satisfaction where initial increases in government effectiveness lead to a decline in life satisfaction as a result of lack of familiarity and suspicion from the country’s residents. Post a certain point however, increases of this variable lead. These results have important implications from a policy perspective, highlighting that policies oriented only towards economic growth do not guarantee increased life satisfaction of a country’s citizen’s. More so, it indicates that elements such as government effectiveness and regulatory quality are likely to have a stronger impact on life satisfaction than focus on increases in income.
Further research on the topic of gender differences should aim to explore the differences in impact of governance indicators based on gender. Additionally, with regards to the “gender life satisfaction gap” further research is required, focusing on additional social variables such as leisure time and the maternal working hours within the country to provide a clearer understanding of the differences in subjective wellbeing.
5.Bibliography
1Rousseau, J.B., “The life Cycle of Happiness”, available online at:http://www-personal.umich.edu/~jbgrou/, 2009; 2 Stevenson, B., Wolfers, J., “The paradox of declining female happiness”, available online at:
http://isites.harvard.edu/fs/docs/icb.topic457678.files/WomensHappiness.pdf, 2013;
3Wood, W., Rhodes, N., Whelan, M., “Sex differences in positive wellbeing: A consideration of emotional style
and marital status”, Psychological bulletin, Vol. 106, No.2, 249-264, 1989;
4Nolen-Hoeksema, S., Rusting, C., “Gender differences in well-being”. In D. Kahneman, E. Diener, & N. Schwarz (Eds.), Foundations of hedonic psychology: Scientific per- spectives on enjoyment and suffering, New York: Russell Sage Foundation, 1999;
[5] Blanchflower, D., Oswald, A., “Well-being over time in Britain and the USA”, The Warwick Economics Research Paper Series 616, University of Warwick, Department of Economics, 2001;
[6] Di Tella, R., MacCulloch, R. J., Oswald, A. J.,„Preferences over inflation and unemployment: evidence from surveys of happiness”, American Economic Review, 91:1, 335-341, 2001;
[7] Oswald, A.J., “Happiness and economic performance”, Economic Journal, 107:445, 1815-31, 1997;
[8] Easterlin, R., “Happiness of Women and Men in Later Life: Nature, Determinants, and Prospects”, available online at:
http://www.google.ch/url?sa=t&rct=j&q=&esrc=s&source=web&cd=2&cad=rja&uact=8&ved=0CCQQFjAB&url=htt
p%3A%2F%2Fwww- bcf.usc.edu%2F~easterl%2Fpapers%2FHappLate.pdf&ei=RuvHVPPkBYK8UbnigHA&usg=AFQjCNFsLJlH-Te-0QSeqb67xraX5MsHBA&bvm=bv.84349003,d.d24, 2003;
[9] Hirschman, A.O., „Exit, Voice, and Loyalty: Responses to Decline in Firms, Organizations, and States”, Cambridge, MA: Harvard University Press, 1970;
[10] Uslaner, E.M., Brown, M., “Inequality, trust, and civic engagement”, available online at:
http://www.gvpt.umd.edu/uslaner/uslanerbrownapr.pdf, 2005;
[11] Ott, J.C., “Government and happiness in 130 Nations: Good Governance Fosters Higher Level and More Equality
[12] Lucas et. Al., “Unemployment Alters the Set-Point for Life Satisfaction”, available online at:
http://www.google.ch/url?sa=t&rct=j&q=&esrc=s&source=web&cd=1&cad=rja&uact=8&ved=0CCAQFjAA&url=htt
p%3A%2F%2Fwww.ncbi.nlm.nih.gov%2Fpubmed%2F14717825&ei=HO_HVPG5H4n0UrXPg-gD&usg=AFQjCNGypmXFMB2Nzo4ITMZQz0ARBrxPhA&bvm=bv.84349003,d.d24, 2003;
[13] Easterlin, R., “Does Economic Growth Improve the Human Lot?”, available online at:
http://www.google.ch/url?sa=t&rct=j&q=&esrc=s&source=web&cd=3&cad=rja&uact=8&ved=0CC8QFjAC&url=http %3A%2F%2Fgraphics8.nytimes.com%2Fimages%2F2008%2F04%2F16%2Fbusiness%2FEasterlin1974.pdf&ei=2e_ HVJzMA9HraKTYguAN&usg=AFQjCNHZyTYx_wuzxQIsItt0kffJC5VdoQ&bvm=bv.84349003,d.d2s, 1974; [14] Stevenson, B., Wolfers, J., “Economic Growth and Subjective Wellbeing: Reassessing the Easterlin Paradox”, NBER Working Paper 14282, National Bureau of Economic Research, 2008;
[15] Veenhoven, R., “Is happiness relative?”, available online at:
http://www2.eur.nl/fsw/research/veenhoven/Pub1990s/91a-full.pdf, 1991;
[16] Schyns, P., "Wealth of Nations, Individual Income and Life Satisfaction in 42 Countries: A Multilevel Approach.”, Social Indicators Research, 60(1-3), pp. 5-40, 2002;
[17] Heliwell, J., Huang, H., “Well-being and trust in the workplace”, available online at:
http://www.nber.org/papers/w14589.pdf, 2008;
[18] Helliwell, J., Huang, H., "How's Your Government? International Evidence Linking Good Government and Well-Being," NBER Working Papers 11988, National Bureau of Economic Research, 2006;
[19] Helliwell, J., “Life satisfaction and quality of development”, NBER Working Papers 14507, National Bureau of Economic Research, 2008;
[20] Welsch, H., “ The welfare cost of corruption”, Applied Economics, Vol. 40, Issue 14, Taylor and Francis, p.1839 -1849, 2008;
[21] Clark, A.E., Oswald, A.J., "Unhappiness and Unemployment", Economic Journal, 104, 648-659, 1994;
[22]Frey, B., Stutzer, A., “The Economics of Happiness”, available online
at:http://www.bsfrey.ch/articles/365_02.pdf, 2002;
[23] Ferrante, F., “Education, Aspirations and Life Satisfaction”, Kyklos, Vol. 62, Issue 4, p. 542-562, Wiley Online Library, 2009;
[24] Helliwell, J.F., “How’s Life? Combining Individual and National Variables to Explain Subjective Well-being”, Economic Modelling, Vol. 20, pp. 331-360, 2003;
[25] Desmeules, R.,“The Impact of Variety on Consumer Happiness: Marketing and the Tyranny of Freedom,”
Academy of Marketing Science Review (12), pp. 1-18, 2002;
[26]Diener, E., Seligman, E., “Beyond Money”, available online at:
https://www.psychologicalscience.org/pdf/pspi/pspi5_1.pdf, 2004;
[27] Clark et. al., “Lags And Leads in Life Satisfaction: a Test of the Baseline Hypothesis”, The Economic Journal,
Vol. 118, Issue 529, p.F222-F243, 2008;
[28] DiTella, R., MacCulloch, R., “Happiness Adaptation to Income beyond “Basic Needs”, NBER Working Papers
14539, National Bureau of Economic Research, 2008;
[29]Layard, R., “Happiness: Has Social Science a Clue?”, available online
at:http://www.stoa.org.uk/topics/happiness/Happiness%20-%20Has%20Social%20Science%20A%20Clue.pdf, 2003; [30]Abdallah et. al., “Estimating worldwide life satisfaction”, available online at:
http://www.google.ch/url?sa=t&rct=j&q=&esrc=s&source=web&cd=1&cad=rja&uact=8&ved=0CCUQFjAA&url=htt p%3A%2F%2Fwww.sciencedirect.com%2Fscience%2Farticle%2Fpii%2FS092180090700537X&ei=PuXLVNzHIcL5 UPmLgdgE&usg=AFQjCNFUV5ktKEQptwqabQ283fNbWEkTCQ&bvm=bv.84607526,d.d24, 2007;